Charging spectrum of a small Wigner crystal island.
Abstract
Charging of a clean two-dimensional island is studied in the regime of small concentration of electrons when they form the Wigner crystal. The number of electrons in the island is assumed to be not too big (). It is shown that the total energy of the island as a function of has a quasi-periodic component of a universal shape, that is independent of the form of electron-electron interactions. These oscillations are caused by the combination of the geometric effects associated with packing of the triangular lattice into the circular island. These effects are: the shell effect, associated with starting a new crystalline row, and the so-called confinement polaronic effect. In the presence of close metallic gates, which eliminate the long-range part of the electron-electron interactions, the oscillations of the energy bring about simultaneous entering of the dot by a few electrons.
pacs:
PACS numbers: 73.20.Dx, 73.40.Gk, 73.40.SxI Introduction
In recent experiments[1, 2] the charging of a quantum dot is studied by the single electron capacitance spectroscopy method. The quantum dot is located between two capacitor plates: metallic gate and heavily doped GaAs layer. Tunneling between the dot and the heavily doped side is possible during the experimental times while barrier to the metal is completely insulating. DC potential and a weak AC potential are applied to the capacitor. With the increase of the differential capacitance experiences periodic peaks when addition of a new electron to the dot becomes possible. The spacing between two nearest peaks can be related to the ground state energy of the dot with electrons:
| (1) |
Here is a geometrical coefficient, is the charging energy, is the capacitance of the dot with electrons. It was observed in Refs. [1, 2] that at a low concentration of electrons or in a strong magnetic field the nearest peaks can merge, indicating that at some values of two electrons enter the dot simultaneously. In other words some charging energies apparently become zero or negative. In a fixed magnetic field this puzzling event is repeated periodically in . Disappearance of the charging energy looks like a result of unknown attraction between electrons and represents a real challenge for theory.
Explanation of the pairing of the differential capacitance peaks based on the lattice polaronic mechanism has been previously suggested in Ref.[3]. In Ref.[4] it was demonstrated how electron-electron repulsion screened by a close metallic gate can lead to electron pairing for a specially arranged compact clusters of localized states in a disordered dot. This effect is a result of redistribution of the other electrons after arrival of new ones. It was interpreted in Ref.[4] as electronic bipolaron.
In this paper we study the addition spectrum of a dot where density of electrons is small and disorder is weak enough for electrons to form the Wigner crystal. We call such a dot the Wigner crystal island. In the experimental conditions of Ref.[1] one can think about Wigner crystal island literally only in the highest magnetic field. One can also imagine similar experiments with a Wigner crystal island on the surface of liquid helium.
We show that when a metallic gate is very close to the plane of a two-dimensional (2D) island, two or more addition levels can be anomalously close and even merge similar to the observations of Ref.[1]. This phenomenon repeats periodically, and is associated with the formation of highly symmetric electronic configurations, consisting of an integer number of closed radial shells. The new electrons added to such a configuration reside on its surface. They exert some force onto the symmetric configuration making it move in the external confinement field. This displacement facilitates the entrance of the new electrons mediating an effective attraction between them. To emphasize that this effect is produced by the confinement potential and to stress its multi-electron nature we call it confinement multi-polaronic effect.
The paper is organized as follows. In Section II we present our model and the results of its numerical solution. In Sections III and IV we give the explanations of the numerical results for the screened and for the unscreened Coulomb interactions respectively. Section V is dedicated to our conclusions.
II Numerical Simulations
In this Section we consider the system of interacting electrons in the parabolic confinement. The energy of the system is given by the following expression:
| (2) |
Here plays the role of strength of the confinement, and is the interaction potential. The forms of the interaction potential considered are: the pure Coulomb interaction
| (3) |
with and being the electron charge and the dielectric constant correspondingly, and the exponential interaction
| (4) |
The latter interaction potential corresponds to the case when the island is situated between two metallic gates, with being the distance between them and .
This energy was minimized over the coordinates of electrons using the numerical technique similar to that outlined in Ref. [5]. It is the standard Metropolis simulated annealing algorithm. The temperature of the simulation was decreased exponentially (quenched) in simulation steps. The average displacement of electrons in a step was chosen automatically to assure the acceptance probability of a new configuration of . Each time the simulation for the new number of electrons was started from a random set of coordinates. We used a few restarts for a given number of electrons. Although the configurations obtained in different restarts sometimes were different, the maximum difference in energy is typically times smaller than the systematic variations of . Thus although we cannot guarantee that we have found the ground state of the electron system, we are confident that these variation of are reproduced reliably. Our results for energies agree with those of Ref. [5] and for some are even lower. Before presenting these results we would like to discuss the method of the data processing.
Consider first the problem in the case of no screening, that is described in our model by Eqs. (2) and (3). The instructiveness of this problem is in the fact that the corresponding electrostatic problem (ignoring the discreteness of the charge of electron) can be solved exactly [6]. The solution for the density of electrons can be shown to be hemisphere:
| (5) |
The total potential of the electrons is equal to . This solution allows us to calculate the scaling of all other contributions to the energy of the ground state with the number of particles (see Appendix A). In particular:
| (6) |
where are some constants. The first term in this asymptotic series is the electrostatic energy that can be found from the solution cited above. The next three term in the order of appearance are: the correlation energy, the overscreening energy associated with the screening of the external potential by the Wigner crystal, and the surface energy. The coefficients can be found from the best fit to the numerical data: , , , . This smooth contribution to energy can now be subtracted from the numerical data to obtain the fluctuating part:
| (7) |
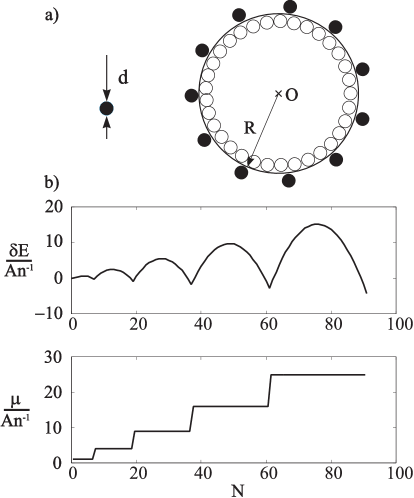
The fluctuating part is displayed in Fig. 1.

The curve in Fig. 1 evidently has a quasi-periodic structure. It consists of the series of interchanging deep and shallow minima, separated by the peeks with more or less smooth slopes. We call this structure the ”Kremlin wall” for its resemblance to the embattlements on top of the walls of the Moscow Kremlin. Its period with a very good precision scales as and numerically is equal to the number of electrons in the outer crystalline row of the island. The amplitude of the oscillations does not change with appreciably. The minima of are associated with the highly symmetric electron configurations that can be formed at some distinct numbers of electron that we call magic numbers. One of the examples of such configurations is displayed in Fig. 2.

One can use the numerically obtained ground state energies to calculate the differential charging energy by Eq. (1). The results are shown in Fig. 3. Note that although the average charging energy decreases the relative fluctuations remain for number of electrons in the well .

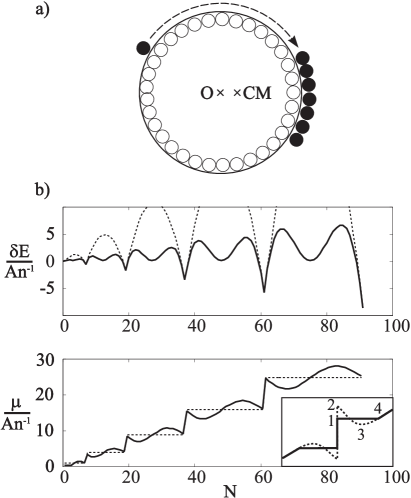
It was surprising for us to find that quasi-periodic oscillations similar to Fig. 1 exist for all the types of interactions that we have tried. The results for a particular example of the exponential interactions described by Eq. 4 are presented in Figure 4. From the total energy the smooth component of the form is subtracted, where the coefficient are chosen to minimize the fluctuations.
It is clear that the fluctuations retain their quasi-periodic form similar to the pure Coulomb case. However, contrary to the Coulomb case they grow with as , where . The relative fluctuations of the energy also become bigger because the smooth component of the ground state energy is significantly reduced due to screening. As a result at some numbers of electrons in the island the fluctuations of the charging energy exceed the average. The result is demonstrated in Figure 5 showing the total chemical potential of the system with exponential interaction. As one can see, at some numbers of electrons in the island the total chemical potential is a decreasing function of .

Negative means that two or more electrons “attract” each other and, with increasing or , enter the island simultaneously. In other words this means that a few Coulomb blockade peaks merge together forming a bunch in the charging spectrum. The detailed analysis of this instability is given in the next Section.

III A Simple Model for the Short-Range Interactions
In the previous Section we saw that bunching is associated with screening of the interactions in the island. Once these interactions become short-range the fluctuations of the charging energy exceed the average value. To understand the nature of these fluctuations it is instructive therefore to consider the simplest form of the short-range interactions: the hard wall interactions.
Assume that electrons are hard disks of diameter put into the parabolic confinement. The energy of the system now is given by
| (8) |
where are the coordinates of the centers of the discs. This expression formally coincides with the moment of inertia of the system of particles of mass relative to the center of the parabolic confinement. Hence, to minimize the energy one has to minimize the corresponding moment of inertia. As it is well known the moment of inertia of a system is minimum relative to the center of mass of the system. We conclude that the center of parabola is situated in the center of mass of the minimum energy configuration.
Assume that at some number of particles in the well they form a highly symmetric configuration consisting of an integer number of closed radial shells. These configurations are observed when the number of particles corresponds to the deep minima of the fluctuating part of the energy of the system (see Fig. 1). The electrons in these magic number configurations form a figure very close to the perfect hexagon. If the number of electrons is not too big the hexagon is almost indistinguishable from disk. In fact the amplitude of the deviations of disk from hexagon are less than the radius of particles if the number of particles in the well does not exceed . Below for the sake of instructiveness we replace hexagon with disk.
When adding a new electron to the symmetric configuration it has to be placed somewhere on the boundary of the island. The moment of inertia of the system relative to the center of the disk is then
| (9) |
where and are the mass and the radius of the disk, and is the number of newly added electrons (see Fig. 6). In the first approximation one can think that electrons are spread uniformly over the circumference of the disk (Fig. 6a). Then the center of mass of the system coincides with point and its energy is given by Eq. (9). It is necessary to notice now that this expression is linear in the number of new electrons. At the same time the average moment of inertia of the system grows . Indeed it is equal to , with being the average radius of the island determined from the expression , where is the density of centers of particles. Hence the expression (9) is just a linear approximation to the average energy with the difference between them being the fluctuations. The fluctuating part of the energy and the total chemical potential of the system obtained in this approximation are shown in Fig. 6b.
The total chemical potential as a function of the number of electrons comprises the series of steps. This dependence resembles one for the system of non-interacting electrons in the conditions of the integer quantum Hall effect. The fluctuating part of energy is just a sequence of parabolas. The minima of the curve correspond to the deep minima of the Kremlin wall structure shown in Fig. 1.
The appearance of the sequence of shallow minima in Fig. 1 is associated with displacements of the electrons on the surface of the disk. One can notice that these electrons are actually attracted to each other. Hence instead of being uniformly spread over the surface they form a compact cluster (see Fig. 7a). This interaction is similar to the attraction between two people in a boat. One person tilts the deck of the boat and another has a tendency to slide down the slope. For our model this can be most easily understood using the analogy with the moment of inertia. Indeed due to the known theorem the moment of inertia relative to point is related to one with respect to the center of mass by
| (10) |
Here is the distance from the center of mass to the point . It is clear that by forming a compact group the particles on the surface do not change , while at the same time they displace the center of mass. But by doing this they decrease the total energy, as it follows from the previous equation. The results are displayed in Fig. 7.
The fluctuating part of energy now looks similar to that in Fig. 1. A simple calculation shows that this Kremlin wall structure is described by the following dependence:
| (11) |
where , is the number of electrons in the outer shell. By we denote the integer part of a number. The first term in this equation describes the pure shell effect (without attraction), while the second is the result of displacement of the center of mass (Eq. (10)).
Another interesting feature of the hard-disk model is that the total chemical potential for some fillings of the island is decreasing as a function of number of electrons. In this case, if the chemical potential in the island is fixed by an external gate, the system becomes unstable and a few electrons enter the island simultaneously. This is a result of the aforementioned attraction between electrons on the surface of the disk. This attraction can be thought of as a multi-polaronic effect based on the spring connecting the magic number configuration with the center of the parabolic confinement. Therefore we call this effect the confinement multi-polaronic effect.
Let us examine this instability in more detail. Assume that the island is in the proximity of a metallic gate, in which the chemical potential is equal to . When electrons tunnel from the gate to the island the energy of the system is changed by the following amount:
| (12) |
The first and the second terms in this expression describe the change of the total energy of the island and the work done by the external source respectively. Introducing , we obtain the condition at which this tunneling is energetically possible:
| (13) |
This condition is satisfied e.g. when the external chemical potential reaches the value corresponding to point in the inset of Figure 7b. At this point the integral of the difference between the dashed line, representing , and the bold line, corresponding to is equal to zero. This condition is similar to the Maxwell’s rule well-known in the the theory of real gases[7]. Hence, instead of entering one by one (following the curve 1-2-3-4) a few electrons tunnel to the island simultaneously, in bunch. This bunching is brought about by attraction between the electrons that start forming a new shell. As the hard disk model is particle-hole symmetric the bunching is also reproduced when electrons are about to finish the shell, as it is shown in the lower part of the inset.
Comparison of Fig. 7b with Fig. 4 and 5 shows that our model somewhat overestimates the oscillations of and . For example our model predicts that , while in the numerical experiments , with . This overestimation is associated with the main assumption of this model about the existence of the perfect disk-like shells, that brings about a strong degeneracy of the addition one-electron energies. In other words the one-electron density of states in our model comprises the series of sharp -function like peaks. This is a good approximation for small , when these shells indeed exist, however in the form of perfect hexagons. At large () the configurations with perfect shells are never formed and the surface of the island is always rough. The peaks in the density of states existing at small become smeared at large . Nevertheless the density of states retains periodic variations. Hence while the variations of the ground state energy persist their amplitude is reduced, with the exponent going down from to . The detailed study of these variations is a subject of future work.
IV The Coulomb Interaction
The universality of the observed fluctuations of energy is not accidental. The case of the long-range interactions can be reduced to the simple model described in the previous Section. To do so one has to notice that if the number of electrons in the dot is not too big the electrons are situated in an effective potential that is very close to parabolic. This effective potential is significantly reduced with respect to the bare one due the to screening by the Wigner crystal:
| (14) |
where is the renormalized external potential, is the static dielectric function rendered by the Wigner crystal. In the Thomas-Fermi approximation this dielectric function is given by
| (15) |
Here is the Fourier transform of the bare interaction potential, is the correlation energy of the Wigner lattice per particle [9], with being a numerical constant. Putting formulas (14) and (15) together we obtain the following estimate for the renormalized confinement:
| (16) |
where is the lattice spacing in the middle of the island, and is its radius (see also Appendix A). Substituting into Eq. (11) and replacing by the characteristic lattice spacing in the island it is possible to obtain the uniform upper bound for the fluctuations of the total energy in the Coulomb case:
| (17) |
The numerical results for presented in Fig. 1 agree with the prediction of Eq. (17) in the sense that has a very weak dependence on . However the amplitude of the oscillations observed in the numerical experiments is by a factor of smaller than predicted by this upper bound (see Fig. 1). This discrepancy is due to the presence of the elastic deformations in the Coulomb Wigner crystal. In contrast to the case of the short-range interactions due to the smallness of the Young’s modulus of the Coulomb crystal the newly added electrons on the surface of the island (shown by the dark circles in Fig. 7) sink into the island, further decreasing the shell effect. This effect warrants a more detailed study.
V Conclusions
We have studied the system of classical interacting particles in the parabolic confinement. We have observed the periodic variations of the ground state energy that are universal, i.e. independent of the exact form of interactions. These variations are shown to be of purely geometric origin and are associated with the combination of the shell effect and the polaronic effect based on the confining parabola. If the electron-electron interactions in the island are short-range these variations bring about periodic bunching in the charging spectrum.
VI Acknowledgements
We are grateful to R. Berkovits, M. Fogler, and N. Zhitenev for useful discussions. This work is supported by NSF grant DMR-9616880.
A Smooth Part of the Energy of the Wigner Crystal Island with Coulomb Interactions.
In this Appendix we obtain the scaling of different contributions to the total energy of a circular dot filled with the Wigner crystal. In essence we derive Eq. (6). An analogous problem was considered in literature for the system of point charges of the surface of sphere[8].
We start by naming the length scales involved. They are , the radius of the island given by Eq. (5), and the lattice spacing in the center of the island (see also Eq. (5)).
The expansion of the total energy into the series of powers of can be written in the following form:
| (A1) |
The various terms in this expression are respectively: the electrostatic, the correlation, the overscreening, and the surface energies. The electrostatic energy can be calculated from the solution of the electrostatic problem (5):
| (A2) |
where is the total potential inside the island. As a result we obtain
| (A3) |
The correlation energy describes lowering of the energy due to the transition from liquid, assumed in the electrostatic model, to crystal. In case of a big island the energy reduction can be calculated in the local density approximation from the known correlation energy of the uniform Wigner crystal [9]:
| (A4) |
where the coefficient was calculated in Ref.[9]. For the triangular lattice it is equal to , for the square lattice . The actually observed value of this coefficient lies between these two values.
The next term in the energy expansion takes into account the deviation of the density profile of the crystalline island from the semicircle (5) obtained in the electrostatic model. Due to the screening the variations of the average density of crystal are slightly bigger than obtained in electrostatics. Note that in case of electron liquid these variations are weaker than the electrostatic ones. To emphasize this difference between liquid and crystal we call the corresponding correction to energy the overscreening energy. To estimate the correction we notice that the average density of the crystal deviates from the electrostatic density by , where is the screening radius of the Wigner crystal equal to the negative lattice spacing: (Ref. [10]). As a result the distances between electrons change by the same factor and the correlation energy acquires the following correction:
| (A5) |
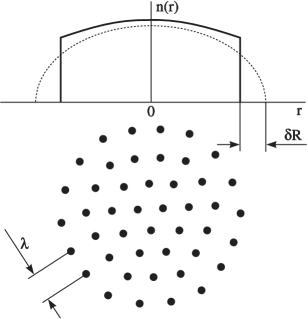
The last contribution to the total energy is the surface energy. It describes the deviations of the correlation energy of electrons on the surface from that in the bulk. To find this deviation it is essential to know what is the lattice spacing at the edge of the island (see Fig. 8). Below we address this problem in some detail.
The electrostatic formula (5) is correct on the scales significantly exceeding the screening radius. As it was pointed out before the screening radius of the Wigner crystal is of the order of its lattice constant [10]. Hence the electrostatic formula breaks down at the distances from the edge of the order of the lattice spacing on the surface (see Fig. 8):
| (A6) |
Matching the electrostatic density of electrons at this distance with the density of the Wigner crystal at the edge we obtain:
| (A7) |
and
| (A8) |
Our numerical data agree very well with this theory and give the following coefficients:
| (A9) |
Notice that the inter-electron density at the edge differs very slightly from the lattice constant in the center of the sample if radius of the island is not too big. Hence the concentration of electrons in this case also does not change too much. This is displayed by a box like density profile in Fig. 8.
The surface energy can now easily be estimated. It is of the order of the correlation energy per particle on the surface times the total number of particles there :
| (A10) |
REFERENCES
- [1] N. B. Zhitenev, R. C. Ashoori, L. N. Pfeiffer, and K. W. West, preprint cond-mat/9703241.
- [2] R. C. Ashoori, H. L. Stormer, J. C. Weiner, L. N. Pfeiffer, K. W. Baldwin, S. J. Pearton, and K. W. West, Phys. Rev. Lett.68, 3088 (1992); R. C. Ashoori, H. L. Stormer, J. C. Weiner, L. N. Pfeiffer, K. W. Baldwin, and K. W. West, Phys. Rev. Lett.71, 613 (1993).
- [3] Y. Wan, G. Ortiz, and P. Phyllips, Phys. Rev. Lett.75, 2879 (1995).
- [4] M. E. Raikh, L. I. Glazman, L. E. Zhukov, Phys. Rev. Lett., 77, 1354 (1996).
- [5] V. M. Bedanov and F. M. Petters, Phys. Rev. B49, 2667 (1994).
- [6] Ian N. Sneddon, Mixed Boundary Value Problems in Potential Theory (John Wiley & Sons, Inc., New York, 1966).
- [7] L. D. Landau and E. M. Lifshitz, Statistical Physics, part 1 (Reed Educational and Publishing Ltd, Oxford, 1980), p. 261.
- [8] J. R. Morris, D. M. Deaven, K. M. Ho, Phys. Rev. B53, R1740 (1996).
- [9] L. Bonsall, A. A. Maradudin, Phys. Rev. B15, 1959 (1977).
- [10] A. L. Efros, Solid State Communications 65, 1281 (1988).