On the nature of the depinning transition in type-II superconductors
N. Lütke-Entrup
B. Plaçais
P. Mathieu and Y. Simon
Laboratoire de Physique de la Matière
Condensée de l’Ecole Normale Supérieure
CNRS URA 1437, 24 rue Lhomond, F-75231
Paris Cedex5
Abstract
The surface impedance of conventional isotropic materials has
been carefully measured for frequencies ranging from 1 kHz to
3 MHz, allowing a detailed investigation of the depinning transition.
Our results exhibit the irrelevance of classical ideas on the dynamics
of vortex pinning.
We propose a new picture, where the linear ac response is entirely
governed by disordered boundary conditions of a rough surface,
whereas in the bulk vortices respond freely.
The universal law for thus predicted is in remarkable agreement with
experiment, and tentatively applies to microwave data in YBaCuO films.
pacs:
PACS numbers: 74.60.Ge, 74.25.Nf.
]
A perfect sample of a type-II superconductor in the vortex (or
mixed) state would be transparent to an electromagnetic wave
at very low frequencies.
But defects are always present and strongly alter the quasistatic
and low-frequency response;
low frequencies here means ,
a so-called “depinning frequency” [1] depending on the
material and vortex density.
It is important for applications to know
what kind of defects can pin vortices, how they hinder small vortex
oscillations and thereby restrain the penetration of an ac ripple. In
this respect, a study at low levels of excitation of both the resistive and
inductive part of the surface impedance as a function
of the frequency provides much information about the dynamics of pinning.
It is generally accepted that bulk pinning centers limit the quasistatic skin
effect to a pinning (or Campbell’s) length m,
while dissipation is vanishingly small, as observed [1, 2].
No model however has been able to account for variations of at higher frequencies.
In particular, as the first increasing of is stronger than expected,
the understanding of dissipation remains a puzzling problem,
including in high materials [3].
Experiments are performed on a series of slabs of cold-rolled
polycrystalline PbIn and pure single-crystralline Nb. The slabs
() are immersed in a normal magnetic field ; unless
specified their thickness is much larger than the flux-flow
penetration depth (see below). At equilibrium, up to the
upper critical field , a regular lattice of vortex lines
parallel to is formed, with the density , where
is the flux quantum. Both faces of the slab, ,
are then subjected to an ac magnetic field
parallel to the length (-direction) of the sample. Under such
conditions, induced currents and electric fields, and , are along the -direction, while vortices oscillate
in the -planes. For low exciting fields (T),
vortex displacements Å are very small compared
with the vortex spacing (Å,
for T) (Fig. 1a). The electric field at
the surface , , is measured by means of a
pick-up wound coil. The main experimental difficulty in such
measurements is to ensure a precise calibration of the phase
of (within better than at 100 kHz). Thus we get the
surface impedance of the slab, defined as the ratio .
Putting
(1)
the ac response will be conveniently expressed in terms of the complex penetration
length [4].
As easily seen, (a factor 2
for two faces) represents the amplitude of the ac magnetic flux penetrating
the slab per unit length along .
The length measures the dissipation, as
is the sine of the loss angle .
The analysis of the ideal response, though it is not observed
(unless ), is an important step in our argument.
A perfect slab would behave like a linear continuous medium,
of resistivity and permeability ().
Here is the flux-flow resistivity,
and is the effective “diamagnetic permeability” of the mixed
state [5, 6];
increases steadily with the vortex density and rapidly approaches unity
(typically for ).
In the absence of pinning, an electromagnetic wave,
, ,
can propagate in the bulk, according to the simple equation of dispersion
[4].
The wave field would be accordingly:
,
where if one makes allowance for a surface screening by
diamagnetic currents.
This leads to ,
where .
Assuming ,
this (undisputed) result involves all features of a normal skin effect.
In the so-defined thick limit (thick slabs and/or high frequencies),
say , ,
so that .
In the thin limit, say ,
,
which means perfect transparency.
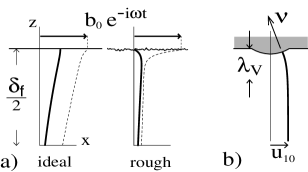
FIG. 1.: a) Vortex lines (full lines), and field
profiles (dashed lines) near one face of a thick slab are
sketched with arbitrary units; for clarity, the actual length scaling,
, is not preserved. For an ideal surface,
vortices end normal to the plane boundary, the
weight of the -mode [11] is lowered, and a large
normal-like skin effect is observed. For a real rough surface,
a vortex-slippage effect at the surface induces a relatively strong
bending of vortices over the depth , so that
non-dissipative currents associated with this vortex curvature
[9, 10] are greatly screening the
exciting field. b) An isolated superfluid vortex in a rotating
box of helium II terminates at a wall asperity.
If it is acted on in the bulk, the vortex
line bends near the wall so as to keep on ending normal to the
surface, making thus an angle with the mean smooth surface.
As shown in Fig. 2, the actual response is quite different:
after a low-frequency plateau,
(),
the loss-angle increases with frequency,
so that the ideal skin effect ()
is recovered beyond some depinning frequency ;
this can be precisely defined as the mid-frequency for which
.
Note, in passing, that the observation of a linear response is not
consistent with predictions of a naive critical state model:
A critical-current density as small as A/cm2
should restrict the penetration of fields T to depths
m, which is much smaller than observed,
and seeing that , no linear regime could exist at all.
The linear skin effect over depths m was first
reported by P. Alais and Y. Simon [7],
and then misinterpreted by considering the possibility of thermally
activated vortex motion.
Soon after, Campbell suggested that the linear signal was due to small reversible
oscillations of vortices in their pinning potential wells [2]:
if a pinning restoring force (per unit volume) is introduced
in the equation of vortex motion, the propagation of the -mode is greatly altered.
At low frequencies, it becomes a non-dissipative evanescent mode decaying
exponentially in the sample over a small depth –m.
Here () [1].
Assuming and ,
the Campbell expression for reads
(2)
With , Eq. (2) accounts for the
low-frequency plateau and the related order of magnitude of
. Otherwise, no satisfactory fits of both
and can be obtained from
Eq. (2), as shown in Figs. 2 and 3. In
spite of recent attempts to improve the treatment of bulk pinning, the
same difficulties are encountered in fitting in YBaCuO
[3]. Note in this respect that the inclusion of thermal
flux-creep effects [4] may enhance the dissipation in an
intermediate range of frequencies, as required (Fig. 4); it
should be emphasized, however, that flux-creep models
[4, 7] predicts an unobserved divergence:
, as
[8].
The model of the critical state based on the Mathieu-Simon (MS)
continuum theory of the mixed state [9, 10], has
prompted us to an alternative interpretation. We briefly recall the
points of importance in the MS theory: i) each vortex line
(unit vector ) must terminate normal to the surface
(); whence the leading part of the
boundary conditions (rough or smooth surface) in any problem of
equilibrium or motion of vortices. ii) Vortex lines are not
always field lines, so that the vortex field
and the mesoscopic field
must be regarded as two locally independent variables. The
conjugate variable of ,
, appears as a
local line tension (J/m) in the MS
equation for vortex equilibrium or non-dissipative motion . iii) The classical
picture of a local diamagnetism is misleading [6]. A
diamagnetic current, just like a subcritical transport current, is a
true non-dissipative supercurrent
() flowing near the surface
over a small vortex-state penetration depth
(, the zero-field London depth). Any deviation
also heals beyond the depth , so
that in the bulk sample. Although the
mean magnetic-moment density of a perfect body turns out to be
, the quantity has not the
primary physical meaning of a local magnetization, nor ,
conveniently defined as the ratio ,
that of a true local permeability [6].
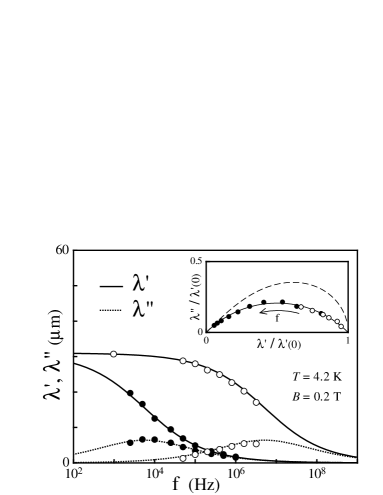
FIG. 2.: The frequency dependence of the effective penetration depth
in the thick limit
(). Experimental data:
() Pb.82In.18 (mm,
.cm, MHz).
() pure niobium (mm,
.cm, kHz). Full lines
are theoretical fits using Eq.(5), where is the
only adjustable parameter; the flux-flow resistivity (then
or ) is measured from the dc voltage-current
characteristics. According to Eq.(5) the universal Argand
diagram of is the quarter circle shown in
the inset: . For
comparison the dashed line is the diagram predicted by the Campbell
equation (2).
Let us return to the ac response of the slab in the standard geometry
of Fig. 1, and suppose that bulk motions are unrestrained (no bulk pinning).
As pointed out by Sonin et al. [5],
the distinction between and implies additional degrees of freedom,
and a second -mode appears besides the classical -mode ();
this is a London-like non-dispersive evanescent mode,
which dies off over the depth () [11].
Note that, in practice, , and .
In a pure -mode vortex and field lines bend in opposite directions,
whereas they coincide in a pure -mode. More explicitely
[6, 11],
(3)
where (,
) and measure the slopes of vortex and
field lines respectively.
Then the response will be that combination of the modes, , which
satisfies the field continuity, , as well as the
correct boundary condition for vortex lines.
The latter condition will determine the relative weights and
of the modes (), and,
therefore, the effective penetration depth
(since and ).
For an ideal surface, the vortex boundary condition is clearly (point
i) above); then using Eq. (3), we just recover the simple classical-diamagnetism result, that is
. Now, the point is that the surface roughness may
considerably change this boundary condition, so as to enhance the weight of the
second mode (Fig. 1a).
Thus we argue that small effective skin depths at low frequencies
should not result from restricting the penetration of the -mode,
but from its amplitude being reduced due to the screening effect of the
second mode.
According to the MS model
[9, 10, 12, 13], if the surface has
irregularities on the scale of , vortex lines can bend over a depth
, making thus an angle with the mean smoothed
surface . On the average, and in any direction ,
should not exceed a critical value – :
– [9, 10]. As stated above,
superficial non-dissipative supercurrents () can result from such distortions of
the vortex array; integrating , the
net current density in the -direction is , where . A dc subcritical current can be regarded as a
frozen pure -mode in the limit . To the
maximum, is the surface critical-current
density. Starting from an equilibrium, where ,
a shift of the bulk vortex array is expected to induce a vortex
curvature in the opposite direction, with
. Perhaps such a vortex slippage
( if ) is more intuitive when dealing with superfluid
vortices in a rotating box (see Fig. 1b). In helium, bulk
pinning does not exist, and only asperities of the walls can pin
vortices [14]. We are just extending this idea to
collective motions of a vortex array along a rough surface of
superconductors.
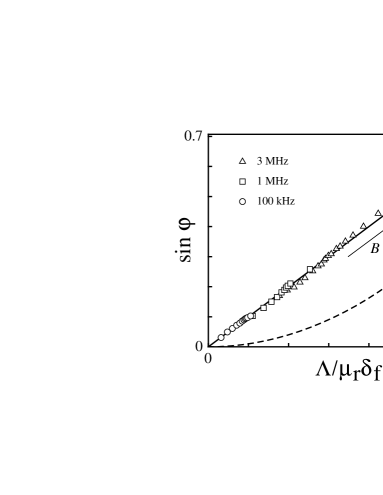
FIG. 3.: The complex penetration depth of the PbIn slab referred to in Fig. 2 has
been measured as a function of the magnetic field , for three
values of the driving frequency. Experimental data are plotted as the
sine of the loss angle as function of the ratio
, so as to verify the relation
(straight line)
resulting from Eq.(5). The limit
corresponds to the normal state or to the depinned vortex array. The
Campbell equation (2) leads to much smaller loss angles:
(dashed line).
Linearizing for small displacements we can write
, where is a real length characterizing the
surface roughness: would correspond to an ideal surface; in
practice we expect that m.
As far as , this condition applies
quasistatically in the ac response by taking ,
so that the vortex-slippage condition reads
(4)
Now, substituting Eq. (4) for in the above calculation of
and , and considering the thick limit, we obtain:
(5)
where is the real limit of as
(). Note that setting from the beginning
would lead wrongly to , that is the ideal
response. While giving the same low and high-frequency limits as
Eq. (2), (real) and
(depinning),
Eq. (5) remarkably fits experimental data in the intermediate
range (Figs. 2 and 3).
According to Eq. (5), the graph in the
Argand diagram must be a quarter circle (Fig. 2). This
universal behaviour should be easily tested in any case, irrespective
of any adjustable or available parameters, only providing that the
thick limit is achieved.
From data taken below the thick limit (not shown in the figures), we
retain an important result. When is decreased under conditions
where
, we observe that the ac response becomes
thickness-dependent as soon as , as predicted:
just substitute for in
Eq. (5). In particular, the loss angle is significantly
smaller than stated by Eq. (5). According to the one-mode
Campbell model, size effects should arise for much thinner slabs such
as . Note in this respect that our “pinning
length” , contrary to , does not represent an
actual penetration depth. The mere observation that size effects
arise for , not , attests that the
bulk -mode propagates freely, and reveals the need for a
two-mode electrodynamics.
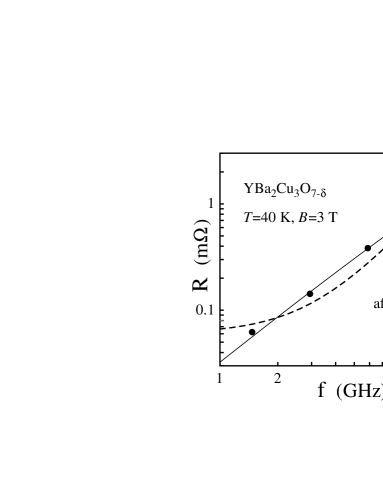
FIG. 4.: The microwave surface resistance of an YBaCuO film
(sample No. 2 of Ref. [3]) vs frequency plotted in
a log-log scale. () are experimental data taken from Fig. 6 of
Ref. [3]. The full line is a fit using our
Eq. (5), and taking and (or ) as
two adjustable
parameters (we find m, cm,
GHz).
This fit is very close to the empirical power-law
proposed by the authors.
The dashed line shows the best fit obtained in
Ref. [3] from the Coffey-Clem flux creep-model
[4]
In conclusion, the MS model of the critical state completed by the
vortex-slippage condition (4) accounts quantitatively for
the surface impedance of a variety of conventional samples, which all
have standard critical-current densities ( A/cm): polycristalline lead-indium slabs and single-crystal
slabs of pure niobium (Figs. 2 and 3). For the
application to the case of YBaCuO at 10 GHz, our derivation of
Eq. (5) has to be reexamined, especially because of the
anisotropy and high-frequency correcting terms in the dispersion
equation for the two-modes [11]. Nevertheless, it is
worth noting that Eq. (5) may account for the observed
-dependence of in YBaCuO from 1 to 20 GHz (Fig. 4)
[3]. These results support the argument, developed in
previous works, [9, 10, 12, 13] that bulk
pinning is absolutely ineffective in a large class of “soft”
materials (devoid of strong bulk inhomogeneities). Contrary to the
common idea that any crystal defect may be a pinning center, we are
led to the conclusion that a normally homogeneous sample in the mixed
state rather imitates the behaviour of a superfluid vortex array
enclosed in a rough box.
REFERENCES
[1]J.I. Gittleman and B. Rosenblum,
Phys. Rev. Lett. 16, 734 (1966).
[2] A.M. Campbell, J. Phys. C 2, 1492 (1969).
[3] N. Belk, D.E. Oates, D.A. Feld, G.
Dresselhaus and M.S. Dresselhaus, Phys. Rev. B 53, 3459 (1996).
[4] M.W. Coffey and J.R. Clem, Phys. Rev. B 45,
9872 (1992); ibid, 10527.
[5] E.B. Sonin, A.K. Tagantsev and K.B. Traito,
Phys. Rev. B 46, 5830 (1992).
[6] H. Vasseur, P. Mathieu, B. Plaçais and Y. Simon,
Physica C 279, 103 (1997)
[7] P. Alais and Y. Simon,
Phys. Rev. 158, 426 (1967).
[8] C.J. van der Beek, V.B. Geshkenbein and V.M. Vinokur,
Phys. Rev. B 48, 3393 (1993).
[9] P. Mathieu, and Y. Simon,
Europhys. Lett. 5, 67 (1988).
[10] T. Hocquet, P. Mathieu and Y. Simon,
Phys. Rev. B 46, 1061 (1992).
[11] B. Plaçais, P. Mathieu, Y. Simon, E.B. Sonin
and K.B. Traito, Phys. Rev. B 54, 13083 (1996).
[12] Y. Simon, B. Plaçais and P. Mathieu,
Phys. Rev. B 50, 3503 (1994).
[13] B. Plaçais, P. Mathieu and Y. Simon,
Phys. Rev. B 49, 15813 (1994).
[14] K.W. Schwarz, Phys. Rev. Lett. 47, 251
(1981).