[
Elastohydrodynamic study of actin filaments
using
fluorescence microscopy
Abstract
We probed the bending of actin subject to external forcing and viscous drag. Single actin filaments were moved perpendicular to their long axis in an oscillatory way by means of an optically tweezed latex bead attached to one end of the filaments. Shapes of these polymers were observed by epifluorescence microscopy. They were found to be in agreement with predictions of semiflexible polymer theory and slender-body hydrodynamics. A persistence length of m could be extracted.
pacs:
PACS numbers: 87.10.+e, 83.10.Nn, 42.62.-b]
In the last few years, there has been a considerable interest in mechanical properties of actin filaments (F- actin) and microtubules [3, 4, 5, 6, 7, 8, 9, 10, 11, 12, 13, 14, 15]. As part of the cytoskeleton, these biological polymers play a major role in defining shape and viscoelastic characteristics of living cells. The corresponding proteins can be purified and repolymerized in vitro to reach lengths of tens of microns. The key parameter for the mechanical description of polymers is their transverse bending modulus, often expressed in terms of persistence length. For synthetic polymers this parameter is generally measured by scattering techniques [16]. In the case of F-actin, quasi-elastic light scattering at dilute to semi-dilute concentrations led to a measurement of a persistence length around 0.5 [3, 4], 4.5 [6], or 7.5 [7]. End-to-end measurements by electron microscopy gave persistence lengths of 4 [6]. Rhodamine phalloidin keeps F-actin from depolymerizing, and because of the high stiffness of biological polymers, it was possible to measure their persistence length differently, directly on individual filaments observed with an optical microscope [8, 9]. The analysis of Brownian fluctuations of actin filaments led to various results. End-to-end measurements gave persistence lengths of 15 [9]; analysis of correlations along the filament in real space [10, 11] and a mode analysis [12] led to about 17 . A qualitatively different result however was presented by Käs et al. [13] who, also using a mode analysis, found a wave vector dependent persistence length in the range of 5 to 0.5 .
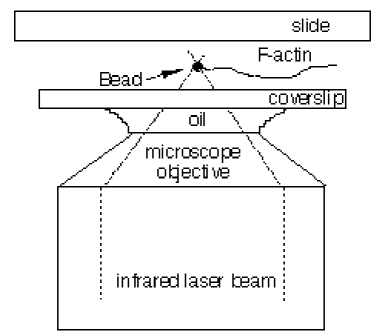
Actin filaments can be manipulated under an optical microscope by optical tweezers via attached beads [17, 18, 19, 20]. We present such an experiment which probes the dynamics of individual actin filaments in order to study their bending properties under external forcing. Similar experiments have recently been performed for microtubules [14, 15]. A single bead-ended filament was optically trapped (Fig. 1). It was moved perpendicular to its long axis in an oscillatory way at given frequencies such that a transverse motion was imposed. In the case of the motion taking place in the focal plane, its shape could be observed and then compared to the predictions of semiflexible polymer theory and slender-body hydrodynamics. A complete treatment of this particular problem is given in Ref. [21]. In the following we recall a few results from this reference.
A characteristic length can be extracted from the fact that bending forces balance friction forces. Bending forces are characterized by , the elastic constant of F-actin, and friction forces by , the viscous drag coefficient. The natural length scale obtained from , , and the frequency of oscillation is
or
| (1) |
( is the Boltzmann constant, the temperature, and the persistence length). This length corresponds to a longitudinal decay length of the oscillation. We can estimate a typical value of as follows. The expression for , assuming we may locally approximate actin as a cylinder [22] (an additional 1/2 in the denominator is neglected) is
| (2) |
where , the actin diameter, is equal to 8 nm, is the total filament length, typically 10 , and the viscosity of water is Pl. By taking at , and supposing a persistence length of 10 we obtain
| (3) |
The expression for the time dependent shape solves a rescaled equation of motion [21] derived by balancing elastic and viscous forces and is a function of only one free parameter, .
![[Uncaptioned image]](/html/cond-mat/9704225/assets/x2.png)
Actin was purified from chicken breast following a published procedure. F-actin was fluorescently labeled [8] with rhodamine-phalloidin (R-415, Molecular Probes, Inc.). Anti-actin antibodies (A 2668, Sigma) were covalently coupled through carbodiimide to fluorescent polystyrene 1 diameter beads (CX, Duke Scientific Corporation), following a recommended protocol (Polyscience). Experiments were performed in actin suspension buffer containing 25 mM imidazole, 25 mM KCl, and 5 mM -mercaptoethanol at pH 7.65 at room temperature. To avoid photobleaching during observation, 1 mg/ml glucose, 33 units/ml glucose oxidase, and 50 units/ml catalase were added to the suspension buffer. In order to prevent actin filaments from sticking to the glass surfaces, slides were coated with bovine serum albumin (BSA). Observation chambers were filled by capillarity and sealed with nail polish, the resulting cell being around 20 thick. Beads and F-actin were added separately to the observation chamber; the ratio beads:F- actin was adjusted to have one or two beads per filament. Among these filaments, we chose bead-ended actin filaments for the experiment. About 30 individual filaments were studied.
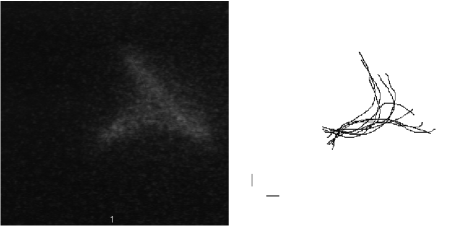
Observations were made on an inverted microscope (Axiovert 135, Zeiss) equipped with a 100 W mercury lamp, and a standard filter set (XF37, Omega Optical). To prolong observation time, the excitation light intensity was reduced by inserting neutral density filters. Fluorescent images were taken through a 4X TV tube, via an image intensifier (C2400, Hamamatsu) followed by a CCD camera (XC- 77, Sony). Images were recorded with an S-VHS recorder. The optical tweezer was made by focusing a 0.5 W Nd:YAG (Model 7000, Spectra-Physics) laser beam through a beam expander and a 63X, 1.4 numerical aperture Plan-Apochromat microscope objective (Zeiss). A mirror mounted on a galvanometer (6350, Cambridge Technology) connected to a function generator served to trap and move beads in the focal plane (Fig. 1). The trap was driven by sine waves, with frequencies and amplitudes ranging from 0.1 Hz to 6 Hz and from 5 to 10 , respectively. Below 0.1 Hz the motion of actin appeared forceless, and above 6 Hz acquisition was limited by the video rate. Up to 10 images per oscillation period were digitized with a Power Macintosh equipped with a Scion frame grabber card; they were subsequently analyzed using NIH-Image software. Figure 2a shows a typical image. Images corresponded to an overall screen size of 44 in horizontal dimension leading to a value of 0.06 /pixel after digitization. To determine the coordinates of the filament, the shape of each image was drawn with the mouse starting from the center of the bead. During the experiment out-of-focus movements of the filament could bias the shapes; a flow could not always be avoided. In order to detect these artifacts, successive shapes were superposed (Fig. 2b). Only those sequences that met the two following criteria were retained for further analysis: i) filaments remained in the focal plane for at least an oscillation period; and ii) the axis of symmetry was clearly visible upon superposition of subsequent images.
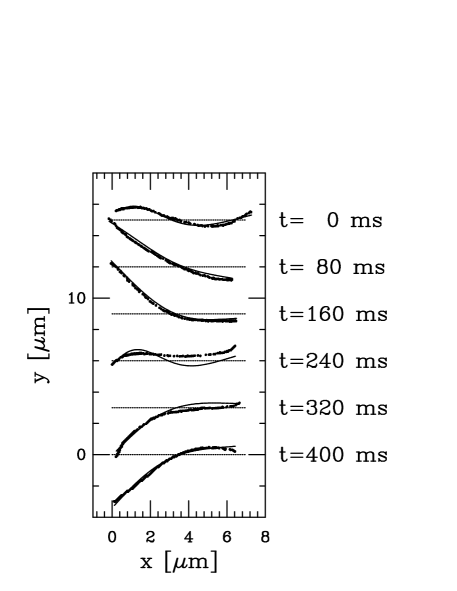
The expression for the shape solves the equation of motion and is a function of and [21]. Since the amplitude and phase of the motion could be read directly from the position of the driving bead, was the only free parameter. We minimized for each of the 221 selected images. Figure 3 shows a typical fit for a half period of oscillation.
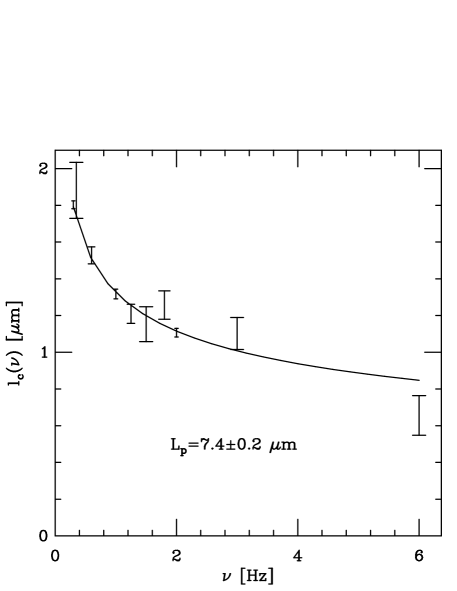
The value of was extracted from each image. Then, fitting the relation to the expression , we found the values of and . We found , indicating good agreement with the prediction (see Eq. 1). As defined above, is a function of known quantities () and one unknown, . Enforcing , we are left with a -parameter fit, from which we determined (see Fig. 4). Histograms of the different for a given show that the data are not always distributed symmetrically about the mean; a few short values increase the distribution at one end. By fitting with and without these outliers, however, we showed they do not significantly affect the results.
As shown in figure 4, our experimental data are in agreement with the given scaling law (Eq. 1). Even in the case where modes are imposed by external forcing, dynamics of an individual actin filament follow the theory of semiflexible polymers. Previous authors found the persistence length of rhodamine F-actin to be as opposed to for rhodamine phalloidin actin [11]. Compared to other measurements on rhodamine phalloidin labeled F-actin [9, 10, 11, 12, 13] our value is higher than those presented in Ref. [13], and appears lower than those presented in Ref. [9, 10, 11, 12]. A lower persistence length would suggest that actin may be weakened by the external forcing. Further experiments using different techniques would be needed to confirm this hypothesis.
To avoid longitudinal tension in our experiment, smaller amplitude oscillations should be applied; the linearized analysis is more precise and appropriate in this case. However optical resolution, the size of the trapped bead, and camera sensitivity impose close limits. In our experiment, errors are due to several causes, only some of which could in principle be eliminated. The parameter extracted from our observations is of the order of a micron. The values measured therefore not only approach the limit of optical resolution, but also the size of the driving bead. The hydrodynamics is simplified and leaves out the flow due to the bead, which is a limitation of the analysis. Brownian motion of the filament, giving some more disordered motion than that predicted by theory, increases the error at low frequencies. Furthermore the persistence length depends on the 4th root of the key parameter . In future experiments, attention should be paid to an external measurement of the phase of the sine-motion which simplifies the data analysis. For these reasons our systematic error of the persistence length is higher than those of previous publications, but keeping in mind the scattering of the results presented by different authors using the same or different techniques, this does not appear as a significant drawback.
We have shown that dynamic behaviour of an individual actin filament can be predicted by describing F-actin as a semiflexible polymer. This experiment constitutes a new way for studying elasticity of semiflexible biopolymers. The technique could be applied to the study of F-actin and microtubule changes in elasticity, when they interact with associated proteins.
We are grateful to Olivier Cardoso for his modification of NIH Image Software, and Olivier Cardoso, Olivier Thoumine, Frank Jülicher and Jacques Prost for stimulating discussions. This work benefited from a grant from the Institut Curie. This work was supported by NSF PFF Grant DMR 93-50227 and the A.P. Sloan Foundation (REG).
REFERENCES
- [1] To whom correspondence should be addressed
- [2] Laboratoire associé au Centre National de la Recherche Scientifique (CNRS) et à l’Université Paris 6.
- [3] C.F. Schmidt, M. Bärmann, G. Isenberg, and E. Sackmann, Macromolecules 22, 3638 (1989).
- [4] T. Piekenbrock and E. Sackmann, Biopolymers 32, 1471 (1992).
- [5] E. Farge and A. C. Maggs, Macromolecules 26, 5041 (1993).
- [6] T. Takebayashi, Y. Morita, and F. Oosawa, Biochem. Biophys. Acta 492, 357 (1977).
- [7] J. Drögemeier and W. Eimer, Macromolecules 27, 96 (1994).
- [8] J. Pardee and J. A. Spudich, Methods Enzymol. 85B, 164 (1982).
- [9] T. Yanagida, M. Nakase, K. Nishiyama, and F. Oosawa, Nature 307, 58 (1984).
- [10] A. Ott, M. Magnasco, A. Simon, and A. Libchaber, Phys. Rev. E 48, 1642 (1993).
- [11] H. Isambert, P. Venier, A. C. Maggs, A. Fattoum, R. Kassab, D. Pantaloni, and M.-F. Carlier, J. Biol. Chem. 270, 11437 (1995).
- [12] F. Gittes, B. Mickey, J. Nettleton, and J. Howard, J. Cell Biol. 120, 923 (1993).
- [13] J. Käs, H. Strey, M. Bärmann, and E. Sackmann, Europhys. Lett. 21, 865 (1993).
- [14] H. Felgner, R. Frank, and M. Schliwa, J. Cell Sc. 109, 509 (1996).
- [15] M. Kurachi, M. Hoshi, and H. Tashiro, Cell Motil. Cytoskel. 30, 221 (1995).
- [16] B.J. Berne and R. Pecora, Dynamic Light Scattering (J. Wiley, New-York, 1976).
- [17] S. M. Block, L. S. Goldstein, and B. J. Schnapp, Nature 348, 348 (1990).
- [18] J. T. Finer, R. M. Simmons, and J. A. Spudich, Nature 368, 113 (1994).
- [19] T. T. Perkins, S. R. Quake, D. E. Smith, and S. Chu, Science 264, 822 (1994).
- [20] N. Suzuki, H. Miyata, S. Ishiwata, and K. Kinosita Jr., Biophys. J. 70, 401 (1996).
- [21] C. Wiggins, D. Riveline, A. Ott, and R. Goldstein, submitted to Biophysical Journal, cond-mat/9703244
- [22] E. Guyon, J.-P. Hulin, and L. Petit, Hydrodynamique physique, (Editions du CNRS, Meudon, 1991), p. 359.