Magnetization Jump in a Model for Flux Lattice Melting at Low Magnetic Fields
Abstract
Using a frustrated XY model on a lattice with open boundary conditions, we numerically study the magnetization change near a flux lattice melting transition at low fields. In both two and three dimensions, we find that the melting transition is followed at a higher temperature by the onset of large dissipation associated with the zero-field XY transition. It is characterized by the proliferation of vortex-antivortex pairs (in 2D) or vortex loops (in 3D). At the upper transition, there is a sharp increase in magnetization, in qualitative agreement with recent local Hall probe experiments.
pacs:
PACS numbers:74.60.Ge, 64.60.Cn, 74.60.-wAmong the most debated aspects of high-Tc superconductors is the nature of the superconducting transition in a magnetic field. It is widely believed that in the presence of disorder, the transition may fall into the universality class of a vortex glass[1], or a Bose glass[2]. In addition, disorder may produce an entirely new transition characterized by the disappearance of the Bragg peaks of the Abrikosov lattice above a certain magnetic field[3]. But even in the absence of disorder, the phase transition is not fully understood. At high applied fields parallel to , several numerical studies strongly suggest that there is a first-order phase transition with a finite latent heat[4, 5, 6], and a corresponding magnetization discontinuity[5]. At lower magnetic fields, the evidence is more ambiguous. At such fields, the thermodynamics of the field-induced vortices should be strongly influenced by fluctuations of the zero-field degrees of freedom, which are far more numerous than the field induced vortex degrees of freedom[7].
Experimental evidence for a first-order transition with a magnetization jump has been reported for both Bi2Sr2CaCu2O8+δ[8] and YBa2Cu3O7-δ[9]. These measurements show that the transition is accompanied by an increase in vortex number density, suggesting a melting analogous to that of water.
In this paper, we present model calculations of the superconducting-normal (SN) transition in both two and three dimensions (2D and 3D) in the absence of disorder. Our results strongly suggest that in both cases, the SN transition at low B occurs in two distinct stages. The first is the melting of the vortex lattice at , and is characterized by disappearance of the Bragg peaks associated with solid order. The second stage is driven by the XY degrees of freedom, and occurs at temperatures above . That zero-field XY transition is accompanied by the unbinding of vortex-antivortex pairs (in 2D), or proliferation of vortex loops (in 3D)[10]. In either case, these excitations screen the repulsive interactions between the field-induced vortices or vortex lines[11]. Consequently, the density of field-induced vortices becomes larger, leading to an increase in the absolute magnetization as observed experimentally. In 3D, this screening is accompanied by the vanishing of , the z-component of the helicity modulus, which measures the rigidity of the phase degrees of freedom in the direction[12]. Since this occurs at a sharp temperature, the second stage could be a true phase transition in 3D.
Our calculations are based on the widely-studied frustrated model on a stacked triangular lattice[4]. This model has the Hamiltonian where is the phase of the superconducting order parameter at site , is the isotropic coupling energy between nearest-neighbor sites, and accounts for any applied magnetic field through a vector potential . The choice of triangular grid minimizes the periodic vortex pinning potential which is an artifact of any discrete lattice[13]. We evaluate the equilibrium and dynamical properties of using respectively a standard Monte Carlo (MC) procedure[14], and solving the coupled Josephson equations with Langevin dynamics[15]. For each plaquette , we determine a vorticity vector () from Here the summation runs along the bonds belonging to the plaquette labeled ; and
Previous calculations[4] have established that there is a first-order phase transition at high fields in the direction (, where is the flux per triangular plaquette, and ). At low fields (f = 1/25) on a simple cubic lattice[14], there is an apparent double transition: the first stage is a melting transition, followed at higher temperatures by a loss of phase coherence parallel to the axis (as measured by . By contrast, Jagla et al found that for , the transitions are separate only in the presence of quenched disorder[16].
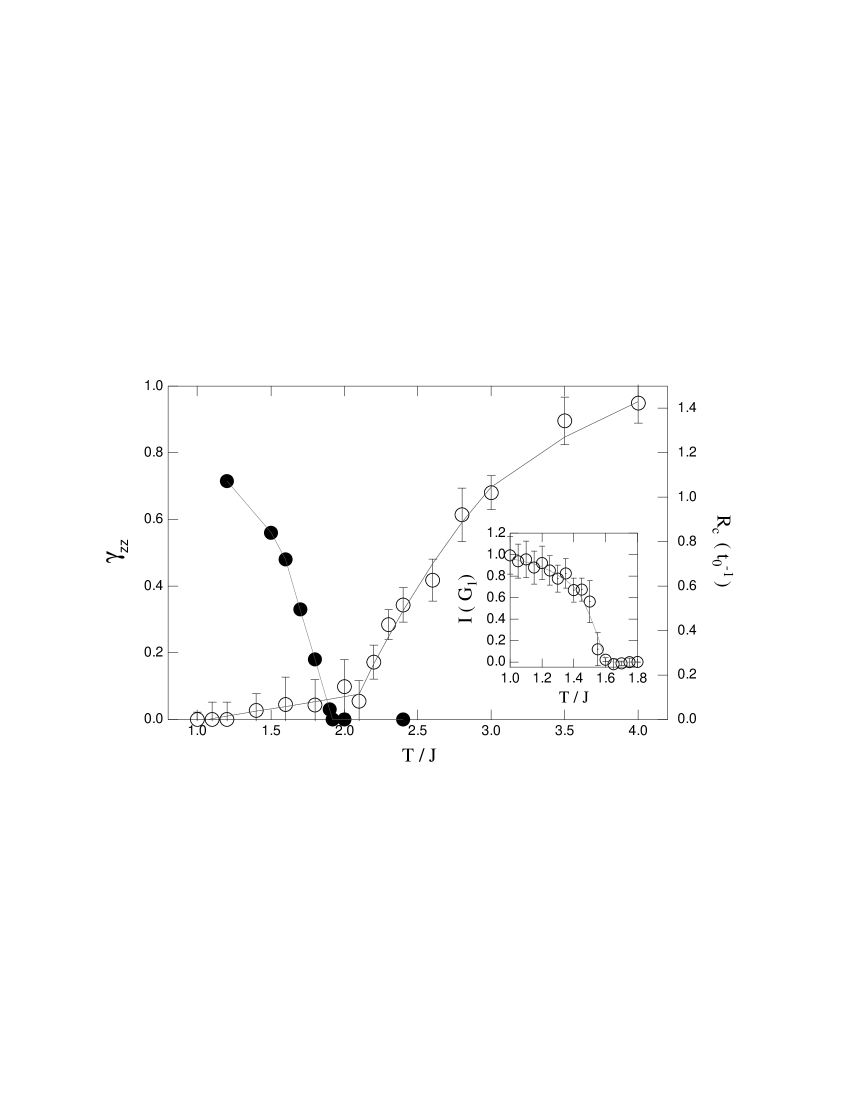
We first show that a similar double transition occurs in the stacked triangular lattice. Fig. 1 shows , the c-axis resistance , and the first order Bragg peak intensity (inset) as a function of temperature for . is taken as one of the six equivalent shortest reciprocal lattice vectors in the plane. We use periodic boundary conditions in all three directions and a lattice which is a parallelopiped of size , i. e., 48 vortex lines. Clearly, and go to zero at quite different temperatures, suggesting a double transition. The lower temperature, denoted , corresponds to the loss of solid-like structural order. The upper transition occurs at . The behavior is characterized by logarithmically slow relaxation of to its non-zero equilibrium values over MC sweeps. The small high- tail of depends on sample thickness, and the data shown in the figure represent asymptotic behavior up to . Starting from typical equilibrium configurations thus obtained, we carried out dynamical calculations within the resistively shunted Josephson junction (RSJJ) model[15, 16]. Using periodic boundary conditions, we injected a uniform current ( per grain) through the lowermost xy-plane and extracted through the xy-plane in the middle of the sample, effectively creating a periodic pattern of alternating current flow along the z-axis. The resulting dissipation is sensitive mainly to the presence of net transverse vorticity, and its fluctuations. We also calculated , analogous to the inplane resistivity, again using a similar periodic arrangement. This exerts a shearing force on two halves of the lattice and probe directly the shear rigidity of the lattice on length scales of our simulation box. The qualitative behavior of is very similar to , i. e. it displays a sharp increase at [17].
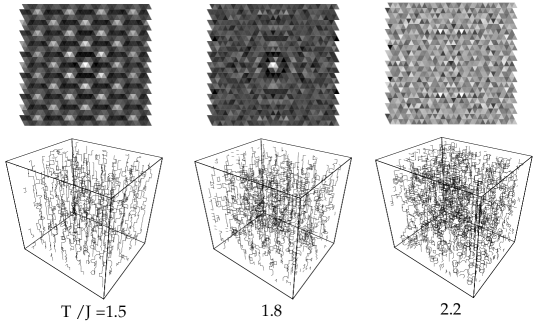
Fig. 2 shows the top-to-bottom vorticity density-density correlation function as a function of for . Note the periodic lattice of peaks at , the presence of only a strong central peak at , and the absence of peaks at . The strong central peak suggests that at the vortex lattice has melted into a line liquid with a finite line correlation length along the field direction. This separation between the melting and transition is a low-field phenomenon: at , the I() and vanish at nearly the same within our resolution.
To probe the vortex density change associated with the transitions, we must abandon periodic boundary conditions, because these enforce a fixed density in the system, whose value is dictated by the applied field. We therefore adopt free transverse boundary conditions [18], while still maintaining periodic boundary conditions in the direction. This procedure allows the outermost surface of the vortex ensemble to have a variable position.
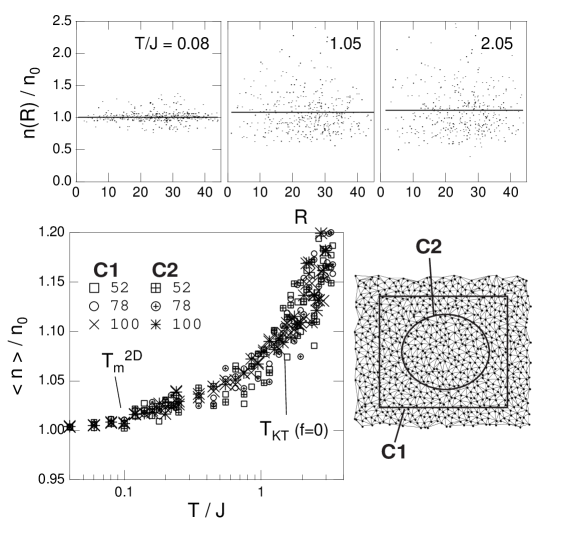
We first discuss our results in 2D, considering on a triangular grid of different sizes with and . One might think of taking the “magnetization” as the average net vortex density , where is the local vortex density and is the total area. However, defined in this way suffers from spurious boundary effects, arising from the depletion of vortices near the boundaries in the lattice phase. This surface effect[19] vanishes for large samples as . Instead, we look at the local Voronoi cell area , i. e., the area of the generalized Wigner-Seitz cell for vortex [6]. A local vortex density at a point in the simulation box may then be defined as where gives 1 if the point lies in the Voronoi cell associated with vortex . Next, the local magnetization which we equate to the bulk average density is calculated from as the average of inverse Voronoi area for vortices lying within a measurement area suitably distant from the sample boundary.
For there are, besides the field-induced vortices, numerous thermally induced vortex-antivortex dipole pairs, which must be eliminated before this procedure is applied. To do this, we pair each antivortex with the nearest vortex, and remove them from the count. Since most such dipole pairs are much smaller than , this criterion is justified.
For the 2D melting transition occurs near , as determined by the vanishing of the Bragg peak . The zero-field (i. e., in 2D, the Kosterlitz-Thouless) transition occurs at about . Superconductivity in 2D is destroyed at . As shown in Fig. 3, (where is the nominal density) displays a sizeable increase across . This increase is independent of system size(checked up to grains). As further evidence that the boundaries are not producing this increase, we note that we obtain the same results for for different choices of measurement areas, and .
The upper panel of Fig. 3 shows that the local density fluctuates progressively more as increases: near , the rms width of the local bond length fluctuation is about 0.15, a value close to the Lindemann number. The increase in density at high temperatures arises mainly from an increase in the frequency of short bonds, which occur throughout the sample as is clear from the panel. We have also observed at a sharp jump in the density of topological lattice defects, such as disclinations. If these defects are predominantly of a particular type such as lattice vacancies, we would expect a corresponding jump in vortex density. However, we do not observe a sizeable increase in at within our resolution of about 2 %.
As the vortex liquid is further heated, the vortex density increases to a value well above that of the solid. This increase is due to the excitation of vortex-antivortex pairs characteristic of the Kosterlitz-Thouless transition. The excited pairs screen the repulsion between the field-induced vortices, lowering the effective chemical potential for field induced vortices and making the system more compressible.
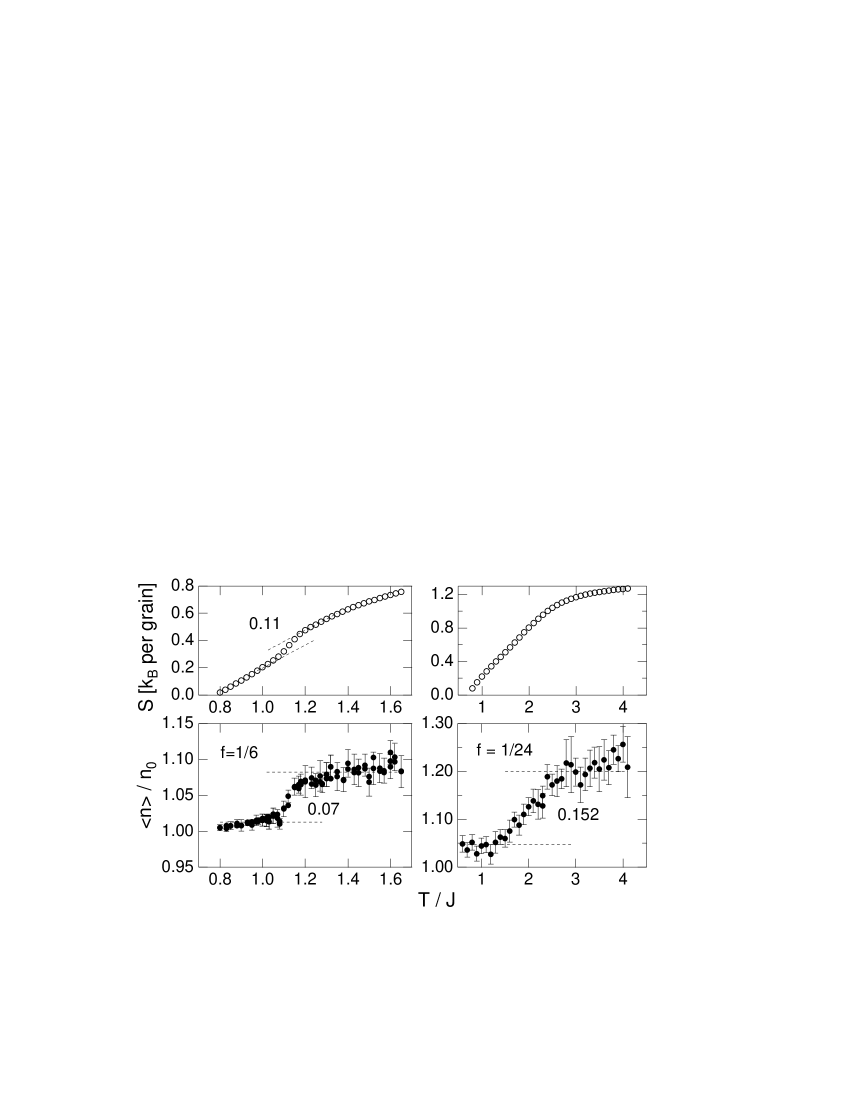
Fig. 4 shows the corresponding behavior in 3D, at and . Once again below the zero field 3D XY transition at , increasing markedly near for and near for . For , this increases occurs over a temperature range , just at the first order phase transition where both lattice order and phase coherence parallel to the field are destroyed ( for ). The relative change in vortex density, , is less than 7 % for . The entropy as calculated from displays a corresponding jump per grain (or per vortex) as shown in the upper panel.
For , the change in is spread over a wider temperature range (), and the midpoint of the increase in falls at . The overall field change The entropy does not show a recognizable jump near For this open-boundary system, , about below the value found with periodic boundary conditions. At , the two transitions are indistinguishably close, and any possible change associated with melting is overshadowed by the larger increase in due to screening by vortex loops at for this dense system. Thus, for there is a phase between and with no lattice order, but yet with a diamagnetic moment almost as large as in the vortex lattice phase. At high temperatures, the vortex density rises substantially above the solid phase.
This overall increase in is consistent with experiments, but the rise is associated, not with melting itself, but rather with the disappearance of phase coherence in the z direction (), which is also accompanied by dramatic changes in the transport coefficients, and In 3D, this increase is associated with the proliferation of vortex loops, caused by the 3D XY fluctuations. The loops screen the repulsion between vortex lines, allowing them to come closer together and the net vortex density to increase. In 3D, the screening also encourages collision and fusion of field induced vortex lines[20], causing them to lose the longitudinal phase coherence at .
The rise in for in our model would actually occur over a very narrow temperature range in the real superconductor. This is because in YBa2Cu3O7-δ is strongly temperature-dependent near with . Using the simple mean field form for the temperature dependence of and material parameters for YBa2Cu3O7-δ, we estimate for and for . Thus the rise in Mz, in fact, could occur over a very narrow temperature range in high-Tc materials, in good agreement with experiments[8, 9].
Finally, we consider whether the upper transition in 3D might be a true, second phase transition, and not just a crossover. Numerically, there are several results suggesting a separate phase transition at First, at [14, 17, 21], and dissipation due to extensive flux line cutting sets in both parallel and perpendicular to the field at [17]. An analysis of vortex configurations also reveals that infinite clusters of colliding vortex lines and loops first appear at [17] reminiscent of a percolation transition. Recent numerical simulations using London vortex loop model suggest a similar phase transition, separate from the melting transition[22, 23].
Tešanović has considered the low field regime of the mixed state[7]. By a singular gauge transformation introducing fictitious antivortices, the original problem is transformed into one in which the new order parameter experiences no applied field but a fluctuating gauge field. The XY-type transition of this new order parameter(the so-called “ transition”) is a possible candidate for the transition at for . We emphasize that increase in at Tℓ results from the onset of screening by the background vortex loop plasma. It appears that a similar transition between a superfluid and metallic state exists in a 2d quantum bosons interacting with strong transverse gauge fluctuations[24, 23].
In conclusion, we have calculated the change in magnetization and other properties of the flux lattice in a model high-Tc superconductor near and above the melting transition at relatively low fields[25]. The transition proceeds in two stages, a lower melting transition being followed by a broader transition or crossover associated with proliferation of vortex loops in 3D, or vortex-antivortex pairs in 2D[26]. The magnetization increases sharply at this second stage, in good agreement with recent experimental data.
This work was supported by DOE Grant DE-FG02-90 ER45427 through the MISCON, and by NSF Grant DMR94-02131.
REFERENCES
- [1] M. P. A. Fisher, Phys. Rev. Lett. 62, 1415 (1989).
- [2] D. R. Nelson and V. M. Vinokur, Phys. Rev. Lett. 68, 2398 (1992).
- [3] Seungoh Ryu, A. Kapitulnik and S. Doniach, Phys. Rev. Lett. 77, 2300 (1996); M. J. P. Gingras and D. A. Huse, Phys. Rev. B, 53, 15193 (1996); T. Giamarchi and P. L. Doussal, Phys. Rev. B, 52, 1242 (1995).
- [4] R. E. Hetzel, A. Sudbø and D. A. Huse, Phys. Rev. Lett. 69, 518 (1992).
- [5] R. Šášik and D. Stroud, Phys. Rev. Lett. 75, 2582 (1995).
- [6] Seungoh Ryu and D. Stroud, Phys. Rev. B 54, 1320 (1996).
- [7] Z. Tešanović, Phys. Rev. B 51, 16204 (1995).
- [8] E. Zeldov et al, Nature, 375, 373 (1995).
- [9] U. Welp et al, Phys. Rev. Lett. 76, 4809 (1996).
- [10] J. M. Kosterlitz and D. J. Thouless, J. Phys. C 6, 1181 (1973); R. P. Feynman, in Progress in Low Temperature Physics, vol. 1, edited by C. J. Gorter (North-Holland, 1955).
- [11] S. Doniach and B. A. Huberman, Phys. Rev. Lett. 42, 1169 (1979).
- [12] C. Ebner and D. Stroud, Phys. Rev. B 28, 5053 (1983).
- [13] M. Franz and S. Teitel, Phys. Rev. Lett. 73, 480 (1994); S. A. Hattel and J. M. Wheatley, Phys. Rev. B 51, 11951 (1994).
- [14] Y.-H. Li and S. Teitel, Phys. Rev. B 47, 359 (1993).
- [15] K. K. Mon and S. Teitel, Phys. Rev. Lett. 62, 673 (1989).
- [16] E. A. Jagla and C. A. Balseiro, Phys. Rev. Lett. 77, 1588 (1996).
- [17] Seungoh Ryu and D. Stroud, preprint, (1997).
- [18] The free boundary conditions constitute a perturbation tending to lower the melting temperatures (by about 10 % for , less than 2 % for ) below their periodic values.
- [19] C. Ebner and D. Stroud, Physica C162-64, 1469 (1989).
- [20] We observe that is signaled by the appearance of an “infinite vortex tangle” and by large fluctuations in transverse vorticity, not just by line entanglement and the occurrence of finite vortex loops, both setting in near for thermodynamic samples.
- [21] A. E. Koshelev, unpublished.
- [22] A. K. Nguyen, A. Sudbø and R. E. Hetzel, Phys. Rev. Lett., 77, 1592 (1996).
- [23] Tao Chen and S. Teitel, cond-mat/9610151; preprint, (1997).
- [24] D. K. K. Lee, D. H. Kim and P. A. Lee, Phys. Rev. Lett., 76, 4801 (1996).
- [25] For highly anisotropic systems with we estimate roughly corresponds to Gauss[4, 21]. Furthermore, the density of unit vortex segments belonging to the field-induced vortices for for is less than 50 % of those due to vortex loops induced at .
- [26] Representative movies from the simulation may be found at http://www.physics.ohio-state.edu:80/~ryu/jj.html.