Density Functional Theory of Epitaxial Growth of Metals
Abstract
This chapter starts with a summary of the atomistic processes that occur during epitaxy. We then introduce density functional theory (DFT) and describe its implementation into state-of-the-art computations of complex processes in condensed matter physics and materials science. In particular we discuss how DFT can be used to calculate parameters of microscopic processes such as adsorption and surface diffusion, and how they can be used to study the macroscopic time and length scales of realistic growth conditions. This meso- and macroscopic regime is described by the ab initio kinetic Monte Carlo approach. We discuss several specific theoretical studies that highlight the importance of the different diffusion mechanisms at step edges, the role of surfactants, and the influence of surface stress. The presented results are for specific materials (namely silver and aluminum), but they are explained in simple physical pictures suggesting that they also hold for other systems.
1 INTRODUCTION
Many basic concepts for surface diffusion and crystal growth have been developed already more than 40 years ago (see e.g. [1, 2, 3]). In recent years the subject has attracted significant attention that is largely due to new experimental advancements, progress in theoretical methods, and the importance of crystal growth for technological applications. A thorough knowledge of the motion of atoms at surfaces is a key factor to the understanding of chemical reactions at surfaces, of crystal growth, and to the question under which conditions thermal equilibrium can be achieved (at least locally) at crystal surfaces. In typical growth experiments deposition rates are of the order of a monolayer (ML) per minute, and the diffusion of atoms at the surface is too slow (at least for some processes) so that thermal equilibrium is often not reached. As a consequence, the structures which occur at surfaces are usually a result of the kinetics.
Nevertheless, under certain conditions the resulting structures are ruled by thermal equilibrium, i.e., they correspond to the minimum of the free energy. This may occur when the adatom mobility is very high, the deposition rate is low, or when growth is interrupted and the sample annealed. Concerning the acquired surface morphology one then distinguishes the following three different growth modes (cf. Fig. 1): Frank-van der Merwe or layer-by-layer growth, Volmer-Weber growth, where three-dimensional islands are formed and the overlayer does not completely cover the exposed substrate surface, and Stranski-Krastanov growth with layer-by-layer growth supplanted by island growth. Bauer [4] had discussed the conditions for these growth modes and pointed out that the actually realized surface morphology (under thermal equilibrium conditions) is controlled by the competition of the surface energy of the substrate, the surface energy of the film, and the interface energy of the film and substrate.
The modern treatment of growth under non-equilibrium conditions starts with the seminal paper by Burton, Cabrera, and Frank (BCF) [3], who realized that a surface usually is not perfectly flat but has imperfections such as steps. Steps are the boundary between regions that correspond to upper terraces and regions that correspond to lower terraces. They might occur at random or can be created in a controlled manner by cutting the surface in an orientation close to a low index plane. In the latter case the surface is called a vicinal surface. At steps and particularly at kink sites adatoms are bound most favorable and BCF assumed that on a stepped surface growth occurs by attachment of deposited adatoms to steps that subsequently advance. This growth mode is called step flow and is indeed easily achieved experimentally at higher temperatures. It results in flat films. The step-flow growth mode requires a high mobility of the deposited atoms, so that they reach the existing steps before meeting other adatoms. Thus this situation is close to thermal equilibrium.
Usually it is desirable to grow crystals at not too high temperatures. Then the adatom mobility is lower, and deposited atoms might not reach an intrinsic step edge. Instead, they will wander around on the surface and meet other atoms, eventually nucleating a new small island. Further atoms will be caught at the edges of these islands (or create new ones), so that growth proceeds via two-dimensional growth of the islands. Additionally, during the initial stage of film growth the chance that newly deposited atoms land on an island is small. Nucleation and growth of islands can be described by phenomenological rate equations [5, 6] and we will discuss this approach briefly in the following Section. The competition between step flow growth and growth via nucleation, spread, and eventual coalescence of islands on the terraces of a vicinal surface can be captured if one incorporates the rate equation formalism into the BCF equations [7].
Using rate equations one usually describes diffusion by effective parameters but unfortunately lacks a detailed understanding of the microscopic mechanism behind them. For example, it has been discussed by several authors [8, 9, 10, 11, 12, 13, 14] that surface diffusion can occur via two different mechanisms:
-
An adatom may simply hop from one low-energy site to another one, while the substrate reacts only modestly by local relaxations, or
-
an adatom may diffuse by atomic exchange where it changes place with a substrate atom and the ejected substrate atom moves further.
These two mechanisms are operative at the flat regions of the surface, but also for diffusion across steps or parallel to step edges. The interplay of those different diffusion processes significantly affects the shape of growing islands. We will also see an interesting dependence of these two mechanisms on surface stress, that exists at free surfaces and also results from lattice mismatch during heteroepitaxy.
Kinetic limitations might lead to either two-dimensional growth or three-dimensional growth. The former is achieved when atoms that land on islands can easily move down. However, when atoms which land on an island are hindered to move down, islands nucleate on top of islands, and a three-dimensional structure results (see also Ref. [15]). As in the above discussion of thermal equilibrium one also often labels the kinetic growth modes according to the surface morphologies of Fig. 1, although the kinetic and the thermodynamic limit represent totally different physics.
In order to gain insight into growth phenomena it is necessary to examine all possibly relevant microscopic processes on the atomic scale. In Section 2.1 these processes will be identified. Section 2.2 then summarizes some aspects of the description of growth by rate equations, and Section 2.3 analyses the conditions at which two-dimensional growth is attained.
Theoretical methods that are promising for a reliable description of surface diffusion and growth are described in Section 3. In particular we give a brief review of density functional theory in Section 3.2. Then, in Section 3.3 we sketch how DFT is implemented in actual computational schemes and utilized to identify microscopic processes and to obtain growth-relevant parameters. Section 3.4 describes how these ab initio parameters can be used to predict or analyze the temporal and spatial evolution of epitaxial growth on macroscopic scales. Ab initio kinetic Monte Carlo simulations make the connection between the atomic scale and time and length scales of realistic growth conditions.
Section 4 then presents some recent results of close-packed fcc surfaces. We start with an analysis (but all these results are still predictions) of the aluminum and silver (111) surfaces (Sections 4.1 and 4.2). Sections 4.3 and 4.4 discuss results for aluminum and silver (100). In particular, we consider the effects of stress for the two silver surfaces (Sections 4.2.1 and 4.4.2), possibly modified by strain due to heteroepitaxy. For the Ag (111) surface we discuss in Section 4.2.2 how adatom motion, the island density, and consequently the growth mode can be influenced by surface active contaminants, so-called surfactants.
2 ATOMISTIC PROCESSES AND RATE EQUATIONS
2.1 Atomistic processes
The conceptually simplest growth technique is molecular beam epitaxy where an atom that has landed at the surface may either stay on the surface and wander around, or evaporate back into the gas phase. The latter happens at a rate , where is the effective attempt frequency (in some works this term is approximated by the vibrational frequency of the isolated adatom on the surface), is the adsorption energy of the adatom, the Boltzmann constant, and the substrate temperature (for simplicity we assume here a situation of atomic desorption, i.e., no formation of molecules). Typically is larger than the activation barriers for other processes that occur on a surface so that regardless of the exact magnitude of (typically of the order of s-1) evaporation can be neglected during growth.
The different atomistic processes encountered by adatoms are illustrated in Fig. 2. After deposition atoms can diffuse across the surface and will eventually meet another adatom to form a small nucleus or get captured by an already existing island or a step edge . Once an adatom has been captured by an island, it may either break away from the island (reversible aggregation) or remain bonded to the island (irreversible aggregation). An atom that is bonded to an island may diffuse along its edge until it finds a favorable site. As long as the coverage of adsorbed material is low (say ), deposition on top of islands is insignificant and nucleation of islands on top of existing islands practically does not occur. However, if the step down motion is hindered by an additional energy barrier, nucleation of island on top of islands becomes likely .
In principle it is possible that not just single adatoms but also dimers and bigger islands migrate . For example, a dimer might diffuse by the two atoms rotating around each other. Moreover, compared to a single adatom, a dimer may be less bounded to the substrate since the electrons of the two adatoms participate to the adatom-adatom bond and not only to the adatom-substrate bonds. Therefore, it may be expected a low activation barrier for the diffusion of dimers, but there is no clear evidence yet available. Finally, it is sometimes believed that a large island is completely immobile. However, results of Wen et al. [16] for Ag/Ag (100) show that even large scale clusters with to atoms can diffuse at room temperature. Diffusion of a cluster can either happen by consecutive edge diffusion of single atoms from one side of the cluster to the other, or by some concerted motion of all atoms in the cluster. The importance of the diffusion of dimers or large islands during growth is an issue that deserves more attention in future research but will not be addressed any further in this chapter.
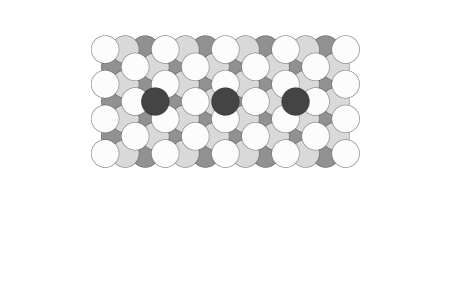
Processes such as attachment to and detachment from step edges depend quite sensitively on the local environment, because chemical bonding is a rather local phenomenon and largely determined by the coordination of nearest neighbor atoms. Figure 3 displays three important geometries of step-edge atoms. In a bond cutting model of metallic bonding the energy of an atom scales as the square root of the local coordination (see Section 3.1 for more details). In this approach it follows that the binding energy of an atom at a kink site (atom 1 in Fig. 3) equals the cohesive energy. This is indeed a general results and implies that kink sites help to establish thermal equilibrium of the surface with the bulk (note that a kink atom which detaches from a step creates a new kink in the step edge). Compared to an isolated adatom on the surface, the binding energy of an atom in the step edge (atom 2 in Fig. 3) is about 30 % and 60 % larger than the binding energy of atom 1 and atom 3, respectively.
The above discussion refers to metallic bonding and is not necessarily valid for systems which can form covalent bonds and therefore prefer a certain low coordination.
At not too high temperatures atoms will usually not detach from an island but diffuse along the edge. Eventually they will reach a higher coordinated site such as kink site 1. In general, fast edge diffusion leads to rather compact island shapes, but when the edge diffusion is strongly hindered, adatoms remain at the edge site where they reach the island and islands acquire a fractal or dendritic form (“hit and stick mechanism” [17]).
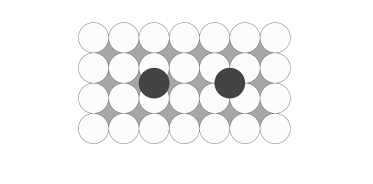
At a fcc (111) there are two close-packed steps (see Fig. 4), and because more open steps typically have a higher step formation energy, these close-packed steps are expected to dominate the periphery of islands.
The steps are labeled as and facets, referring to the plane passing through the atoms of the step and the atom of the substrate (often these steps are labeled A and B). Because of the microscopic difference of the two types of steps the diffusion along them will be different as well. It has been observed for growth of Pt on Pt (111) [18] that at a certain temperature the shape of the islands observed is triangular. At a higher temperature, triangular islands are observed again, but the triangles are rotated by . More precisely, the islands are bounded only by -faceted steps at a lower temperature while at a higher temperature the islands are bounded by -faceted steps. It was proposed [18] that this is a consequence of the different diffusion constants for migration along the two steps and particularly their different temperature dependences.
The key idea behind the kinetic description of the growth phenomena is that processes occurring during growth, such as diffusion or desorption, are described by rates. The rate of a microscopic process that occurs during growth usually has the form [19, 20, 21]
| (1) |
where is the difference in the Helmholtz free energy between the maximum (saddle point) and the minimum (equilibrium site) of the potential curve along the reaction path of the process . is the temperature, the Boltzmann constant, and the Planck constant. The free energy of activation needed by the system to move from the initial position to the saddle point is given by
| (2) |
Here is the sum of the differences in the static total and vibrational energy of the system with the particle at the minimum and at the saddle point, and is the analogous difference in the vibrational entropy. The rate of the process can be cast as follows:
| (3) |
where is the effective attempt frequency. In the case of isotropic motion of an adatom on the surface it follows from Eq. (3) that the diffusion constant is [22]. The prefactor where is the jump length and the dimensionality of the motion ( for the surface).
The two basic quantities in Eq. (3) are the attempt frequency and the activation energy . Transition state theory (TST) [20, 21] allows an evaluation of within the harmonic approximation:
| (4) |
where and are the normal mode frequencies of the system with the adatom at the equilibrium site and at the saddle point, respectively, and is the number of degrees of freedom. The denominator in Eq. (4) contains the product of only normal frequencies, because for the adatom at the saddle point one of the mode describes the motion of the particle toward the final site and has an imaginary frequency. TST is only valid when is larger than .
The attempt frequency shows a much weaker temperature dependence than the exponential and for typical growth temperatures it is of the order . When the barriers for two different diffusion events are different a compensation effect [23] may occur, i.e., is larger for processes with a higher energy barrier. Indeed, a higher energy barrier usually implies a larger curvature of the potential well around the equilibrium site of the adatom. The corresponding vibrational frequencies of the adatom in such a potential are larger as well, which implies [see Eq. (4)] that the attempt frequency increases.
To define and determine (and other quantities important for the description of growth such as adsorption energies) we need to calculate the ground-state total energy of the adsorbate system for a dense mesh of adatom positions. This yields the so-called potential-energy surface (PES) which is the potential energy experienced by the diffusing adatom,
| (5) |
where is the ground-state energy of the many-electron system (also referred as the total energy) at the atomic configuration . According to Eq. (5) the PES is the minimum of the total energy with respect to the -coordinate of the adatom and all coordinates of the substrate atoms . Assuming that vibrational effects can be neglected, the minima of the PES represent stable and metastable sites of the adatom. Note that this PES refers to slow motion of nuclei and assumes that for any atomic configuration the electrons are in their respective ground state. Thus, it is assumed that the dynamics of the electrons and of the nuclei are decoupled. This is the Born-Oppenheimer approximation that for not too high temperatures is usually well justified.
Now consider all possible paths to get from one stable or metastable adsorption site, , to an adjacent one, . The energy difference between the energy at the saddle point along and the energy of the initial geometry is the barrier for this particular path. If the vibrational energy is negligible compared to , the diffusion barrier then is the minimum value of all of the possible paths that connect and , and the lowest energy saddle point is called the transition state. Although often only the path with the most favorable energy barrier is important, it may happen that several paths exist with comparable barriers or that the PES consists of more than one sheet (e.g. Ref. [24]). Then the effective barrier measured in an experiment or a molecular dynamics (MD) simulation represents a proper average over all possible pathways.
In the previous description it was assumed that an adatom moves from one binding site to the nearest neighbor one. However, at higher temperatures diffusing adatoms may from time to time jump over long distances, spanning several lattice spacing [25]. Only little is known about this process. In a recent experimental work on the diffusion of Pd on W (211) Senft and Ehrlich [26] have extracted from their field ion microscopy (FIM) measurements an activation barrier for long jumps roughly twice that for single jumps. From the analysis of their experimental data they have determined the temperature dependent probability for the occurrence of very long jump (at least three nearest neighbor distances). These values differ of at least one order of magnitude from the theoretical ones [27] and the reason for this discrepancy are still unknown. More effort has to be put into a better understanding of the influence of such long jumps on the intralayer transport.
But diffusion might also occur with a completely different mechanism, the so-called diffusion by atomic exchange (or exchange mechanism). The adatom can replace a surface atom and the replaced atom then assumes an adsorption site. This was first discussed by Bassett and Webber [8] and Wrigley and Ehrlich [9]. Even for the crystal bulk, namely Si, exchange diffusion has been discussed [28]. This mechanism is activated by the desire of the system to keep the number of cut bonds low along the diffusion pathway. On fcc (100) surfaces diffusion by atomic exchange was observed and analyzed for Pt [11] and Ir [12]. For Al (100) it was predicted by Feibelman [13] and for Au (100) by Yu and Scheffler [14]. The geometries for hopping and exchange diffusion at a fcc (100) surface are shown in Figs. 5(a) and (b).
Diffusion along a step edge can also occur via the exchange mechanism as illustrated in Fig. 5(c) for a {111} step on the (111) surface. An adatom at this step edge experiences a rather high diffusion barrier, if the mechanism would be hopping: Either it has to move ontop of a substrate atom or to leave the step edge to reach an adjacent step edge position. However, if an in-step atom would move out of the step and the adatom fill the opened site, the coordination of all the particles would not decrease appreciably during the whole process. Thus, the corresponding energy barrier may be lower than that of the hopping process. It is also plausible that in general the attempt frequency is different for a hopping and an exchange process.
So far we have only discussed growth processes in the submonolayer regime. But except when coverage is sufficiently low atoms might also land on top of an existing island. Several questions arise at this point. If the island is large enough and the adatom is far enough away from the edge of the island, diffusion of this adatom usually will not differ from diffusion on the flat terrace. However, this assumption is not always valid. The strain present on the island may affect the self-diffusion barrier. Moreover, the atomic structure ontop of the island may differ from the structure of the flat surface. An example is given by Pt islands on Pt (111): at K STM images show reconstructed and unreconstructed terraces in coexistence with different island densities [29]. Furthermore, what happens if the adatom is close to the island edge? Is the atom attracted by the edge? Does it stay on top of the island or is it hopping down?
It has been found first by Ehrlich and Hudda [30] and Schwoebel and Shipsey [31] and afterwards by a number of other studies that metallic systems often exhibit an additional barrier hindering the diffusion over a step edge as it is illustrated in Fig. 6. This step-edge barrier is often referred to as Ehrlich-Schwoebel barrier.
Intuitively its occurrence can be understood if hopping is the relevant mechanism by employing simple bond counting arguments: The atom that diffuses over the step edge is weaker bound right over the step edge because at this position the number of bonds is reduced. This argument is valid for a step down process by hopping. The situation may be different in the case of the exchange mechanism (cf. Fig. 7) because here the number of cut bonds remains low along the diffusion pathway. For some metallic systems [for example, Al on Al (111) and Ag on Ag (100)] calculations have shown that this is the favored situation (see Sections 4.1 and 4.4). Note that the description of the process in terms of a PES [see Eq. (5)] valid for simple jumps of an adatom (i.e., diffusion by hopping) holds for the diffusion by atomic exchange as well [see Fig. 5(b) and (c)].
The step-edge barrier determines in homoepitaxy whether the growth mode is three-dimensional island growth or two-dimensional layer-by-layer growth. From experiments this barrier has been estimated by analyzing STM images [32, 33]. The idea is to measure the size of an island just when nucleation on top of an island starts and to utilize nucleation theory to estimate the step-edge barrier. Similar, indirect studies that interpret Monte Carlo simulations [34] will give an estimate of the step-edge barrier. However, these approaches do not distinguish between different step types and are unable to identify the microscopic mechanism for interlayer mass transport.
2.2 Rate equations
Processes and of Fig. 2 form the basis of phenomenological rate equations of the form
| (6) |
| (7) |
These equations describe the time evolution of the adatom density, , and the density of islands of size , , for growth on a flat surface in the submonolayer regime. Adatoms are deposited onto the substrate at a rate adatom/s where is the flux in ML/s and the number of atoms pro ML. The second and third term in Eq. (6) account for isolated adatoms being “lost” because two adatoms can meet at a rate to form a new nucleus, or adatoms get captured at a rate by an island of size . The last two terms in Eq. (6) describe further supply sources of adatoms and are gain terms because dimers may dissociate and adatoms detach from an island of size at a rate . Equation (7) reflects the fact that the number of islands of size increases because islands of size grow and islands of size shrink. The number of islands of size decreases when islands of size either shrink or grow. Note that no evaporation into the gas phase is included in Eqs. (6) and (7) (that means that the description in terms of Eqs. (6) and (7) is appropriate only at not too high temperatures). One could assume that the rate coefficients and are independent on the island size and surface coverage (point island models). Another plausible choice is that the rates depend on the length of the perimeter of the island so that a first approximation is for compact islands. It has been shown [35] that the dependence on size and coverage is more complex but this will not be discussed here. The rate coefficients and are only effective parameters and the physics behind them remains unclear. For example, we will see below that the different processes shown in Fig. 2 may have different energy barriers and different pre-exponential factors, and/or they may proceed by different microscopic mechanisms (see Section 4). In principle, all these features can be taken into account in Eqs. (6) and (7) by introducing different coefficients and but they become less tractable and their clarity gets lost. A rate equation analysis may help to gain some qualitative understanding of growth processes but one can not expect insight into the microscopic mechanisms governing growth.
With the assumption that agglomerates of and more adatoms are stable against break-up ( for ) one derives the scaling relation [36]
| (8) |
where is the island density and the diffusion coefficient of an adatom on the flat surface. The number is called the size of the critical nucleus. Relation (8) can be used to extract microscopic parameters from experimental (in particular STM) measurements: If one measures the island density as a function of , one can determine the critical nucleus size . With a known value for (assuming that it does not change with temperature) one can determine the diffusion barrier and the prefactor if one measures the temperature dependence of . It is not the purpose of this article to review scaling theory; however, we would like to point out that this method is not as straightforward as often believed. For example, as pointed out by Ratsch et al. [37, 38] the size of the critical nucleus is not always well defined unless the temperature is sufficiently low and .
2.3 Critical island area and the action of surfactants
The definition of layer-by-layer growth mentioned at the beginning of Section 1 trivially translates into the following equation [39, 40, 41],
| (9) |
where is the island area at which nucleation sets in on top of an already existing island, and is the island density [cf. also Eq. (8)]. As before and in all what follows we assume that we are in a regime of island growth rather than step flow. If Eq. (9) is fulfilled, the islands will coalesce before a second layer has started to grow. The island density, , and the critical island area, are controlled by the growth conditions (deposition rate and temperature) as well as by the different energy barriers and interactions of the deposited adatoms on the surface and by the minimal size of an island nucleus. is determined by the probability that a number of adatoms meet on the same island and form a stable nucleus.
Without a step-edge barrier the adatoms that land on an island are not hindered to move down and bind at the favorable sites. Thus, the formation of a nucleus on top of an island becomes unlikely, and layer-by-layer growth is expected. However, the situation is different when atoms that land on top of an island are hindered by a step-edge barrier to move downwards. In this case it is more likely that adatoms meet to form a stable cluster that subsequently will grow into a bigger and bigger island. Thus, is smaller (compared to and it is more likely that islands on the surface reach the area before the layer is completed. In other words, when a noticeable step-edge barrier exists Eq. (9) may not be fulfilled and the system will grow three-dimensionally.
Eq. (9) can be also rewritten in the following form
| (10) |
where is the critical coverage for which, when it is exceeded, islands will grow on top of already existing islands. Looking at experimental situations it appears that the conditions set by Eqs. (9) and (10) are slightly too strong and it is probably sufficient to request for good layer-by-layer growth. The importance of the above equations is that they show that the growth mode can be influenced in two independent ways: One can modify the island density (which is controlled by the adsorbate mobility at flat regions) or one can modify the critical island area which is largely determined by the physics at step edges. Thus, it follows that the growth mode can be changed from three-dimensional to layer-by-layer in the following ways:
-
1)
It has been shown by Kunkel et al. [42] that on Pt (111) at very low temperatures the island shape is fractal. This implies that the island perimeter is particularly long, that the islands have rough edges, and many rather thin branches. As a consequence the step-edge barrier might be reduced substantially. But even if the step-edge barrier remained unchanged, the probability for an adatom which lands on such an island to move down to the lower terrace is high, because the adatom will visit the edge very frequently. This makes it likely that a possibly existing energy barrier can be overcome. Moreover, a large number of kink sites or weakly bound atoms is present along the edges of the fractally shaped islands. Thus, an exchange downward diffusion of an adatom on the upper terrace at these sites may be more likely than the same mechanism involving an atom of a compact step edge. Furthermore, we note that the island density is high at low temperature [cf. Eq. (8)] which reduces the probability that more than one atom land in a reasonable time interval on the same island. Altogether these properties give rise to layer-by-layer growth.
-
2)
A second possibility was demonstrated by Rosenfeld et al. [43]. These authors have shown that increasing the island density is in fact sufficient to achieve layer-by-layer growth. A high island density can be obtained for example by lowering the temperature or increasing the deposition rate in the very beginning of growth. Once the island density is increased, the growth is continued at normal (higher and lower ) conditions. Thus, the island density is set large (to low and high parameters) but is not reduced and remains at the value determined by the “normal” and parameters. Indeed, three-dimensional growth did not start before the layer was completed.
-
3)
For completeness we mention the possibility to enhance the mobility of deposited adatoms by photo-stimulation. However, we will not elaborate on this mechanism.
-
4)
A very interesting way to achieve layer-by-layer growth uses surface contaminants, so called surfactants. There is one necessary condition these species should fulfill: They should stay on the surface during growth, thus they should not become buried during the growth process. While a good probability of surface segregation is necessary it alone would not affect the growth mode. There are the following possible mechanisms that, when active, provide that a surface segregating contaminant increases the inter-layer mass transport:
-
The simplest idea that comes to mind is that the surfactant decorates edges of steps and islands and reduces the step-edge barrier, since the atom-surfactant interaction is usually weaker than the atom-atom interaction. Figure 7 demonstrates how this could be achieved. Lowering the step edge barrier facilitates the interlayer transport and . Oxygen for Pt (111) [44] and indium for Cu (100) seem to have this effect [45] and enhance the 2D character of the growth mode. Recently another picture has been proposed [46]: A repelling action of In at steps hampers the attachment of Cu atoms approaching the step edge from the lower terrace and gives rise to an enhancement of the island density. However, the experimental data of Ref. [45] seems to rule out this scenario.
-
It is also possible that surface impurities induce a potential energy gradient that attracts deposited atoms towards the step; for deposited atoms that land on an island the number of visits at the edge is thus increased, and as a consequence the probability to move down is increased as well.
-
Surfactants may act as nucleation centers, thus increasing the island density , while remains unchanged (of course, an increase would be even better). This will induce layer-by-layer growth, provided that the probability that atoms which land on an island and move to the lower terrace is not reduced as well. Moreover, if the surfactant increases the diffusion barriers and but leaves (cf. Fig. 6) essentially unaffected, it follows that is reduced and the wanted effect may result. This mechanism was recently discussed by Zhang and Lagally [47].
-
A forth possibility was discussed in the context of the surfactant action of Sb on Ag (111). The basic mechanism here is that Sb impurity atoms on the surface are practically immobile and act repulsively to deposited Ag adatoms. This will also increase the island density and thus further two-dimensional growth. This mechanism will be discussed in Section 4.2.2.
-
Tersoff et al. [40] have recently discussed Eq. (9) by assuming a circular island shape and various sizes for the island nucleus. They demonstrated that the critical island area is indeed a useful concept. However, we hesitate to give an explicit formula for it in terms of diffusivities and deposition rate because in reality will depend sensitively on the long- and medium-range adatom-adatom and adatom-step interactions (see the attractive gradient towards the step on the upper and lower terraces in Fig. 6), as well as on the diffusion barriers of adatoms parallel to step edges, as these determine the actual shape of an island.
A study of Memmel and Bertel [48] has raised an interesting point. They propose a simple model which connects the diffusion behavior on metal surfaces to the charge density supplied by occupied two-dimensional free-electron surface states. The argument is very appealing: A decrease in the difference between the step edge barrier and the activation energy for diffusion on the flat terraces could enhance the interlayer mass transport. The barrier for the diffusion on the flat terrace is mainly determined by the corrugation of the electron density to which both bulk Bloch states as well as surface states contribute. The surface states are particularly interesting, since they can strongly be influenced. A depopulation of these states induced by confinement onto small islands or by the presence of an appropriate surfactant increases the diffusion barrier on the flat surface with a consequent reduction of the additional step edge barrier at the step edge. Thus, an increased interlayer transport is expected with the related layer-by-layer growth. This picture seems to be appropriate for the effects of oxygen on the growth mode of Pt on Pt (111) [44].
3 TOTAL ENERGY AND THE DESCRIPTION OF GROWTH
In Section 2.1 we defined the potential energy surface (PES) of a diffusing adatom. Obviously, the PES is governed by the breaking and making of chemical bonds, and we also noted the need to take atomic relaxations into account [cf. Eq. (5)]. Thus, the evaluation of the PES requires an accurate, quantum-mechanical description of the many-electron system. This can be achieved by modern density functional theory calculations that combine electronic self-consistency and efficient geometry optimization. Approximate methods, based on the concepts of DFT but employing empirical parameter instead of elaborate calculations have been developed as well. Such approximate methods are widely used by several groups to investigate surface properties and to perform MD investigations of adatom diffusion. We will sketch their main characteristics in Section 3.1. A description of the basic concepts of DFT is then given in Section 3.2, and Section 3.3 describes how DFT is implemented into accurate self-consistent calculation methods. Finally, in Section 3.4 we describe briefly the kinetic Monte Carlo (KMC) technique that is capable to tackle the realistic time and length scale of growth.
3.1 Bond-cutting methods
Several methods have been developed based on the idea that the energy of a many-electron, poly-atomic system can be written in terms of contributions from the individual atoms:
| (11) |
The sum goes over all atoms, and is the contribution of the -th atom. depends sensitively on the local geometry of atom (its embedding). The different bond-cutting methods differ in the treatment of the actual form of the “embedding function” and in the way to determine the necessary materials parameters. The differences are not very significant and the most popular names of these methods are: embedded atom method (EAM) [49, 50], effective medium theory (EMT) [51, 52, 53, 54], Finnis-Sinclair -body potentials [55], second-moment approximation [56], and glue-model [57].
In the simplest version of a bond-cutting approach it is assumed that the energy per atom varies linearly with the atom’s coordination number. Thus, it is assumed that the strength of a bond is invariant of the number of bonds the atom does form. This approach clearly neglects the quantum-mechanical properties of bonding, namely that the bond strength saturates at a certain number of neighbors [56, 58, 59]. In fact, detailed DFT studies have shown [58, 59] that the dependence of on the local coordination is very similar to
| (12) |
with the coordination number of the -th atom.
A more general approach gives
| (13) |
Here describes the pair-wise, repulsive interaction between atoms, and is called the embedding function, that depends on the electron density created at site . For the effective medium theory Christensen and Jacobsen [60] have shown that Eq. (13) resembles the behavior of the simple function noted in Eq. (12), but also contains some refinements. Indeed, is has been shown that Eqs. (11) and (13) represent an approximation of the total-energy expression of density functional theory [53, 54].
The main problem in actual calculations is to determine the necessary parameters to define the embedding function. Typically the parameters are obtained by fitting results from a treatment based on Eq. (13) to some experimental or DFT results of “related systems”. The results depend on what systems and what properties are chosen. The predictive power of these methods has to be questioned (see e.g. [61, 62]). We note, however, that bond-cutting methods hold a significant share of the quantum-mechanical description and thus are most valuable to summarize and to explain trends of results obtained by DFT calculations.
3.2 Density functional theory
The total energy of an -electron, poly-atomic system is given by the expectation value of the many-particle Hamiltonian, using the many-body wave-function of the electronic ground state. For a solid or a surface the calculation of such expectation value is impossible when using a wave-function approach. However, as has been shown by Hohenberg and Kohn [63], the ground-state total energy can also be obtained without explicit knowledge of the many-electron wave-function, but from minimizing an energy functional . This is the essence of density functional theory (DFT), which is primarily (though in principle not exclusively) a theory of the electronic ground state, couched in terms of the electron density instead of the many-electron wave function with the coordinates of the -th electron.
The important theorem of Hohenberg and Kohn [63] (see also Levy [64]) tells: The specification of a ground state density determines the many-body wave function. In other words, Hohenberg and Kohn realized that for the ground state the known functional can be inverted, i.e., . Although it was shown that exists, its explicit form remains unknown.
With the help of this theorem the variational problem of the many-particle Schrödinger equation transforms into a variational problem of an energy functional:
| (14) |
Here is the energy of the ground state, the Hamiltonian of the electrons, , and is the external potential (typically is the Coulomb potential due to nuclei). In this functional is the variable (the electron ground-state density of any -electron system), and is kept fixed. is a universal functional independent of the system, i.e., independent of . For example, is the same for an H-atom, a CO-molecule, a solid etc.. The main advantage of this approach is that only depends on three variables while depends on many variables (the 3 coordinates of all electrons) [65]. Thus, it is plausible that the variational problem of is easier to solve than that of , yet the result for the ground-state energy and the ground state electron density will be the same. The total energy entering Eq. (5) is [66]
| (15) |
where includes all atoms, and is the nuclear charge.
Earlier work (in particular the Thomas-Fermi approach) had shown that the treatment of the kinetic energy is of particular importance and Kohn and Sham [67] therefore wrote the energy functional in the form
| (16) |
where is the functional of the kinetic energy of a system of non-interacting electrons with density , and , the Hartree potential, is the time-averaged electrostatic potential created by the electron density, and is the so-called exchange-correlation functional. It accounts for the Pauli principle, dynamical correlations due to the Coulomb repulsion, and the correction of the self-interaction included for convenience in the Hartree term.
With Eq. (16) the problem of the unknown functional is transformed to one involving and . The functional defined by Eq. (16) can be also modified by adding terms which vanish at the correct electron density. Such a new functional may converge faster towards the ground state or may depend less sensitive on the input density. The latter implies that the input density does not need to be very accurate, yet the resulting energy represents an acceptable approximation for the correct total energy (see e.g. Ref. [68]). Although the functional is not known explicitly in a mathematically closed form, it can be evaluated exactly by using the following “detour” proposed by Kohn and Sham. The variational principle applied to Eq. (16) leads to
| (17) | |||||
| (18) |
where is the Lagrange multiplier associated with the requirement of a constant particle number and thus equals the electron chemical potential. The effective potential is defined as
| (19) |
with , and is a ground-state density of any non-interacting electron system, i.e.,
| (20) |
where we introduced the occupation numbers which is simply the Fermi function. Because is the kinetic-energy functional of non-interacting electrons, Eq. (18) [together with Eq. (20)] is solved by
| (21) |
These are the Kohn-Sham equations. They have to be solved self-consistently together with Eqs. (19) and (20). In principle this gives the exact ground-state electron density and total energy of a system of interacting electrons.
The above Eqs. (16) - (21) contain one term which is not known exactly. This is the exchange-correlation functional . For a better understanding of this term it is instructive to introduce the following Schrödinger equation [69, 70, 71]:
| (22) |
where defines the strength of the electron-electron interaction: = 0 corresponds to the noninteracting system and = 1 to the interacting physical system. is an external potential chosen to maintain the ground state density at its = 1 value independently of . The exchange-correlation energy can be written in a form which resembles a Coulomb interaction,
| (23) |
where is called the exchange-correlation hole. It can be written as
| (24) |
with the electron pair-correlation function . Using a wave function formalism one then obtains [71]
| (25) |
where is the density operator.
According to Eq. (23), the exchange-correlation energy arises from the Coulomb interaction of each electron (e.g. the one at ) with a charge distribution , i.e., the exchange-correlation hole surrounding that electron. The hole is a consequence of the exchange and Coulomb interactions that cause a depletion of electron density in the vicinity of each electron. We note that the picture behind the depletion is a dynamical one. In the time average the depletion is not seen in the electron density, but it gives rise to an important lowering of the total energy, compared to that of a non-interacting electron system.
It is instructive to compare Hartree, Hartree-Fock, and DFT descriptions and in Fig. 8 we show schematically the spin-resolved pair-correlation functions and of a many-electron system of constant density (also called a jellium system). The quantities and are the pair-correlation functions for electrons with parallel and antiparallel spins, respectively. In a spin unrestricted calculation of Eq. (25) is given by . In the pure Hartree description exchange and correlation are ignored and the pair-correlation functions are constant and equal to 1/2. The Hartree-Fock method accounts for dynamical correlations due to the Pauli principle (the exchange). The pair-correlation function , which is the probability of finding an electron at and an electron at with the same spin, shows a dependence on the interelectronic spacing: The closer we are to the electron at , the lower is the probability to find another electron. However, is constant because the Hartree-Fock description only contains the “Pauli correlation” which affects electrons with the same spin, but the depletion due to Coulomb repulsion which is independent of the spin is neglected. These are accounted for in DFT. Thus, DFT gives a correct description of the fact that electrons move in a correlated way and that this correlation is due to the Pauli repulsion (for electrons of equal spin) and the Coulomb repulsion (for all electrons).
The problem that remains in an actual DFT calculation is that the functional is unknown. However, some general properties of this functional and values for some special cases are known. Detailed and accurate understanding exists for systems of constant electron density. The asymptotic behavior at low and high densities is given by expressions derived by Wigner [72] and Gell-Mann and Brueckner [73] and for intermediate densities quantum Monte Carlo calculations have been performed by Ceperley and Alder [74]. This gives the simple curve shown in Fig. 9, and this result for is then used in the functional
| (26) |
which is the local-density approximation (LDA) [67]. Thus, in the LDA the many-body effects are included such that for a homogeneous electron gas the treatment is exact and for
an inhomogeneous system exchange and correlation are treated by assuming that the system is composed from many small systems with a locally constant density.
The LDA can be improved by including the dependence on the density gradient
which leads to the generalized gradient approximation (GGA). Several
different GGAs were proposed in the literature
[75, 76, 77, 78, 79, 80] and have been used successfully for
DFT calculations of atoms, molecules, bulk solids, and surfaces (an overview
can be found in Refs. [80, 81]), but also limitations have been
identified for example by Mitas et al. [82] and Umrigar and
coworkers [83]. It is by now clear that the lattice constants
calculated with a GGA are typically larger than those obtained with the LDA,
with the experimental values usually being in between. Binding energies (or
cohesive energies) of molecules and solids as well as energy barriers of
chemical reactions are improved by the GGA (see Ref. [84, 85] and
references therein). Still, for surface diffusion DFT-LDA calculations give
energy barriers in good agreement with those deduced from experiments and with
GGA calculations. Thus, although the total energies are changed when going
from the LDA to the GGA, the changes in energy barriers that are the differences between total energies are typically less pronounced (see e.g.
Ref. [62, 86]).
3.3 Implementation of DFT into state-of-the-art computations
Typically there are only a few possible adsorption sites and channels for diffusion. This is illustrated in Fig. 10
for the fcc (111) and fcc (100) surfaces. For adatoms that are chemically similar (or equivalent) to those of the substrate the stable sites are those with high coordination and for hopping diffusion the transition state is at the bridge site. The relevant information about the PES then is obtained by calculating the total energy of the system with the adatom placed in those positions. In general, more care is necessary because the bridge site could also be a local minimum of the PES and the energy barrier could be in between the high coordination and the bridge sites. Furthermore, it is possible that the diffusion does not proceed by hopping but by atomic exchange [8, 9, 10, 11, 12, 13, 14].
In the bulk crystal the three-dimensional periodicity can be exploited by using Bloch’s theorem. Unfortunately, the presence of a surface and an adatom on top of it breaks all periodicities. The (in principle) best approach to treat such difficult situation is given by the Green-function method [87, 88]. An, at least in the past, popular approximation for adsorbate systems is the cluster approach [89]. The presently most efficient and practical approach that was also used in the results discussed below is the supercell approach. The supercell may also be called a big cluster, but in contrast to conventional cluster calculations the supercell is periodically repeated. As a consequence, the cluster boundary is treated physically very accurately, and by utilizing the periodicity it is possible to use very big cells. The idea of an adatom on top of a substrate in the supercell approach is sketched in Fig. 11.

The adatom is placed on top of a slab of a certain number of layers. The number of layers has to be sufficiently large so that the adatom does not “feel” the presence of another surface on the other side of the slab (or at least that the quantity to be computed, such as a diffusion barrier, is not affected by the other surface). Alternatively, one could also place an adatom on either side of the slab; in this case, there are more symmetries in the geometry but more layers are needed in the slab to screen the mutual interaction between the two adatoms through the slab. The adequate number of layers depends on the properties that one wants to calculate and the surface orientation, and careful tests have to be carried out. For example for the Ag (111) surface four layers are sufficient when the adatom is placed on only one side of the slab, while for Al (100) seven layers are necessary.
As illustrated in Fig. 11 the geometry repeats periodically in vertical and lateral directions. The lateral periodicity implies that a single adatom placed on a substrate is not at all a single adatom; if the cell size parallel to the surface is chosen for example as () we actually calculate a system with a coverage of . It is therefore important to test that the interaction with the neighboring adatoms can be neglected. On a (111) surface a cell size of () is usually sufficient, but sometimes larger cells [() or even ()] are necessary. To model a diffusion event along or across a step one either chooses a small island on top of a substrate or a vicinal surface. The latter has the advantage that there is only one step in the unit cell so that a smaller cell size is required in order to attain a negligible step-step interaction. The system also repeats in vertical direction separated by a vacuum region. The thickness of the vacuum region has to be tested as well, but the computational cost of a thicker vacuum region is relatively small compared to a larger cell size or a higher number of slab layers (for a deeper discussion of the above technicalities see e.g. Ref. [90]).
Core electrons typically do not take part directly in the binding process of atoms in molecules and solids, and the nature of the chemical bond is mainly determined by the valence electrons. This is exploited by the frozen core approximation where the core electrons are effectively combined with the nuclei to form frozen unpolarizable ions. Still, not just the electrostatic potential but also the quantum nature of the core electrons is felt by the valence electrons. For example, different wave functions have to be orthogonal and therefore the valence wave functions have nodes and oscillate in the core region. For practical calculations one needs to expand the wave function in a suitable basis and we choose a plane wave basis set [91]
| (27) |
A plane wave description of wave functions that have nodes and oscillate requires a very large number of plane waves. This inconvenience is cured efficiently by the pseudopotential approach. Modern ab initio pseudopotentials reproduce the potential of an atom exactly outside the core region defined by a radius and are rather smooth inside the core region. An important requirement on a “good” pseudopotential is that it is transferable. This means that the pseudopotential should behave like the all-electron potential in a variety of different chemical situations. Pseudopotentials that reproduce the same charge inside the core region as the all-electron potential, and therefore have the same scattering properties, are referred to as norm-conserving. Those that are often used have been developed by Bachelet, Hamann, and Schlüter [92], Troullier and Martins [93], and Gonze, Stumpf, and Scheffler [94]. Recently, Vanderbilt [95] proposed ab initio pseudopotentials that drop the condition of norm-conservation and therefore can be used with a lower number of plane waves. The gain in computer time due to the smaller basis set is partially compensated by the costs to calculate the correction required by the neglected norm-conservation.
The electron density is calculated according to Eq. (20) as
| (28) |
where the integration over the Brillouin zone has been replaced by a sum over a mesh of -points and is the weight of the -point. A convenient scheme to construct an appropriate k-point mesh is described by Monkhorst and Pack [96]. In ab initio pseudopotential calculations some matrix elements and some integrals are efficiently evaluated in real space whereas others are efficiently evaluated in reciprocal space. The technique of fast Fourier transformation enables a numerically fast change from one representation to the other. Technical details of the computational procedures are described for example in [97, 98, 99].
3.4 Kinetic Monte Carlo approach
MD simulations can provide important insight into elementary microscopic mechanisms but typically they cannot be used for growth studies. The time between two successful diffusion events is often of the order of nanoseconds. During this time the adatoms undergo several (e.g. and more) unsuccessful attempts. Since MD calculates all these unsuccessful atomic movements explicitly, MD simulations can cover times of some picoseconds, possibly some nanoseconds and therefore are usually inappropriate to describe the spatial and temporal evolution of growth patterns, that typically develop on a time scale of seconds. Instead, the method of choice for studying the spatial and temporal development of growth is kinetic Monte Carlo (KMC) [100]. The key idea behind KMC is to describe stochastic processes (such as deposition, diffusion, desorption, etc.) on the microscopic scales by rates , that were discussed in Section 2.1 above. In KMC a process is thermally activated with a relative probability given by:
| (29) |
We define the total rate , where the sum runs over all possible processes. Deposition is accounted for in this description by the deposition rate . Equation (29) satisfies the condition of detailed balance. Using a stochastic approach the explicit calculation of unsuccessful attempts is avoided. Yet, the result of a KMC study will be the same as that of a MD simulation, provided that the underlying PES is the same. The strategy of KMC can be summarized as follows:
-
Determination of all processes that possibly could take place with the actual configuration of the system.
-
Calculation of .
-
Choose two random numbers and in the range .
-
Find the integer number for which
(30) -
Execute process .
-
Update the simulation time with
-
Go back to step .
Step ensures that a direct and unambiguous relationship between KMC time and real time is established, since the KMC algorithm effectively simulates Poisson processes.
KMC differs from the algorithm proposed by Metropolis et al. [101] that was successfully employed to determine the static properties of many-particle systems. In the Metropolis Monte Carlo scheme the probability that a new configuration is accepted is proportional to where is the difference between the total energies of the system in the new and old configuration. Such an algorithm searches for the configuration corresponding to the minimum of the total energy, and the sequence of generated configurations does not correspond to the real time evolution of the system.
KMC simulations have been used to study crystal growth of semiconductors (e.g. [102, 103, 104]) and metals (e.g. [105, 106, 107, 108]). However, most of these studies have been based on restrictive approximations. For example, the input parameters have been treated as effective parameters determined rather indirectly by fitting to experimental quantities, like intensity oscillations in helium atom scattering (HAS) measurements or reflection high energy electron diffraction (RHEED), or they were obtained from STM studies of island densities. Thus, the connection between these parameters and the microscopic nature of the processes may be somewhat uncertain. Often the correct surface structure was neglected and the simulation was done on a simple cubic lattice while the system of interest had an fcc or bcc structure. Despite these approximations such studies have provided qualitative and in some cases also quantitative insight into growth phenomena. It is desirable to carry out KMC simulations with the proper geometry and microscopically well founded parameters. This has been done for example in Refs. [109, 110, 111] where semi-empirical calculations such as the embedded atom method or effective medium theory (cf. Section 3.1) have been employed to evaluate the PES. However, the most accurate, but also most elaborate approach to obtain the PES employs DFT as described in Sections 3.2 and 3.3. Results of a KMC study performed with input from such DFT calculations are presented in Section 4.1.2.
4 RESULTS FOR FCC (111) AND FCC (100) SURFACES
We now discuss some recent DFT studies of various growth phenomena at (111) and (100) surfaces of fcc metals, in particular aluminum (Sections 4.1 and 4.3) and silver (Sections 4.2 and 4.4). Section 4.1.1 presents DFT calculations for the self-diffusion at Al (111), and these results form the basis of the ab initio KMC simulations described in Section 4.1.2. Section 4.3 summarizes the understanding of self-diffusion at Al (100), and in Section 4.4 we identify the microscopic processes on the Ag (100) surface.
Surface stress can affect diffusion and crystal growth quite substantially. Experimental investigations have been carried out for the self-diffusion at Ag (111) and at thin silver films on Pt (111) [112]. In Section 4.2.1 we present results of recent DFT calculations for these systems. Section 4.4.2 discusses the influence of surface stress on the diffusion mechanism, showing that stress can even change the mechanisms.
One goal of epitaxial growth is to achieve atomically flat and defect free surfaces of specified crystallographic orientation under convenient growth conditions, i.e., not too low deposition rates and not too high temperatures. In many cases this goal can be reached only with the use of surface contaminants that act as surfactants [113, 114]. Section 4.2.2 presents DFT results concerned with the surfactant functioning of Sb for the growth of Ag (111).
4.1 Growth at Al (111)
4.1.1 Microscopic processes
On the (111) surface of a fcc crystal there are two kinds of close packed steps, that were already discussed (see Fig. 4). Although the packing of the step-edge atoms is identical in these two steps, the coordination of the substrate atoms at the step edge is different: At the -faceted step the substrate atoms have a coordination of 11, and at the -faceted step the substrate atom coordination is 10. Thus, a small difference in the step-formation energy is expected. If lattice relaxations are negligible, the -faceted step might be slightly favored. Indeed, DFT calculations [90, 115] confirm the trend suggested by the coordination numbers: The facet is slightly favored with eV per atom over the with eV per atom. Neglecting contributions from more open steps, as these have a higher formation energy, one can now predict the equilibrium shape of islands. According to the Wulff construction in thermodynamic equilibrium the island borders have distances from the island center that are proportional to their formation energies. As a consequence the equilibrium shape of islands for Al/Al (111) should be hexagonal with the edges alternating between those with a shorter and a longer facet. The resulting ratio of the lengths is .
The activation barriers for the most important processes of self-diffusion at Al (100) are collected in Table 1. In addition we note that the calculations predict that an isolated adatom on the flat surface favors the hcp site (see Fig. 10) and that the energies of the bridge and fcc positions are almost degenerate.
| process | mechanism | (eV) | ||
|---|---|---|---|---|
| flat Al(111) | hopping | |||
| step | exchange | |||
| step | hopping | |||
| step | hopping | |||
| step | exchange | |||
| step descent | exchange | |||
| step descent | hopping | |||
| step descent | exchange | |||
| step descent | hopping |
Therefore, the diffusion path for an isolated adatom goes from one hcp site to the adjacent one through fcc and bridge positions. Since the fcc site continues the ABCABC stacking of the fcc crystal, whereas the equally threefold coordinated hcp position belongs to an ABCAC stacking, this result is somewhat unexpected. The epitaxial continuation of the crystal with adatoms occupying fcc sites is recovered when the coverage is increased ( ML).
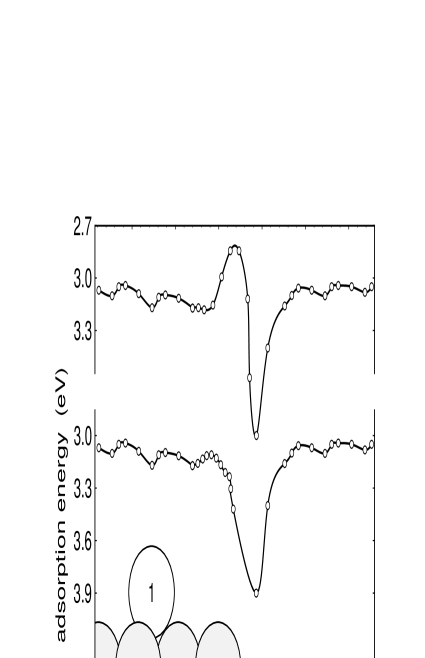
The DFT calculations also predict a long-range attraction of adatoms towards step edges for approach from the upper as well as from the lower terrace. It appears that this attraction is actuated by electronic surface states. The attraction is weak at long distances but close to the step it becomes so strong that particularly at the lower terrace an adatom will be funneled toward the step. This is clearly visible in Fig. 12 (lower curve) where the total energy along the adatom diffusion path involving the migration toward and over a step and on the flat surface is displayed for the hopping (upper curve) and the exchange (lower curve) mechanism. The attraction is present with and without relaxation of the system and thus cannot be elastic. An electrostatic origin can also be discarded, since the dipoles located at the step and of the isolated adatom have the same sign. Thus, the resulting dipole-dipole interaction is repulsive. However, the adatom and step induce localized electronic states that interact and it was concluded [90, 115] that they are responsible for the long-range attractive interaction.
Figure 12 also shows the difference between the hopping and the exchange mechanism for the diffusion across the step from the higher to the lower terrace. The upper curve is calculated for the hopping process, and the presence of an energy barrier that hinders the roll over of the adatom from the upper to the lower terrace is clearly seen. On the other hand, practically no hindrance exists for diffusion by exchange (cf. Fig. 7). The activation barrier for the exchange process for the step-down motion is very low and comparable to the diffusion barrier on the flat surface: 0.08 eV and 0.06 eV for - and -faceted steps, respectively, whereas it is 0.04 eV for diffusion on the flat surface. Thus, we predict layer-by-layer growth for Al on Al (111) for a wide range of substrate temperatures. The barriers for the exchange might hamper 2D growth only at K. However, at such a low temperature the island edges are frayed which may reduce the barriers resulting in layer-by-layer growth.
One origin for the preference of the exchange process at step edges might be the bonding character of Al. Although Al is often considered as a jellium-like metal, it is a rather covalent atom with its valence electrons (we remind that Al and As form the AlAs compound, a covalent, zincblende semiconductor). Thus, similarly as discussed by Pandey [28] for the exchange diffusion in Si bulk, and by Feibelman [13] for exchange diffusion at Al (100), we believe that this mechanism is favored by the tendency of the system to keep a low number of cut bonds along the diffusion pathway. We expect that exchange diffusion is a rather common mechanism for down movement of adatoms at step edges.
We now address the diffusion of adatoms parallel to the two close-packed steps. As will be shown in Section 4.1.2, this is of particular importance for the shapes of islands which develop during growth. The migration along the steps may take place via a hopping or an exchange mechanism. The calculations predict that along the -faceted step an adatom preferentially jumps to an adjacent site with an activation barrier of 0.32 eV, whereas along the facet diffusion by atomic exchange is preferred with activation barrier of 0.42 eV. To understand this difference we consider the positions labeled TS{100} and TS{111} in Fig. 13 that are the lowest-energy transition state of a hop along both steps.
Along the -faceted step the adatom in the transition state has three neighbors, whereas in the same position along the -faceted step the adatom has four neighbors [90]. The higher coordination suggests a lower barrier for hopping along the -faceted step. Indeed, the calculations yield a value of 0.32 eV, smaller than the value of 0.48 eV obtained for the hopping along the -faceted step. The calculated barrier for the exchange mechanism is about the same for both steps (0.42 and 0.44 eV).
4.1.2 Ab initio KMC study of growth
We now analyze typical growth conditions where kinetic processes are dominant. The detailed characterization of the energetics of diffusion processes carried out by Stumpf and Scheffler [90, 115] for Al/Al (111) and presented in the previous Section has provided several parameters for realistic KMC simulations. Among the processes listed in Table 1 we have considered the following diffusion mechanisms:
-
diffusion of a single adatom on the flat surface: = 0.04 eV;
-
exchange diffusion from upper to lower terraces: = 0.06 eV at the {100}-faceted step and = 0.08 eV at the {111}-faceted step;
-
diffusion parallel to the {100}-faceted step via hopping: = 0.32 eV;
-
diffusion parallel to the {111}-faceted step via exchange: = 0.42 eV.
The DFT calculations give that the binding energy of a dimer is 0.58 eV [90], and we therefore assume that dimers, once they are formed, are stable (). Moreover, in the lack of reliable information we assume that dimers are immobile. We note that the reported value for the self-diffusion energy barrier is rather low (0.04 eV) [90, 115] and comparable to the energy of optical phonons of Al (111) ( eV [116]). Thus, simulations at room temperature may not be reliable because the concept of single jumps between nearest neighbor sites is no more valid. A single optical phonon can furnish enough energy to an adatom for leaving its adsorption site and diffusing on the flat surface. At room temperature the level population of optical phonon is high and the adatoms have practically no saddle point and migrate freely on the flat surface. We therefore limited our study to substrate temperatures K.
We adopt periodic boundary conditions, and our rectangular simulation area is compatible with the geometry of an fcc (111) surface. The dimensions of the simulation area are 1718 2976 Å2. These dimensions are a critical parameter and it is important to ensure that the simulation area is large enough so that artificial correlations of neighboring cells do not affect the growth patterns. The mean free path of a diffusing adatom before it meets another adatom with possible formation of a nucleation center or is captured by existing islands should be much smaller than the linear dimension of the simulation cell [117]. Since is proportional to [36], we find that (with ML/s) Å for = 50 and gets as large as Å for = 250 K. We see that our cell is large enough (for the imposed deposition rate) for , whereas at higher temperatures the dimensions of the cell are too small, i.e., for the island density is influenced by the sizes of the simulation area. Nevertheless, the island shape is determined by local processes (edge diffusions) and is still meaningful.
In the KMC program two additional insights extracted from the DFT calculations are included: the attractive interaction between steps and single adatoms, and the fact that diffusion processes take place via different mechanisms (hopping or exchange). Particularly the second point plays an important role in our investigation. In several KMC simulations of epitaxial growth the attempt frequency of the diffusion rate has the same value for all the processes, and this value lies usually in the range of a typical optical phonon vibration or the Debye frequency. However, this assumption may not be right. First, processes with larger activation barriers may have a larger attempt frequency than processes with smaller energy barriers. This is a consequence of the compensation effect briefly described in Section 2.1. Moreover, processes as hopping and exchange that involve a different number of particles and different bonding configurations may also be characterized by different attempt frequencies. This has been observed [8, 118, 119, 120] for several systems (Rh, Ir, Pt) and implies that the attempt frequency for exchange diffusion can be larger by up to two orders of magnitude than that for hopping.
For Al surfaces calculations with the embedded atom method [121] showed a difference of prefactors of one order of magnitude.
The results of the ab initio KMC simulations shown in Fig. 14 are for a coverage of ML. When the growth temperature is 50 K the shape of the islands is highly irregular and indeed fractal. Adatoms which reach a step cannot leave it anymore and they cannot even diffuse along the step. Thus, at this temperature ramification takes place into random directions, and island formation can be understood in terms of the hit and stick model [17]. At = 150 K the island shapes are triangular with their sides being {100}-faceted steps. Increasing the temperature to = 200 K a transition from triangular to hexagonal shape occurs and for = 250 K the islands become triangular again. However, at this temperature they are mainly bounded by {111}-faceted steps.
To understand the island shapes in the temperature regime between 150 and 250 K we consider the mobility of the adatoms along the steps (at such temperatures the adatoms at the step edges cannot leave the steps): The lower the migration probability along a given step edge, the higher is the step roughness and the faster is the speed of advancement of this step edge. As a consequence, this step edge shortens and eventually it may even disappears. Since diffusion along the densely packed steps on the (111) surface (the {100} and {111} facets) is faster than along steps with any other orientation this criterion explains the presence of islands which are mainly bounded by {100}- or {111}-faceted steps. The same argument can be extended to the diffusion along the two close-packed steps and applied to the triangular islands at = 150 K, where the energy barrier for the diffusion along the {111} facet is larger and thus the {100}-faceted steps survive so that triangular islands with {100} sides are obtained. By considering the energy barriers we would expect only these islands, until the temperature regime for the thermal equilibrium is reached. However, as noted in Section 2.1, the diffusion rates of adatoms are not only governed by the energy barrier but also by the effective attempt frequency. For Al/Al (111) the effective attempt frequencies have not been calculated, but the analysis of Ref. [90] proposes that the exchange process should have a larger attempt frequency than the hopping process. The results displayed in Fig. 14 are obtained with s-1 for the diffusion on the flat surface, s-1 for the jump along the {100}-faceted step, and s-1 for the exchange along the {111}-faceted step. These effective attempt frequencies are the only input of the KMC not calculated explicitly by DFT, but were estimated from the theoretical PES as well as from experimental data for other systems. In Fig. 15 the edge diffusion rates along the two steps are plotted as a function of the reciprocal temperature. At lower temperatures the energy barrier dominates the diffusion rate but at = 250 K the attempt frequencies start to play a role and lead to faster diffusion along the {111} facet than along the {100} one. Thus, the latter steps disappear and only triangles with {111}-faceted sides are present. The roughly hexagonally shaped islands at = 200 K are a consequence of the equal advancement speed for the two steps at that temperature. Obviously, the temperature dependence of the growth shapes found in Fig. 14 is crucially determined by the ratio of the two diffusivities and in particular by the temperature at which the two lines of Fig. 15 cross. If the difference were only one order of magnitude, the crossing would be at a temperature that is too high ( K). The formation of fractals (Fig. 14, upper left) and of {100}-faceted step triangles would still occur. Obviously, the importance of the attempt frequencies should receive a better assessment through accurate calculations, and work in this direction is in progress.
A peculiarity of the triangular islands in Fig. 14 is that they exhibit concave sides. In order to understand this behavior we examine the evolution of the island shape for the deposition at = 250 K. The results are collected in Fig. 16. At very low coverage the islands are roughly hexagonal and upon successive deposition they evolve into a nearly triangular shape. The longer sides are formed by straight {111}-faceted step edges but short {100}-faceted edges can still be identified, at least for ML. The latter edges become rougher and progressively disappear. For ML the sides are still nearly straight, but at ML the concavities appear. The corners of the triangles seem to increase their rate of advancement during deposition. The effect can be understood on the basis of competition between adatom supply from the flat surface and mass transport along the sides. The adatom concentration field around an island exhibits the steepest gradient close to the corners, and the corners of the islands receive an increased flux of adatoms. When the sides of the islands are not too long, this additional supply of adatoms is compensated by the mass transport along the steps, i.e., the adatoms have a high probability to leave the region around the corners before the arrival of the successive adatom. For ML this scenario still seems to be true, while at ML the island edges are longer and the mass transport along the sides is not able to compensate the additional supply of particles at the corners. That means that the probability for a particle to leave the corner region and to move along the island edge before being reached by another particle decreases considerably, and the corners start to grow faster than the sides of the triangles so that the concave shape develops.
4.2 Ag (111)
4.2.1 The influence of strain on surface diffusion
Growth of one material on a different material is of particular interest for a number of technological applications. In such a heteroepitaxial system with usually different lattice constants the material to be deposited is under the influence of epitaxial strain. Growth of Ag on Pt (111) and Ag on a thin Ag film on Pt (111) has been the focus of a number of recent studies [112, 122, 123], and with a lattice mismatch of it serves as an ideal system that can provide important information about the effects of strain during growth. We will particularly discuss how strain affects the surface diffusion barrier.
Only few theoretical studies of the effect of lattice mismatch on the diffusion barrier are present in the literature. For a metallic system we are only aware of results for Ag on Ag (111) where the authors of Ref. [112] find in an EMT calculation that the diffusion barrier increases under tensile strain and decreases under compressive strain.
Here, we present first principle calculations (more details are given in Ref. [62]) where we study systematically the dependence of the diffusion barrier on the lattice constant for Ag on Ag (111) [112]. In the range of strain the DFT results exhibit a linear dependence with a slope of eV as it is illustrated in Fig. 17.
The calculated diffusion barrier for the unstrained system, meV, is in good agreement (within the error margins of the experiment and the calculations) with the scanning tunneling microscopy (STM) results of meV. The accordance between experiment and theory extends to the system Ag/Pt (111) and Ag/1ML Ag/Pt (111). These results are summarized in Table 2. In Fig. 17 the DFT-LDA results are compared to those of an EMT study [112]. The EMT results exhibit a linear dependence only for very small values of strain () and the diffusion barrier starts to decrease for values of misfit larger than .
| System | Experiment [112] | EMT [112] | DFT [62] | |||
|---|---|---|---|---|---|---|
| Ag/Pt (111) | 157 | 81 | 150 | |||
| Ag/1ML Ag/Pt (111) | 60 | 50 | 65 | |||
| Ag/Ag (111) | 97 | 67 | 81 |
Indeed, it is plausible that a decrease of the diffusion barrier occurs when the atoms are separated far enough that eventually bonds are broken. However, as our DFT-LDA results show, for Ag/Ag (111) this happens at values for the misfit that are larger than . Additionally, when comparison with experiment is possible [i.e., Ag on Ag (111), and Ag on a monolayer Ag on Pt (111)] the EMT results are off by a factor that varies from 1.2 to 2.
The DFT results in Fig. 17 were obtained with the LDA for the exchange-correlation functional and test calculations show that GGA increases the diffusion barrier by no more than . The (111)-surface is a closed packed surface with a very small surface corrugation and since LDA and GGA results on this surface do not show significant differences for the diffusion barrier (as long as the mechanism is hopping and not exchange) it is plausible to assume that both the LDA and the GGA are good approximations for the exact exchange-correlation functional. This is also true for Pt/Pt (111) [124] and Ag on Ag (100) [86]. The general trend of an increasing energy barrier for hopping diffusion with increasing lattice constant is quite plausible (for exchange diffusion see Section 4.4.2). Smaller lattice constants correspond to a reduced corrugation of the surface, and as result the atom is not bonded much stronger at the adsorption sites than at the bridge site. In contrast, when the surface is stretched the corrugation increases and the adsorption energy at the three-fold coordinated hollow sites increases. This picture will change when the strain is so large that bonds are broken and then it is expected that the hopping diffusion barrier will start to decrease again at very large tensile strain.
It is worth noting that the diffusion barrier for Ag on top of a pseudomorphic layer of Ag on Pt (111) is substantially lower than it is for Ag on Ag (111). A question that arises is whether this reduced diffusion barrier is a result of the compressive strain or should be ascribed to electronic rearrangements induced by the Pt substrate. The diffusion barrier for Ag on Ag (111) with a lattice constant that is compressed to the value of the lattice constant for Pt is meV while that for Ag on Pt (111) (also with the Pt lattice constant of 3.92 Å obtained from DFT) is meV. The agreement of these two values suggests that the reduction of the diffusion barrier for Ag on a layer of Ag on Pt (111) is mainly a strain effect and that the diffusion barrier on top of a layer of Ag is essentially independent of the substrate underneath.
Brune et al. [112] also measured the island densities of Ag on two monolayers (ML) of Ag on Pt (111) and found that the island density is much larger than it is for Ag on just one ML of Ag on Pt (111). But the reason for this increased island density is not a larger barrier for surface diffusion. The second layer of Ag on Pt (111) reconstructs in a trigonal network where domains with atoms in the fcc and hcp site alternate [125]. This reconstruction occurs either during growth with high enough adatom mobility or upon annealing and it can be concluded that this trigonal network is the equilibrium structure. The periodicity of these domains is approximately two domain boundaries for every 24 atoms. This can be understood very well with purely geometrical arguments because the lattice mismatch is and every domain boundary implies that there is half of an Ag atom less so that the domain network provides an efficient mechanism to relief epitaxial strain. The barrier to diffuse across such a domain wall appears to be rather high and domain walls act as repulsive walls so that the island density is determined by the defect density and not the barrier for self diffusion. It is not clear however why this domain network is formed only after 2 ML Ag have been deposited and not already upon completion of the first Ag layer.
To answer this question the adsorption energy of an adatom in the fcc and in the hcp site were compared by Ratsch et al. [62]. Calculations were carried out with a () and a () cell and slab thicknesses of up to 5 layers. It was found that the fcc site is energetically more favorable than the hcp site in all cases. The energy differences between the two adsorption sites for the first and second Ag layer on top of Pt (111) and Ag on Ag (111) are summarized in Table 3.
| System | (in meV) | (in meV) | ||
|---|---|---|---|---|
| cell | cell | |||
| Ag/Pt(111) | 30 | 50 | ||
| Ag/1ML Ag/Pt(111) | 0 | 5 | ||
| Ag/Ag(111) | 10 | 10 |
During deposition of the first layer the fcc site is energetically preferred compared to the hcp site, and the film growth pseudomorphically with the atoms in the fcc sites. However, after the first layer has been completed, the total energies of these two sites are almost indistinguishable so that the system is not prevented from reconstructing in the described domain network to relieve epitaxial strain.
4.2.2 The role of antimony as a surfactant
As already mentioned, Ag atoms deposited on Ag(111) form “mountains” (or “mounds”) as it has been seen by RHEED [126], x-ray reflectivity experiments [114], and STM [32, 33, 127] for a wide range of temperatures. The situation changes completely when small amounts of antimony (0.2 ML) are deposited on the surface and the growth mode becomes two dimensional [40, 127].
The natural question that arises is: What is the action of Sb? These contaminants are called surfactants, although this term may be misleading. In the original definition a surfactant should reduce the surface energy. Particularly for metallic systems, however, the contaminants rather affect the kinetics of the processes and change the growth mode.
| ()R30o | ||||||
|---|---|---|---|---|---|---|
| 4.37 | 4.49 | - | ||||
| 3.34 | 3.26 | 3.22 | ||||
| 3.45 | 3.41 | 2.71 |
In Section 2.3 we have described some possible scenarios for the action of these surfactants. Clearly, different surfactants work by different mechanisms (or a combination of them). However, as already pointed out in Section 2.3 a good surfactant has to satisfy one essential requirement: It has to stay on the surface. To investigate this crucial point, Oppo et al. [41, 128] carried out DFT-LDA calculations for the adsorption energies of Sb atoms located in different positions on Ag (111). These calculations have given important insight into the action of Sb during growth. The evaluated binding energies for Sb are collected in Table 4 for different coverages. It is clear that the substitutional site is greatly favored with respect to on-surface fcc adsorption and sublayer adsorption for all coverages considered ( = 1/4, 1/3, and 1 were considered)). Sb is thus expected to be adsorbed in substitutional sites at not too high Sb coverages and this geometry is shown in Fig. 18.
An incorporation of the contaminant into the Ag bulk can be ruled out because its energy cost is too high. The Sb atoms segregate to the surface and do not incorporate into the bulk, since its sizes are somewhat too large for a bulk vacancy, but appropriate to fit into a surface vacancy.
The DFT results clarify the energetical ranking for the adsorbed Sb atom, but the understanding of its action on the Ag atoms requires the determination of its influence on the Ag adsorption. Two possible locations of the Ag adatom on the substitutional Sb-covered surface are considered: a near site and a far site, depending on whether Ag and Sb are nearest neighbors or not. These two sites are labeled 3 and 2 in Fig. 18, and their calculated adsorption energies are 1.99 eV/atom and 2.02 eV/atom, respectively. The Ag adatom prefers energetically to sit on the clean portion of the surface (clean site with eV/atom), whereas close to an incorporated Sb atom it favors the far site. Thus, Ag adatoms avoid the vicinity of the Sb atoms.
A schematic summary of the action of Sb during growth of Ag on Ag (111) is given in Fig. 19.
The substitutional antimony atoms act as repulsive centers for the silver adatoms (upper panel), whose mean free path is reduced by the presence of the contaminants (middle panel). Thus, small-sized Ag islands appear on the surface with an increased density. Moreover, the antimony atoms are expected to affect the form of the Ag islands, and the islands will grow in directions where they can avoid to get close to Sb centers. Finally, just before the Ag-Sb surface alloy layer is covered by the newly deposited Ag layer, the Sb atoms find themselves in the disfavored subsurface configuration (see, for instance, Table 4), and segregate to the new surface layer (Fig. 19, lower panel). The alloy layer is now reestablished and the process can start again. The combination of all these features yields layer-by-layer growth. It is interesting to note that according to Eq. (9) only an increase of island density by a factor of 2 is necessary to induce two dimensional growth. Vrijmoeth et al. [127] report a much higher increase of the island density (a factor of 6) of the annealed surface in the presence of Sb.
A recent theoretical study [129] where a rate-equation analysis has been combined with Monte Carlo simulations has confirmed the main idea proposed in the work of Oppo et al. [41, 128]. The main role of the Sb repulsive network is to reduce the mean free path of the Ag adatoms, and as a result the island density is enhanced. The changed character of diffusion leads to new scaling relations in which the island density shows a strong dependence on the impurity concentration.
4.3 Microscopic processes at Al (100)
Self-diffusion at flat regions of close-packed surfaces is typically considered to proceed by series of hops between adjacent equilibrium adsorption sites. For a fcc (100) surface an adatom in a fourfold hollow site moves over the twofold bridge site to a neighboring fourfold hollow site [see Fig. 5(a)]. After some time an adatom has visited most fourfold hollow surface sites, and the visited sites form a () pattern. An alternative mechanism for surface diffusion is atomic exchange where the adatom moves by displacing a neighboring surface atom. On a fcc (100) surface the exchange process occurs along the [010 ] and [ 001 ] directions. The transition state [see Fig. 5(b)] may be described as a dimer, consisting of the adatom and the lift-up surface atom located above a surface vacancy. Subsequently the displaced surface atom becomes a new adatom in a next-nearest-neighbor fourfold site. When this diffusion mechanism is active, an adatom visits only every second fourfold hollow site at the surface, and the visited sites form a c() pattern. This difference in the patterns of visited sites represents clear evidence of the active mechanism. Indeed, in this way self-diffusion by exchange has been experimentally observed by Kellogg and Feibelman for Pt (100) [11] and by Chen and Tsong for Ir (100) [12].
A theoretical study of exchange diffusion was performed by Feibelman [13] for Al (100). Feibelman performed DFT calculations and predicted a rather high energy barrier for hopping ( eV) in conflict with experimental estimates. Inspired by ideas of Pandey [28] Feibelman realized that at surfaces it is more appropriate to think of self-diffusion in terms of making and breaking of chemical bonds rather than in terms of a hard sphere rolling over a bumpy plane. In fact, his calculations of the exchange mechanism show that its barrier is substantially smaller (by eV) than that of the hopping process. Thus, he predicted that for Al (100) self-diffusion proceeds by atomic exchange. The process is caused by the noticeable covalency of aluminum, which can form directional bonds (by hybridization) at certain atomic geometries. In the transition state of exchange diffusion at Al (100) [see Fig. 5(b)] each atom of the dimer that sits over the vacant site forms three chemical bonds, two with surface Al atoms and one with the other atom of the dimer. Inspection of the electron density [13] revealed the formation of directional bonds and that the coordination of the surface atoms at the transition state can be described as three-fold. In other words: At the transition state of hopping diffusion the adatom is two-fold coordinated, while at the transition state of the exchange diffusion it is three-fold coordinated. For a group III atom it thus appears plausible that the latter transition state has a lower energy. We note in passing that recent embedded atom calculations have questioned the importance of the exchange mechanism at Al (100) [121], but DFT calculations of Stumpf and Scheffler [90] fully confirmed the scenario proposed by Feibelman.
These studies are predictions with only indirect experimental support, namely the observation that the diffusion barrier is low. Only for two other fcc (100) surfaces exchange diffusion has been identified [Pt (100) and Ir (100)]. Apparently it does not occur at other fcc (100) transition-metal surfaces. Recent calculations have shown that the mechanism that stabilized the exchange diffusion at the late transition metals is significantly different from the covalency mechanism at Al (100). In Section 4.4.2 we will summarize these results.
4.4 Ag (100)
4.4.1 Microscopic processes
For silver it is known that growth on the (111) surface is three dimensional because a noticeable step-edge barrier exists that has been estimated by various authors using STM [32, 33] to be between 0.1 and 0.15 eV. This additional step-edge barrier explains why the growth of silver perpendicular to the (111) surface proceeds in a three-dimensional mode.
In order to analyze why the growth of the Ag (100) surface is qualitatively different (two dimensional) Yu and Scheffler [86] performed DFT calculations within the LDA and the GGA, and the results are listed in Table 5. In contrast to the above discussion for Al (100) self-diffusion on Ag (100) proceeds by hopping. Exchange diffusion has an energy barrier which is about 0.3 eV higher.
| process | mechanism | (eV) | ||
|---|---|---|---|---|
| flat Ag(100) | hopping | 0.52 (0.45) | ||
| flat Ag(100) | exchange | 0.93 (0.73) | ||
| step | hopping | 0.30 (0.27) | ||
| step descent. | exchange | 0.52 (0.45) | ||
| step descent. | hopping | 0.70 (0.55) |
However, according to the DFT calculations diffusion across a descending close-packed step takes place via the exchange mechanism (cf. Table 5). The calculated activation energy for the step-down motion by exchange is (within the numerical accuracy) identical to that of the hopping diffusion at the terrace. Figure 20 shows the total energy curves along the diffusion paths for hopping and exchange diffusion.
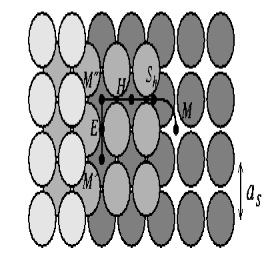
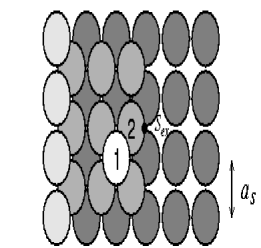
The low energy barrier of the exchange diffusion can be understood by considering the geometries along the reaction pathway: Atom 2 moves out of the step edge and the process is energetically stabilized because adatom 1 keeps in contact with atom 2 and finally occupies the original site of atom 2 (Fig. 20, right side). The transition state for the exchange process is near the bridge site formed by two step-bottom atoms on the lower terrace ( in Fig. 20, right side). Inspection of the geometry at (see Ref. [86] for details) shows that the local coordination of atoms 1 and 2 remains high. At each of theses atoms is five-fold coordinated. This finding that there is no additional energy barrier provides a natural explanation for the smooth 2-D growth of Ag (100). By analyzing the STM images of Ag(100) during deposition Zhang et al. [130] gave an estimate of eV for the additional step-edge barrier in good agreement with the DFT results. We also note that the coordination number arguments employed above are valid in general, thus we expect that our finding that step-down diffusion at Ag (100) proceeds by the exchange mechanism also applies to other noble and other fcc (100) transition-metal surfaces.
Yu and Scheffler also studied the diffusion parallel to step edges and the step formation energies [14]. They find that diffusion parallel to step edges is faster than that at flat surface regions and that the closest-packed step, the step dominates. Thus, it is predicted that step edges are rather straight and that in equilibrium islands have an approximately square shape. To be precise, the size is that of an octagon with long and shorter steps. From the step formation energy the length ratio was determined to be 10:3.
4.4.2 The influence of strain on surface diffusion
As noted above, self-diffusion on fcc (100) surfaces may proceed by the hopping process (as for Ag) or by exchange (Pt, Ir, and probably also Al). Yu and Scheffler [14] recently predicted that exchange diffusion should occur on Au (100) and strained Ag (100), and two mechanisms were emphasized that stabilize the exchange over the hopping mechanism: the tensile surface stress, and the correlation of bond strength and local coordination.
For Au (100) the rather low energy of the exchange-diffusion transition state ( eV, eV) could be correlated with its geometry (compare Fig. 5(b)): The dimer is only 1.29 Å above the surface layer, which is 37 % closer to the center of the top layer than the inter-layer spacing in the bulk. Thus, the two atoms of the dimer interact with the atoms of the top layer of the substrate but get rather close to the second layer. In other words, the surface likes to attain closer packing which reflects its noticeable tensile stress [131]. Indeed, the surface stress of the late metals is significantly higher than that of their and isoelectronic elements. The difference has been traced back to relativistic effects [131], which play a noticeable role for the heavier metals: The relativistic effects give rise to a contraction and energy lowering of -states, and as a consequence, the -band moves closer to a Fermi energy [131]. Indeed, a relativistic treatment is most important in order to attain a good description of structural and elastic properties of metals, while it is not important for the metals. Thus, while the significant tensile surface stress of Au (100) pulls the dimer of the exchange transition state “into” the surface, it lowers the energy of the transition state, and enables exchange diffusion. The surface stress at Ag (100) is too weak to have a significant effect.
With respect to the stress a stretched silver film gets more gold-like, and therefore the two diffusion mechanisms for a strained silver slab were analyzed in detail. When the system is under tensile strain the energy barrier for the exchange diffusion increases, while the barrier for the hopping diffusion decreases. For hopping diffusion the trend can be understood as follows: Smaller lattice constants correspond to a reduced corrugation of the surface potential, and thus diffusion energy barriers are reduced [62, 112]. In contrast, for a stretched surface the corrugation increases and the adsorption energy at the four-fold coordinated hollow sites increases. The latter reflects the wish to reduce (at least locally) the strain induced surface stress. The hopping-diffusion transition state is less affected by the strain than the adsorption site. For exchange diffusion this is just the opposite. Here the transition-state geometry reacts particularly strongly to the tensile stress, and locally the tensile stress is reduced by the very close approach of the dimer [Fig. 5(b)]. Thus, it is predicted that for pseudomorphic Ag films (with increased parallel lattice constant) self-diffusion should get noticeably affected by the exchange mechanism. The results of this study strongly suggest that tensile surface stress (to be precize, the excess surface stress, i.e. the strain derivative of the surface energy) is the main actuator for the exchange diffusion on fcc (100) surfaces [14].
References
- [1] M. Volmer and J. Estermann, Z. Phys. 7, 13 (1921).
- [2] I. Langmuir and J.B. Taylor, Phys. Rev. 40, 463 (1932).
- [3] W.K. Burton, N. Cabrera, and F.C. Frank, Philos. Trans. R. Soc. London Ser. a 243, 299 (1951).
- [4] E. Bauer, Z. Kristallogr. 110, 372 (1958).
- [5] J.A. Venables, G.D.T. Spiller, and M. Hanbücken, Rep. Prog. Phys. 47, 399 (1984).
- [6] J.A. Venables, Chapter 1 of this book.
- [7] A.K. Myers-Beaghton and D.D. Vvedensky, Phys. Rev. A 44, 2457 (1991).
- [8] D.W. Bassett and P.R. Webber, Surf. Sci. 70, 520 (1978).
- [9] J.D. Wrigley and G. Ehrlich, Phys. Rev. Lett. 44, 661 (1978).
- [10] R.T. Tung and W.R. Graham, Surf. Sci. 97, 73 (1980).
- [11] G.L. Kellog and P.J. Feibelman, Phys. Rev. Lett. 64, 3143 (1990).
- [12] C. Chen and T.T. Tsong, Phys. Rev. Lett. 64, 3147 (1990).
- [13] P.J. Feibelman, Phys. Rev. Lett. 65, 729 (1990).
- [14] B.D. Yu and M. Scheffler, submitted for publication.
- [15] H. Bethge, in Kinetics of Ordering and Growth at Surfaces, ed. M.G. Lagally (Plenum Press, New York, 1990), p. 125.
- [16] J.-M. Wen, S.-L. Chang, J.W. Burnett, J.W. Evans, and P.A. Thiel, Phys. Rev. Lett. 73, 2591 (1994).
- [17] T.A. Witten and L.M. Sander, Phys. Rev. Lett. 47, 1400 (1981); Phys. Rev. B 27, 5686 (1983).
- [18] T. Michely, M. Hohage, M. Bott, and G. Comsa, Phys. Rev. Lett. 70, 3943 (1993).
- [19] S. Glasston, K.J Laidler, and H. Eyring, The Theory of Rate Processes, (McGraw-Hill, New York, 1941).
- [20] G.H. Vineyard, J. Phys. Chem. Solids 3, 121 (1957).
- [21] G. Wahnström, in Interaction of Atoms and Molecules with Solid Surfaces, eds. V. Bortolani, N.H. March, and M.P. Tosi (Plenum Press, New York and London, 1990), p. 529.
- [22] R. Gomer, Rep. Prog. Phys. 53, 917 (1990).
- [23] G. Boisvert, L.J. Lewis, and A. Yelon, Phys. Rev. Lett. 75, 469 (1995).
- [24] A. Kley and M. Scheffler, in The Physics of Semiconductors, Eds. M. Scheffler and R. Zimmermann (World Scientific, Singapore, 1996), 1031.
- [25] G. Ehrlich, Scanning Micr. 4, 829 (1990).
- [26] D.C. Senft and G. Ehrlich, Phys. Rev. Lett. 74, 294 (1995).
- [27] R. Ferrando, R. Spadaccini, and G.E. Tommei, Surf. Sci. 265, 273 (1992); Phys. Rev. E 48, 2437 (1993).
- [28] K.C. Pandey, Phys. Rev. Lett. 57, 2287 (1986).
- [29] M. Hohage, T. Michely, and G. Comsa, Surf. Sci. 337, 249 (1995).
- [30] G. Ehrlich and F.G. Hudda, J. Chem. Phys. 44, 1039 (1966).
- [31] R.L. Schwoebel and E.J. Shipsey, J. Appl. Phys. 37, 3682 (1966).
- [32] J.A. Meyer, J. Vrijmoeth, H.A. van der Vegt, E. Vlieg, and R.J. Behm, Phys. Rev. B 51, 14790 (1995).
- [33] K. Bromann, H. Brune, H. Röder and K. Kern, Phys. Rev. Lett. 75, 677 (1995).
- [34] P. Šmilauer and S. Harris, Phys. Rev. B 51, 14798 (1995).
- [35] G.S. Bales and D.C. Chrzan, Phys. Rev. B 50, 6057 (1994).
- [36] S. Stoyanov and D. Kashchiev, in: Vol. 7 of Current Topics in Materials Science, Ed. E. Kaldis (North-Holland, Amsterdam, 1981), p. 69.
- [37] C. Ratsch, A. Zangwill, P. Šmilauer, and D.D. Vvedensky, Phys. Rev. Lett. 72, 3194 (1994).
- [38] C. Ratsch, P. Šmilauer, A. Zangwill, and D.D. Vvedensky, Surf. Sci. 329, L599 (1995).
- [39] S. Stoyanov and I. Markov, Surf. Sci. 116, 313 (1982).
- [40] J. Tersoff, A.W. Denier van der Gon, and R.M. Tromp, Phys. Rev. Lett. 72, 266 (1994).
- [41] M. Scheffler, V. Fiorentini, and S. Oppo, in Surface Science: Principles and Current Applications, eds. R. J. MacDonald, E. C. Taglauer, K. R. Wandelt, (Springer, Berlin 1996), p. 219.
- [42] R. Kunkel, B. Poelsema, L.K. Verheij, and G. Comsa, Phys. Rev. Lett. 65, 733 (1990)
- [43] G. Rosenfeld, R. Servaty, C. Teichert, B. Poelsema, and G. Comsa, Phys. Rev. Lett. 71, 895 (1993).
- [44] S. Esch, M. Hohage, T. Michely, and G. Comsa, Phys. Rev. Lett. 72, 518 (1994).
- [45] H.A. van der Vegt, M. Breeman, S. Ferrer, V.H. Etgens, X. Torrelles, P. Fajardo, and E. Vlieg, Phys. Rev. B 51, 14806 (1995).
- [46] I. Markov, Phys. Rev. B 50, 11271 (1994).
- [47] Z. Zhang and M.G. Lagally, Phys. Rev. Lett. 72, 693 (1994).l
- [48] N. Memmel and E. Bertel, Phys. Rev. Lett. 75, 485 (1995).
- [49] M.S. Daw and M.I. Baskes, Phys. Rev. Lett. 50, 1285 (1983).
- [50] A.F. Voter, in Intermetallic Compounds, vol. 1, eds. J.H. Westbrook and R.L. Fleischer (John Wiley and Sons Ltd., 1994), p. 77.
- [51] J.K. Nørskov and N.D. Lang, Phys. Rev. B 21, 2131 (1980).
- [52] M.J. Stott and E. Zaremba, Phys. Rev. B 22, 1564 (1980).
- [53] K.W. Jacobsen, J.K. Nørskov, and M.J. Puska, Phys. Rev. B 35, 7423 (1987).
- [54] J.K. Nørskov, Report on Progress in Physics 53, 1253 (1990).
- [55] M.W. Finnis and J.E. Sinclair, Philos. Mag. A 50, 45 (1984); Philos. Mag. A53, 161 (1986).
- [56] F. Cyrot-Lackmann, J. Phys. Chem. Solids 29, 1235 (1968); F. Ducastelle and F. Cyrot-Lackmann, J. Phys. Chem. Solids 32, 285 (1971).
- [57] F. Ercolessi, E. Tosatti, and M. Parrinello, Phys. Rev. Lett. 57, 719 (1986); Surf. Sci. 177, 314 (1986).
- [58] I.J. Robertson, M.C. Payne, and V. Heine, Europhys. Lett. 15, 301 (1991); Phys. Rev. Lett. 70, 1944 (1993).
- [59] M. Methfessel, D. Hennig, and M. Scheffler, Phys. Rev. B 46, 4816 (1992); Appl. Phys. A 55, 442 (1992).
- [60] O.B. Christensen and K.W. Jacobsen, Phys. Rev. B 45, 6893 (1992).
- [61] P.J. Feibelman, Surf. Sci. 313, L801 (1994).
- [62] C. Ratsch, A.P. Seitsonen, and M. Scheffler, Phys. Rev. B 55 (1997).
- [63] P. Hohenberg and W. Kohn, Phys. Rev. 136, B864 (1964).
- [64] M. Levy, Proc. Nat. Acad. Sci. (USA) 76, 6062 (1979); Phys. Rev. A 26, 1200 (1982).
- [65] We limit our discussion in this chapter to non-magnetic systems. However, it is straightforward to generalize DFT and to write the total-energy functional in terms of the electron density and the magnetization density (see for example R.M. Dreizler and E.K.U. Gross, Density Functional Theory (Springer Verlag, Berlin, Heidelberg, New York, 1990)).
- [66] All equations are noted in Hartree atomic units, i.e. the unit of length is 1 Bohr = 0.5292 Å, the unit of energy is 1 Hartree = 27.2116 eV, and .
- [67] W. Kohn and L.J. Sham, Phys. Rev. 140, A1133 (1965).
- [68] R. Haydock and V. Heine, to appear in Comments in Condensed Matter Physics.
- [69] R.O. Jones and O. Gunnarson, Rev. Mod. Phys. 61, 689 (1989).
- [70] J. Harris and R.O. Jones, J. Phys. F 4, 1170 (1974).
- [71] O. Gunnarson and B.I. Lundqvist, Phys. Rev. B 13, 4274 (1976).
- [72] E.P. Wigner, Phys. Rev. 46, 1002 (1934).
- [73] M. Gell-Mann and A.K. Brueckner, Phys. Rev. 106, 364 (1957).
- [74] D.M. Ceperly and B.J. Alder, Phys. Rev. Lett. 45, 566 (1980).
- [75] J.P. Perdew and Y. Wang, Phys. Rev. B 45, 13244 (1992); J.P. Perdew, in Electronic Structure of Solids ’91, eds. P. Ziesche and H. Eschrig (Akademie Verlag, Berlin, 1991), p. 11; J.P. Perdew, J.A. Chevary, S.H. Vosko, K.A. Jackson, M.R. Pederson, D.J. Singh, and C. Fiolhais, Phys. Rev. B 46, 6671 (1992).
- [76] J.P. Perdew and Y. Wang, Phys. Rev. B 33, 8800 (1986); J.P. Perdew, Phys. Rev. B 33, 8822 (1986); ibid. 34, 7406(E) (1986).
- [77] Y. Wang and J.P. Perdew, Phys. Rev. B 43, 8911 (1991); J.P. Perdew, Physica B 172, 1 (1991); J.P. Perdew, K. Burke, Y. Wang, submitted to Phys. Rev. B.
- [78] A.D. Becke, Phys. Rev. A 38, 3098 (1988); J. Chem. Phys. 98, 3892 (1993).
- [79] C. Lee, W. Yang, and R.G. Parr, Phys. Rev. B 37, 785 (1988).
- [80] W. Kohn, A.D. Becke, R.G. Parr, J. Chem. Phys. 100, 12974 (1996).
- [81] M. Ernzerhof, J.P. Perdew, and K. Burke, in Topics in Current Chemistry 180 (Springer Verlag, Berlin, Heidelberg, New York, 1996), 1.
- [82] L. Mitas and R.M. Martin, Phys. Rev. Lett. 72, 2438 (1994); J.C. Grossman, L. Mitas, and K. Raghavachari, Phys. Rev. Lett. 75, 3870 (1995).
- [83] C. Fillipi, X. Gonze, and C.J. Umrigar, to be published in Recent Developments and Applications of Density Functional Theory, ed. J.M. Seminario (Elsevier, Amsterdam, 1996).
- [84] B. Hammer, M. Scheffler, K.W. Jacobsen, and J.K. Nørskov, Phys. Rev. Lett. 73, 1400 (1994).
- [85] B. Hammer and M. Scheffler, Phys. Rev. Lett. 74, 3487 (1995).
- [86] B.D. Yu and M. Scheffler, Phys. Rev. Lett. 77, 1095 (1996); unpublished.
- [87] A.R. Williams, P.J. Feibelman, and N.D. Lang, Phys. Rev. B 26, 5433 (1982); P.J. Feibelman, Phys. Rev. B 35, 2626 (1987).
- [88] J. Bormet, J. Neugebauer, and M. Scheffler, Phys. Rev. B 49, 17242 (1994); M. Scheffler, C. Droste, A. Fleszar, F. Maca, G. Wachutka, and G. Barzel, Physica 172, 143 (1991).
- [89] A review on the cluster method is given in: J.L. Witten and H. Yang, Surf. Sci. Rep. 24, 55 (1996).
- [90] R. Stumpf and M. Scheffler, Phys. Rev. B 53, 4958 (1996).
- [91] J. Ihm, A. Zunger, and M.L. Cohen, J. Phys. C 12, 4409 (1979).
- [92] G.B. Bachelet, D.R. Hamann, and M. Schlüter, Phys. Rev. B 26, 4199 (1982); D.R. Hamann, M. Schlüter, and C. Chiang, Phys. Rev. Lett. 43, 1494 (1979); H.S. Greenside and M. Schlüter, Phys. Rev. B 28, 535 (1983); D.R. Hamann, Phys. Rev. B 40, 2980 (1989).
- [93] N. Troullier and J.L. Martins, Phys. Rev. B 43, 1993 (1991).
- [94] X. Gonze, R. Stumpf, and M. Scheffler, Phys. Rev. B 44, 8503 (1991); R. Stumpf, X. Gonze, and M. Scheffler, Research report of the Fritz-Haber-Institut (1990).
- [95] D. Vanderbilt, Phys. Rev. B 41, 7892 (1990).
- [96] H.J. Monkhorst and J.D. Pack, Phys. Rev. B 13, 5188 (1976).
- [97] M.C. Payne, M.P. Teter, D.C. Allan, T.A. Arias, and D.J. Joannopoulos, Rev. Mod. Phys. 64, 1045 (1992).
- [98] B. Kohler, S. Wilke, M. Scheffler, R. Kouba, and C. Ambrosch-Draxl, Comput. Phys. Commun. 94, 31-48 (1996).
- [99] R. Stumpf and M. Scheffler, Comput. Phys. Commun. 79, 447 (1994), M. Bockstedte, A. Kley, J. Neugebauer, and M. Scheffler, to be published.
- [100] H.C. Kang and W.H. Weinberg, J. Chem. Phys. 90, 2824 (1989); K.A. Fichthorn and W.H. Weinberg, J. Chem. Phys. 95, 1090 (1991); H.C. Kang and W.H. Weinberg, Acc. Chem. Res. 25, 253 (1992).
- [101] M. Metropolis, A.W. Rosenbluth, M.N. Rosenbluth, A.N. Teller, and E. Teller, J. Chem. Phys. 21, 1087 (1953).
- [102] A. Madhukar, Surf. Sci. 132, 344 (1983); A. Madhukar and S.V. Ghaisas, Appl. Phys. Lett. 47, 247 (1985); S.V. Ghaisas and A. Madhukar, J. Vac. Sci. Technol. B 3, 540 (1985); S.V. Ghaisas and A. Madhukar, Phys. Rev. Lett. 56, 1066 (1986).
- [103] S. Clarke and D.D. Vvedensky, Phys. Rev. Lett. 58, 2235 (1987); Phys. Rev. B 36, 9312 (1987); Phys. Rev. B 37, 6559 (1988); J. Appl. Phys. 63, 2272 (1988); S. Clarke, M.R. Wilby, D.D. Vvedensky, T. Kawamura, K. Miki, and H. Tokumoto, Phys. Rev. B 41, 10198 (1990); T. Shitara, D.D. Vvedensky, M.R. Wilby, J. Zhang, J.H. Neave, and B.A. Joyce, Phys. Rev. B 46, 6815 (1992); Phys. Rev. B 46, 6825 (1992).
- [104] H. Metiu, Y.-T. Lu, and Z. Zhang, Science 255, 1088 (1992).
- [105] M.C. Bartelt and J.W. Evans, Phys. Rev. Lett. 75, 4250 (1995);
- [106] Z. Zhang, X. Chen, and M. Lagally, Phys. Rev. Lett. 73, 1829 (1994).
- [107] J.G. Amar and F. Family, Phys. Rev. Lett. 74, 2066 (1995).
- [108] S.V. Khare, N.C. Bartelt, and T.L. Einstein, Phys. Rev. Lett. 75, 2148 (1995).
- [109] S. Liu, Z. Zhang, G. Comsa, and H. Metiu, Phys. Rev. Lett. 71, 2967 (1993).
- [110] J. Jacobsen, K.W. Jacobsen, P. Stolze, and J.K. Nørskov, Phys. Rev. Lett. 74, 2295 (1995); J. Jacobsen, K.W. Jacobsen, and J.K. Nørskov, Surf. Sci. 359, 37 (1996).
- [111] Z.-P. Shi, Z. Zhang, A.K. Swan, and J.F. Wendelken, Phys. Rev. Lett. 76, 4927 (1996).
- [112] H. Brune, K. Bromann, H. Röder, K. Kern, J. Jacobsen, P. Stolze, K.W. Jacobsen, J. Nørskov, Phys. Rev. B 52, R14380 (1995).
- [113] C.W. Snyder and B.G. Orr, Phys. Rev. Lett. 70, 1030 (1993); N. Grandjean and J. Massies, ibid. 1031 (1993), and references therein.
- [114] H.A. van der Vegt, H.M. van Pinxteren, M. Lohmeier, E. Vlieg, and J.M.C. Thornton, Phys. Rev. Lett. 68, 3335 (1992).
- [115] R. Stumpf and M. Scheffler, Phys. Rev. Lett. 72, 254 (1994); ibid. 73, 508 (1995)(E).
- [116] J.A. Gaspar and A.G. Eguiluz, Phys. Rev. B 40, 11976 (1989).
- [117] M. Schröder and D.E. Wolf, Phys. Rev. Lett. 74, 2062 (1995).
- [118] G. Ayrault and G. Ehrlich, J. Chem. Phys. 60, 281 (1974).
- [119] S.C. Wang and G. Ehrlich, Phys. Rev. Lett. 62, 2297 (1989); Surf. Sci. 239, 301 (1990).
- [120] G.L. Kellog, Surf. Sci. 246, 31 (1991).
- [121] C.L. Liu, J.M. Cohen, J.B. Adams, and A.F. Voter, Surf. Sci. 253, 334 (1991).
- [122] H. Röder, E. Hahn, H. Brune, J.-P. Bucher, and K. Kern, Nature 366, 141 (1993).
- [123] H. Brune, C. Romalnczyk, H. Röder, and K. Kern, Nature 369, 469 (1994).
- [124] G. Boisvert, L. Lewis, and M. Scheffler, in preparation.
- [125] H. Brune, H. Röder, C. Boragno, and K. Kern, Phys. Rev. B 49, 2997 (1994).
- [126] Y. Suzuki, H. Kikuchi, and N. Koshizuka, Jap. J. Appl. Phys. 27, L1175 (1988).
- [127] J. Vrijmoeth, H.A. van der Vegt, J.A. Meyer, E. Vlieg, and R.J. Behm, Phys. Rev. Lett. 72, 3843 (1994).
- [128] S. Oppo, V. Fiorentini, and M. Scheffler, Phys. Rev. Lett. 71, 2437 (1993); MRS Proc. 314, 111 (1994); V. Fiorentini, S. Oppo, and M. Scheffler, Appl. Phys. A 60, 399 (1995).
- [129] S. Liu, L. Bönig, J. Detch, and H. Metiu, Phys. Rev. Lett. 74, 4495 (1995).
- [130] C.-M. Zhang, M.C. Bartelt, J.-M. Wen, C.J. Jenks, J.W. Evans, and P.A. Thiel, J. Crystal Growth, in press.
- [131] V. Fiorentini, M. Methfessel, and M. Scheffler, Phys. Rev. Lett. 71, 1051 (1993).