[
Pseudogaps and their Interplay with Magnetic Excitations
in the
doped 2D Hubbard Model
Abstract
On the basis of Quantum Monte Carlo simulations of the two-dimensional Hubbard model which cover the doping range from the under- to the over-doped regime, we find that the single-particle spectral weight qualitatively reproduces both the momentum (–symmetry) and doping dependence of the pseudogap as found in photoemission experiments. The drastic doping dependence of the spin response which is sharp in both and in the under-doped regime but broad and structureless otherwise, identifies remnants of the antiferromagnetic order as the driving mechanism behind the pseudogap and its evolution with doping.
pacs:
PACS numbers: 74.20.-z,74.72.-h,75.50.Ee,79.60.Bm]
Exciting progress in the microscopic understanding of high- superconductors has recently come from the observation of a normal-state pseudogap of order of the exchange energy [2] and a lower energy excitation gap of the order of the superconducting gap [2, 3, 4, 5, 6]. Angle-resolved photoemission spectroscopy (ARPES) demonstrated that both high- and low-energy gaps are consistent with –symmetry [2, 3, 4, 5]. In addition, both gaps have a more or less identical doping dependence, which may be a key observation to unlocking the mystery of the cuprates: just below optimal hole concentration, the centroids in the spectral weight near move to higher binding energy, and a portion of the large Fermi surface seems to disappear. These findings have been interpreted as the opening of a pseudogap with maximal energy near [2]. Simultaneously, a normal-state gap with energy , inferred from the leading edge in , opens up in this under-doped regime. Both of these gaps vanish in the over-doped regime, and the superconducting gap also rapidly decreases [6]. This empirical correlation between the disappearance of the order pseudogap and the decrease of superconducting pairing strength suggests that the high-energy features at are closely related to the pairing interaction [7].
In this letter, we address the microscopic mechanism behind the opening of this pseudogap and its evolution from under-doped to over-doped regimes. We present Quantum Monte Carlo (QMC) simulation results on the two-dimensional Hubbard model with on-site interaction which demonstrate that the single-particle spectral weight reproduces the most salient ARPES features as function of doping. In particular, the QMC data reproduce the momentum (–symmetry) and doping dependence of the pseudogap.
Earlier finite-temperature QMC work on the Hubbard model [8, 9] has produced results showing a quasi-particle-like band with a dispersion below the Fermi level that is essentially unaffected by doping. On the other hand, groundstate exact diagonalizations [10, 11] of the two-dimensional model for small clusters around optimal doping find a signal in the spectral weight corresponding to an insulator-like “shadow” structure; at larger doping this signal vanishes. We present in this work first data of the spectral weight obtained by Maximum-Entropy techniques for previously inaccessible temperatures (), showing that if the temperature in the dynamical QMC simulation is lowered below a threshold temperature in the under-doped regime the quasi-particle band is substantially deformed, resulting in the opening of a pseudogap.
Our results provide numerical evidence of earlier theoretical conjectures that the deformation and the pseudogap are intimately related to antiferromagnetic spin fluctuations [12, 13, 14]. This is demonstrated by studies of the two-particle excitation spectrum over a wide range of dopings from under-doped to over-doped. They reveal that it is the strongly doping-dependent spin response and not the essentially doping-independent charge response which tracks the doping dependence of the pseudogap. The spin response, , displays a sharp structure in at wave-vector and at energy . Not only near half-filling but also up to optimal doping the spectral weight is distributed around an energy dispersion which still closely follows the spin-wave dispersion , where is calculated within the spin-density-wave approximation. For temperatures , the antiferromagnetic correlation length becomes larger than the lattice spacing and, as a consequence, the quasi-particle is strongly dressed by spin fluctuations. As soon as the system enters the over-doped regime, the spin response is no longer sharply peaked near and . It spreads in energy by an order of magnitude (the scale changes from to ), and is accompanied by a similar change of the scale of the bandwidth for single-particle excitations. Thus it is this unique doping dependence of the magnetic excitations which establish the pseudogap as being due to antiferromagnetic spin fluctuations.
The single-band two-dimensional Hubbard model has the standard Hamiltonian
| (1) | |||
| (2) |
on a square lattice, where is the nearest-neighbor hopping, destroys a particle of spin on site , and . The chemical potential sets the filling . The spectral weight is inferred from high-quality [15] QMC data by applying state-of-the-art “Maximum-Entropy” techniques [16]. This method has previously been used to resolve a quasi-particle-like dispersive band of width at half-filling and to follow its evolution from the insulator to the metal [8].
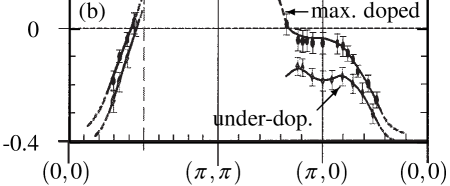
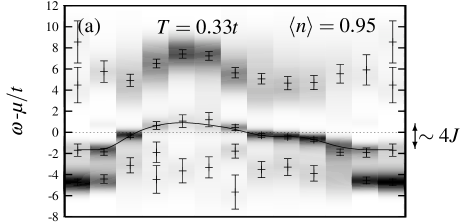
In Fig. 1(a) we compare the QMC results for the single-particle spectral weight for the under-doped ( and ) and maximally doped () regimes with the ARPES data from Ref. [2] in Fig. 1(b). The theoretical results were obtained for temperatures of and , on-site Coulomb repulsion and lattices. To facilitate detailed comparison with Fig. 1(b) of D. S. Marshall, Z.-X. Shen et al. [2], we use in Fig. 1(a) the same vs “band structure” plot with all spectra referring to the same chemical potential .
In accordance with the ARPES data, we find a dramatic change in the electronic structure near with doping. In the under-doped ( and ) regime, the features near move to lower binding energy as doping is increased. At about doping [9] (full circle in Fig. 1(a)) the pseudogap vanishes.
In addition, a portion of the large Fermi surface, which is closed around at (i.e. has Fermi level crossings between and as well as between and ), seems to disappear at the lower temperature, . This is indicated in Fig. 1(a) by the downturn of the quasi-particle-like band between and . In the experiment, this behavior in the under-doped regime has been interpreted as the opening of a pseudogap in the underlying Fermi surface near the to line [2]. The momentum dependence of the pseudogap is also in agreement with experiment in that its largest value, which is of the order of the exchange coupling , occurs near and in that it essentially vanishes along the to line. This behavior is consistent with –symmetry. At doping we obtain a Fermi surface crossing near (full circle in Fig. 1(a)) independent of the two chosen temperatures. Thus, at optimal hole doping the Fermi surface is large, consistent with both ARPES [2, 3, 4, 5] and earlier QMC calculations [9].

In the QMC simulation, the opening of a pseudogap in the under-doped regime shows up below a “crossover” temperature . To illustrate this crossover, we consider in Fig. 2(a) - 2(b) the role played by temperature and its influence on the spectral weight distribution in more detail. We observe two general features in both spectra: a (several ) broad “incoherent background” both below and above the Fermi surface and a dispersing structure with a smaller width of order of a few around . In our earlier work [8] in which the lowest temperature accessible was , this dispersing quasi-particle-like band was shown to have its maximum at . In this case, which is reproduced in Fig. 2(a), there is a “large” Fermi surface centered around . However, by lowering the temperature to , the structure forming the maximum at looses weight and the new valence-band maximum seems to be shifted to or (Fig. 2(b)) [17]. In agreement with the ARPES data in Fig. 1(b), we observe the downturn (“shadow” structure) as well as a drastic (by about a factor of 10) spectral weight loss when following the quasi-particle band from to . It is well known [18] that inclusion of higher-neighbor (, etc.) interactions lifts the degeneracy of the points and at half-filling and pushes the point up in energy. This opens up the possibility of a small Fermi surface (“hole pockets”) around [11, 19]. The full line in Fig. 2(b), which plots our results for the same temperature for the insulating case, , indicates the similarities between the doped situation and the antiferromagnetic band structure at half-filling.
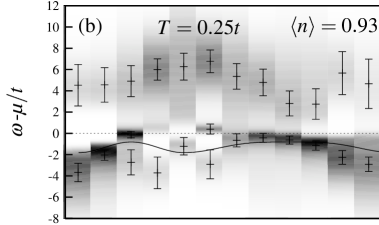
The physical origin of a possible manifestation of insulating band features in the under-doped regime seems to be that around the temperature the antiferromagnetic correlation length becomes larger than the lattice spacing , i.e. for we find , whereas for we find [20]. The decisive role played by antiferromagnetic spin fluctuations for the pseudogap and the under-doped band structure is substantiated by the behavior of , shown in Fig. 3.
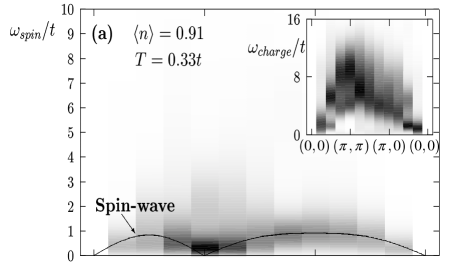
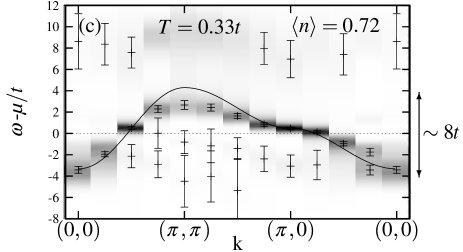
Consider first Fig. 3(a), which exhibits the spin excitation energy as function of momentum for the Hubbard model with and at a doping of away from half-filling. Here, dark (white) areas again correspond to a large (small) spectral weight for spin excitations and the full line gives the spin-wave dispersion, i.e. , where denotes the tight-binding energy . This figure reveals that in the under-doped regime up to maximal doping () the spin excitations have an energy dispersion that still closely follows the antiferromagnetic spin-wave dispersion. The main weight is confined to with a small spread and to a small but finite energy . This sets an energy scale for spin excitations. This result is in accordance with recent neutron-scattering data [21] and also with other experiments that have directly shown that propagating spin-waves with energies of order still exist even at optimal doping [22]. When the temperature is lowered below , slightly decreases and the antiferromagnetic correlation length () becomes larger than the lattice spacing. As a consequence, the single-particle hopping is now strongly renormalized by the short-range antiferromagnetic order resulting in a bandwidth (Fig. 2(b)) also of order of (a few) . This renormalization is strongest at and, thus, directly responsible for the pseudogap: because of the “matching”condition, , the bare photohole created by ARPES for couples strongly to two-particle excitations whose spectral function peaks near momentum [7]. Using a standard diagrammatic evaluation of the self-energy like the FLEX summation [23], and approximating the peak in by , one obtains for the self-consistency equation
| (3) |
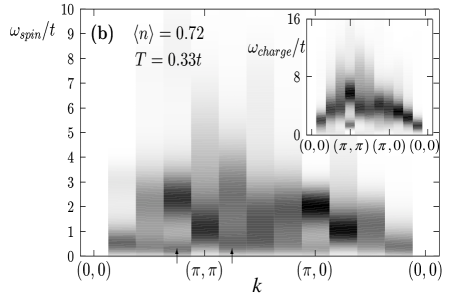
since . As a consequence of this self-consistency requirement, multiple, repeated spin-wave excitations (“shake ups”) accompany the bare carrier motion, lead to incoherent contributions to the electronic spectrum at and spread spectral weight to lower energies. In the over-doped regime, shown in Fig. 3(b), the sharpness both in and in , and thus the “matching”condition is lost completely and the coupling to the bare photohole is weak and broad in energy. The crossover to a new energy scale ( rather than ) is also reflected in a corresponding crossover in the single-particle bandwidth () in Fig. 2(c). In contrast to the spin excitations, the charge excitations are already broad and structureless in the under-doped regime, with the energy spreading essentially over the non-interacting bandwidth (inset in Fig. 3(a)) [24].
In this letter, we have addressed the microscopic mechanism behind the opening of a pseudogap and its evolution from under-doped to over-doped regimes. Our key results are (i) that the dynamical QMC results for the two-dimensional Hubbard model reproduce both the momentum (i.e. the –symmetry) and doping dependence of the pseudogap and (ii) that it is the unique doping dependence of the magnetic response which establishes the first numerical proof that the pseudogap is due to antiferromagnetic spin correlations in the under-doped regime.
Acknowledgements.
One of us (W. H.) would like to thank Z.-X. Shen, J. R. Schrieffer, D. J. Scalapino, E. Dagotto, A. Moreo, E. Arrigoni and R. Noack for instructive comments. Support by FORSUPRA II, BMBF (05 605 WWA 6), ERB CHRXCT940438 and computational facilities at the HLRZ Jülich and LRZ München are acknowledged.REFERENCES
- [1] Present Address: Max-Planck-Institut für Plasmaphysik, EURATOM Association, D-85740 Garching, Germany
- [2] D. S. Marshall, et al., Phys. Rev. Lett. 76, 4841 (1996).
- [3] A. G. Loeser, Z.-X. Shen, et al., Science 273, 325 (1996).
- [4] H. Ding, T. Tokoya, J. C. Campuzano, et al., Nature 382, 51 (1996).
- [5] H. Ding et al., Phys. Rev. B 52, R9678 (1996).
- [6] P. J. White, Z.-X. Shen, et al., preprint
- [7] Z.-X. Shen and J. R. Schrieffer, preprint.
- [8] R. Preuss, W. Hanke and W. v. d. Linden, Phys. Rev. Lett. 75, 1344 (1995).
- [9] N. Bulut, D. J. Scalapino, and S. R. White, Phys. Rev. B 50, 7215 (1994), Phys. Rev. Lett. 72, 705 (1994).
- [10] S. Haas, A. Moreo, and E. Dagotto, Phys. Rev. Lett. 74, 4281 (1995).
- [11] R. Eder et al., cond-mat/9611033
- [12] A. Kampf and J. R. Schrieffer, Phys. Rev. B 42, 7967 (1990).
- [13] A. V. Chubukov, Phys. Rev. B 52, R3840 (1995).
- [14] A. V. Chubukov, D. Pines and B. P. Stojkovic, preprint cond-mat/9606208v3.
- [15] The average error level of all QMC-data was well below 0.5%, except for =0.93, =0.25, where the error level is higher due to sign problems.
- [16] For details see M. Jarrell, G. E. Gubernatis, Phys. Rep. 269, 134 (1996), and W. v. d. Linden, R. Preuss and W. Hanke, J. Phys. 8, 3881 (1996).
- [17] Because the integrated spectral weight suffers less from resolution problems of the Maximum-Entropy technique, we examined in detail the temperature dependence of the total spectral weight in the quasi-particle band at . This signal is calculated from the percentage of weight in this band (which is above the chemical potential and well separated from the incoherent background, see Fig. 2(a)) with respect to the total intensity, . At and we have intensity, at we get and, finally, less than at . In ARPES a weak signal with less than roughly intensity of the largest signal (located both in theory and experiment at ) is not observable [10]. In a similiar way our QMC results in Fig. 2(b) at can be interpreted: the resolution of the Maximum-Entropy technique for the QMC error level at this temperature is such that peaks with relative intensities less than about will not be resolved. This is the criterion followed in this work to classify a result as observable in the dynamical QMC method.
- [18] P. Duffy and A. Moreo, Phys. Rev. B 52, 15607 (1995).
- [19] H. Endres, C. Gröber, W. Hanke, to be published.
- [20] The correlation length is obtained from a fit of the QMC equal-time spin-spin correlation function to a form .
- [21] T. E. Masan, G. Aeppli, et al., Physica B 199, 284 (1994); P. Bourges, et al., Phys. Rev. B 53, 876 (1996).
- [22] F. M. Hayolen et al., Phys. Rev. Lett. 76, 1344 (1996).
- [23] N. E. Bickers and D. J. Scalapino, Ann. of Phys. 193, 207 (1989).
- [24] See also for the model: T. Tohyama, P. Horsch and S. Maekawa, Phys. Rev. Lett. 74, 980 (1995).