[
Hole Doping Evolution of the Quasiparticle Band in Models of Strongly Correlated Electrons for the High-Tc Cuprates
Abstract
Quantum Monte Carlo (QMC) and Maximum Entropy (ME) techniques are used to study the spectral function of the one band Hubbard model in strong coupling including a next-nearest-neighbor electronic hopping with amplitude . These values of parameters are chosen to improve the comparison of the Hubbard model with angle-resolved photoemission (ARPES) data for . A narrow quasiparticle (q.p.) band is observed in the QMC analysis at the temperature of the simulation , both at and away from half-filling. Such a narrow band produces a large accumulation of weight in the density of states at the top of the valence band. As the electronic density decreases further away from half-filling, the chemical potential travels through this energy window with a large number of states, and by it has crossed it entirely. The region near momentum and in the spectral function is more sensitive to doping than momenta along the diagonal from to . The evolution with hole density of the quasiparticle dispersion contains some of the features observed in recent ARPES data in the underdoped regime. For sufficiently large hole densities the “flat” bands at cross the Fermi energy, a prediction that could be tested with ARPES techniques applied to overdoped cuprates. The population of the q.p. band introduces a hidden density in the system which produces interesting consequences when the quasiparticles are assumed to interact through antiferromagnetic fluctuations and studied with the BCS gap equation formalism. In particular, a region of extended s-wave is found to compete with d-wave in the overdoped regime, i.e. when the chemical potential has almost entirely crossed the q.p. band as is reduced. The present study also shows that previous “real-space” pairing theories for the cuprates, such as the Antiferromagnetic Van Hove scenario, originally constructed based on information gathered at half-filling, do not change their predictions if hole dispersions resembling non-interacting electrons with renormalized parameters are used.
PACS numbers: 74.20.-z, 74.20.Mn, 74.25.Dw
]
I Introduction
Recent studies of using angle-resolved photoemission techniques have provided the evolution of the quasiparticle band as the hole density changes in the underdoped regime of the high- cuprates[1, 2, 3]. These studies complement previous ARPES analysis of the hole dispersion in the antiferromagnetic insulator [4, 5]. The overall results emerging from these experiments can be summarized as follows: (i) the bandwidth of the quasiparticle band is a fraction of eV, i.e. narrower than generally predicted by band structure calculations. This result suggests that strong correlations are important in the generation of the quasiparticle dispersion; (ii) the two dimensional (2D) model explains accurately the bandwidth for a hole injected in the insulator, as well as the details of the dispersion along the main diagonal in momentum space from to (in the 2D square lattice notation)[4]; (iii) however, the behavior along the direction from to is not properly described by the model which predicts a near degeneracy between momenta along this line[6], in contradiction with experiments. The ARPES data for the antiferromagnetic insulator show that the quasiparticle signal at is very weak, and about 0.3 eV deeper in energy than [4]; (iv) as the density of holes grows the region near moves towards the chemical potential which is approximately reached at the optimal concentration[1], while the main diagonal is less affected; (v) at optimal doping remarkably “flat” bands at near the Fermi energy have been observed[7].
The results of Marshall et al.[1] have been interpreted as providing evidence for “hole pockets” in the underdoped regime caused by short-distance antiferromagnetic correlations, although other explanations such as preformed pairs are also possible[8, 9]. As explained before, the standard model is not enough to provide all the details of the ARPES results at half-filling, and thus presumably it cannot explain the data away from half-filling either. However, the model is just one possible Hamiltonian to describe the behavior of holes in an antiferromagnetic background. While the model is attractive for its simplicity, there is no symmetry or renormalizability argument signaling it as unique for the description of the cuprates. For this reason Nazarenko et al.[10] recently introduced extra terms in the Hamiltonian to improve the agreement with experiments. Adding an electronic hopping along the diagonals of the elementary plaquettes (with amplitude ) the results for the insulator were improved since the position of the quasiparticle at proved to be very sensitive to the strength of extra hole hopping terms in the model. Actually, the q.p. peak at this momentum moves towards larger binding energies as a negative grows in amplitude[10]. This idea has been used by several other groups which, in addition to hoppings along the plaquette diagonals, have included hoppings at distance of two lattice spacings with amplitude to obtain an even better agreement with experiments[11].
The purpose of this paper is to report on results for the density dependence of the quasiparticle dispersion corresponding to the one band Hubbard model with a next-nearest-neighbor hopping working in the strong Coulomb coupling regime. It is expected that the and models produce qualitatively similar physics at large . As numerical technique we use the Quantum Monte Carlo method supplemented by Maximum Entropy analysis. The success of the model at half-filling[10, 11] and the recent availability of ARPES data in the underdoped regime[1, 2, 3] prompted us to carry out this study. Note that although the numerical methods used here are powerful, their accuracy is limited and, thus, our results are mostly qualitative rather than quantitative. Nevertheless, from the analysis of the present QMC data and also comparing our results against those produced previously for the and Hubbard models here we arrive to the conclusion that at least some features of the experimental ARPES evolution of the hole dispersion can be explained using one band electronic models. Experimental predictions are made to test the calculations. The presence of a narrow quasiparticle band in the spectrum, and its crossing by the chemical potential as the electronic density is reduced, are key features for the discussions below.
The present paper is not only devoted to the analysis of QMC results and its comparison with ARPES data, but it also addresses the influence of hole doping in recently proposed theories for the cuprates[12]. In these theories the hole dispersion is calculated at half-filling and assumed to change only slightly as the hole density grows. Hole attraction is assumed to be dominated by the minimization of antiferromagnetic (AF) broken bonds, which implies the presence of an effective nearest-neighbor (NN) density-density attraction proportional to the exchange . Superconductivity in the channel is natural in this scenario[12] due to the strong AF correlations[6, 13]. The interaction of holes is better visualized in , i.e. with pairing occurring when dressed holes share a spin polaronic cloud, as in the spin-bag mechanism[14]. This real-space picture (see also Ref.[15]) holds even for a small AF correlation length, , and in this scenario there is no need to tune parameters to work very close to an AF instability as in other approaches.
To obtain quantitative information from these intuitive ideas, holes moving with a dispersion calculated using one hole in an AF background, , and interacting through the NN attractive potential mentioned before, have been previously analyzed[12]. Within a rigid band filling of and using a BCS formalism, superconductivity dominates with caused by a large density of states (DOS) that appears in the hole dispersion. The idea has many similarities with previous scenarios that used van Hove (vH) singularities in the band structure to increase [16], although d-wave superconductivity is not natural in this context unless AF correlations are included. However, the rigid band filling is an approximation whose accuracy remains to be tested. In particular, the following questions naturally arise: (i) does the q.p. peak in the DOS found at survive a finite hole density?; (ii) to what extent do the changes in the q.p. dispersion with doping affect previous calculations in this framework?; (iii) are the “shadow” regions generated by AF correlations[14, 17, 18, 19] important for real-space pairing approaches? With the help of the present QMC results, as well as previous simulations, in this paper all these issues are discussed. The overall conclusion is that as long as the hole density is such that the is at least of a couple of lattice spacings, the predictions of previous scenarios[12] and other similar theories remain qualitatively the same, in spite of substantial changes occurring in the hole dispersion with doping.
The organization of the paper is as follows: in Sec.II the model and details of the numerical method are discussed. Sec.III contains the QMC-ME results both at half-filling and with a finite hole density. In Sec.IV the results are discussed and compared with ARPES experiments. Implications for real-space theories of high- are extensively studied in Sec.V. Results of previous publications are also used to construct a simple picture for the behavior of electrons in the Hubbard model. Sec.VI contains a summary of the paper and its experimental predictions.
II Model and Numerical Technique
The one band Hubbard Hamiltonian with next-nearest-neighbor hopping is given by
where creates an electron at site with spin projection , is the number operator, the sum runs over pairs of nearest-neighbor lattice sites, runs over pairs of lattice sites along the plaquette diagonals, is the on-site Coulombic repulsion, the nearest-neighbor hopping amplitude, is the plaquette diagonal hopping amplitude, and the chemical potential. Throughout this study we will set , , and use periodic boundary conditions.
Using standard QMC methods[20], we have obtained the imaginary time Green’s functions at finite temperature. The method of Maximum Entropy[21] was used to analytically continue the imaginary time Green’s functions to obtain the spectral weight function . Previous studies using this method have concentrated on, e.g., the one-dimensional [22] and two-dimensional Hubbard model at and away from half-filling [18, 23, 24, 25]. However, with the next-nearest-neighbor hopping term only a few results have been obtained with this technique [26] since the additional hopping amplitude exacerbates the sign problem (which exists even at half-filling).
In this paper, we present a systematic study of the evolution of the spectral function in the model at electronic densities ranging from half-filling to quarter-filling on a lattice at an inverse temperature of . The procedure we used to obtain these results is slightly different from those used before [25, 26], and we believe that it provides more details to the spectral function. First, approximately 100,000 QMC measurement sweeps were taken at each density (for a fixed , , and ) to obtain accurate statistics for the imaginary time Green’s functions. Once the spectral function was obtained from the standard ME procedure, we used this spectral function as a seed for further ME analysis with a reduced coefficient of the entropy [21, 27].
In order to work in the realistic strong coupling regime, sacrifices in the lattice size and temperature had to be made due to the sign problem[28]. The same set of measurements shown below in Sec.III could have been performed on an lattice. However, it would have required a higher temperature to obtain good statistics on the imaginary time Green’s functions thereby washing out parts of the quasiparticle features that become prominent at lower temperatures. Since at half-filling and , the and lattices give qualitatively similar results and we were able to reach a lower temperature using the smaller lattice, then we decided to use the cluster throughout the paper.


III QMC Results
A Half-filling
In Fig.1 the QMC results obtained at half-filling for , , and are shown. Fig.1a contains after the ME analysis of the QMC data. The asymmetry of most of the dominant peaks suggests that they are a combination of at least two features located at different energies. This is reasonable since previous calculations for the model (see e.g. Ref.[25]) have established that below the chemical potential is made out of a quasiparticle (q.p.) peak near , carrying a small fraction of the total weight, and a broad incoherent (INC) feature at larger binding energies containing the rest of the weight. have been fitted by two gaussians with positions, widths and weights adjusted to match the ME result, keeping the overall weight constant. The same study was performed above the chemical potential in the inverse photoemission (IPES) regime but such analysis did not provide interesting information since the weight of the peak the closest to is very small, specially away from half-filling. Then, within the accuracy of the present QMC-ME study, the upper Hubbard band (UHB) is described as just containing a broad featureless peak for each momentum. The two-peak decomposition analysis reported here will, thus, be limited to the PES part of the spectrum. However, note that at least at half-filling it is likely that the IPES portion of the spectrum contains a (low intensity) q.p.-like feature. In particular as particle-hole symmetry must be recovered, and here the peaks appearing in the PES region must also exist in the IPES regime. Nevertheless, in Sec. III.B below we will show that at finite hole densities the q.p. band at the bottom of the UHB carries such a small weight that it can be neglected.
Following this fitting procedure, in Fig.1b the energy position of the peaks as a function of momentum is shown. As anticipated, below a feature at the top of the valence band appears. It is natural to associate this peak with a “quasiparticle band”. The bandwidth is roughly , i.e. much smaller than for free electrons on a lattice. However, it is not as small as predicted by model calculations[6], which may be due to the influence of or a finite . The top of the q.p. band is located along the main diagonal from to , in agreement with previous literature[6]. The influence of the nonzero next-nearest-neighbor (NNN) hopping appears in the energy position of the q.p. band at which is deeper in energy than and (while for , is located very close to the top of the band in contradiction with ARPES experiments for cuprate insulators[4]). It is likely that on larger clusters would correspond to the actual top of the q.p. band, as predicted before[6]. The overall shape of the q.p. band is similar to that calculated in the model using the self-consistent Born approximation[10].


It is interesting to note that the q.p. band includes momentum , although with a very small intensity. This is reasonable for two reasons: (i) first, the presence of a charge gap in the spectrum, as clearly seen in Fig.1b, suggests that bands starting, say, at cannot simply disappear at some other momentum by crossing . By continuity they have to extend all along the Brillouin zone (unless their q.p. weight vanishes); (ii) in addition, the presence of strong antiferromagnetic correlations implies a doubling of the unit cell of dynamical origin and thus “shadow band” features should appear in the spectrum, as discussed in several models with strong antiferromagnetic correlations[14, 17, 18, 19, 24, 30, 29, 31]. In other words, AF introduces an extra symmetry in the problem that links with . These shadow features are certainly weak compared to the rest of the band, but are nevertheless present in the spectrum of Fig.1b.
The rest of the spectral weight is contained in the broad incoherent feature at energies deeper than the q.p. peak, and also in the UHB. The latter presents some nontrivial momentum dependence near . This behavior seems a remnant of the results for noninteracting electrons. Finally, Fig.1c contains the density of states (DOS) at half-filling. The gap and the sharp q.p. band can be clearly identified.
B Finite Hole Density
Fig.2 contains the QMC-ME results obtained at density , with the rest of the parameters as in Fig.1. In Fig.2a the spectral weight is shown. There are several interesting features in this result. For example, the upper Hubbard band has lost weight compared with results at . This is not surprising since as the hole density grows the chances that an electron injected in the lattice will populate already occupied sites is reduced.
The most interesting physical consequences of hole doping are obtained in the PES region. Here the chemical potential has moved to the top of the valence band, more specifically into the q.p. band. Fig.2b shows the results of a two-peak analysis of the PES region similar to that performed at half-filling. Interpolating results along the main diagonal it is observed that the q.p. peak at momentum should be approximately at the chemical potential for this density, while is still about below. The q.p. band has distorted its shape in such a way that considerable weight has been moved above in the vicinity of . Actually, now the q.p. band resembles a more standard tight-binding dispersion although with a renormalized hopping amplitude smaller than the bare one. Note, however, that the position of the q.p. peak at momentum is somewhat pathological since it is located above the chemical potential. We do not have an explanation for this anomalous behavior,


which likely is caused by the Maximum Entropy procedure. The incoherent part of the spectrum (INC) is also clearly visible in the calculation. At this density it remains entirely filled, i.e. the electrons removed from the system have been taken from the q.p. band. Finally, note that the shadow features are no longer prominent. This is correlated with a substantial reduction of the antiferromagnetic correlation length at this density and temperature compared with the results at half-filling. This is not in contradiction with claims that recently observed features in ARPES are induced by antiferromagnetism[17, 18] since at very low temperatures likely remains robust for a larger hole density region near half-filling than it occurs at the relatively high temperature . In Fig.2c the DOS for is shown. The q.p. band is sharp, and lies slightly to the right of the top of this band (see inset of Fig.2c). A pseudogap generated by the large coupling is still clearly visible.
Fig.3a contains the QMC-ME results obtained at . Compared with the results at , now is located deeper inside the q.p. band according to the two-gaussians analysis presented in Fig.3b. Interpolations clearly show that for this band is now in the IPES region, while is at or very close to but still in the PES regime. The incoherent weight in PES remains robust. Fig.3c shows the DOS at this density. is located slightly to the left of the q.p. band maximum, the pseudogap has virtually melted, and there is only a tiny trace of the upper Hubbard band. The presence of very close to is correlated with experimental results showing “flat bands” near the Fermi energy at optimal doping[7, 32, 30, 33].
Fig.4 contains the QMC results obtained at . This density is particularly interesting since now seems to have crossed most of the q.p. band[34]. This can be observed directly in the spectral weight (Fig.4a), and in its two-peak analyzed output (Fig.4b). This detail will have interesting consequences for some theories of high-


uprates, as described later in this paper. The DOS is shown in Fig.4c. The same trend is also observed at for which here only the DOS is shown (Fig.5). At this density the q.p. band is empty and the INC becomes sharper presumably due to its proximity to the chemical potential. It is interesting to note that the chemical potential in Fig.5 is located at a sharp minimum in the density of states.
Results at (Fig.6) show that the q.p. band has melted and at this low density the spectral weight is dominated by features that can be traced back to the incoherent part of the PES spectrum at half-filling (Fig.6a). In Fig.6b the position of the dominant peak is given as a function of momentum, and in Fig.6c the DOS is shown. It is interesting that now the results are nicely fitted by the non-interacting tight-binding dispersion (solid line in Fig.6b). Thus, the “free electrons” limit is approximately recovered in the strong coupling regime at “quarter-filling”. Again, note that the peak structure in the spectrum seems to have emerged from the incoherent part of the valence band observed at half-filling.
IV Comparison of QMC-ME results with ARPES experiments
As discussed in the Introduction, ARPES results have shown that the quasiparticle peak at is very sensitive to hole doping at least in the underdoped regime[1, 2]. For the same densities, the q.p. dispersion along the main diagonal from to does not change as much. In this section it will be investigated if the numerical results of Sec.III are compatible with the ARPES data.
In Fig.7, we schematically show what occurs upon doping when a tight binding dispersion including a NN hopping amplitude , and a NNN amplitude with a ratio


is used. The reason for this exercise is that the QMC-ME results of Sec.III have shown that rapidly upon hole doping the quasiparticle dispersion resembles that of a renormalized non-interacting set of electrons. Then, it is interesting to analyze what would occur with such dispersion as the density within the q.p. band changes (i.e. the density shown in Fig.7 must be considered as the filling of the q.p. band, rather than the density of the whole system). It is clear from the figure that is intrinsically more sensitive to doping than the main diagonal. Actually the results resemble in part those of Marshall et al.[1] specially the experimental ARPES dispersion corresponding to slightly underdoped

samples of Bi2212 with , as well as previous experiments for optimally doped samples[7], where the q.p. band crosses the chemical potential between and . This lead us to conjecture that the ARPES experiments in the slightly underdoped regime may have observed the hole filling of a “free-like”, but narrow, q.p. band. If this speculation is correct, then it is here predicted that will eventually cross the chemical potential when the system becomes overdoped, as Fig.7 shows. To the best of our knowledge there are no ARPES results in this regime. Experimental work for overdoped cuprates would clarify the issue of whether the “flat bands” found in the optimal regime remain locked near or smoothly cross the Fermi energy as the hole doping increases. Our results favor the latter, at least within the resolution of the QMC-ME methods.
Further evidence that travels across the chemical potential is given in Fig.8a,b. There with , taken from Figs.1a-6a, is shown again adding also results for densities and for completeness. The peak at this momentum belonging to the q.p. band crosses at a density . Then, as the hole density grows a movement up in energy of the quasiparticle is clearly observed, as in ARPES experiments[35]. At a larger hole density, such as quarter-filling, the q.p. peak, now in the IPES regime, substantially reduces its weight and disappears. At this density the feature associated with the incoherent part of the spectrum at half-filling is now located close to the Fermi energy, contributing to the dispersion that resembles the result (Fig.6b). The UHB rapidly looses weight moving away from half-filling. Fig.9a,b show similar results but for , which is representative of the behavior along the main diagonal on the cluster. The q.p. associated to this momentum crosses the chemical potential at a smaller hole density ().
Summarizing the results of this section, in Fig.10 three representative q.p. dispersions obtained with QMC-ME methods (Sec.III) are shown. For the half-filled case the results are accurately known from the self-consistent Born approximation[10], and is clearly below the chemical potential, which here is arbitrarily located at the top of the band. Note that the intensity of the q.p. peak is much weaker near than for other momenta at half-filling. For small hole doping densities, such as , a “free-like” but narrow quasiparticle band is observed in QMC simulations (also in studies of the model[36, 25]) and is now at the Fermi energy. The vicinity of is the region affected the most by hole doping due to the reduction of antiferromagnetic correlations. Finally, at lower densities, such as , the chemical potential has crossed the q.p. band and now is above the Fermi energy. We consider that the scenario depicted in Fig.10 for the density evolution of the q.p. dispersion can provide a simple qualitative explanation for the ARPES results found experimentally. It predicts that the q.p. peak at will eventually disappear from the ARPES signal into the IPES region, an effect that could be tested experimentally. At densities intermediate between and , the peak at should evolve smoothly between these two limits, and thus close to half-filling “pseudogap” features will likely appear in simulations if lower temperatures could be reached. Reducing the temperature below is particularly important for the generation of strong spin fluctuations which are crucial to induce the quasiparticle dispersion at half-filling shown in Fig.10. Note that “shadow” features should actually be present at but they are too weak to be detected by QMC-ME methods, and probably also by ARPES experiments which have large backgrounds in their signals. Thus, the existence of hole pockets cannot be shown from the current Monte Carlo simulations available.
V Implications of QMC results for some theories of High-
In this section the implications of our QMC results for recently proposed scenarios for high- cuprates will be discussed. Two features found in the simulation will be important, namely the “tight-binding” shape of the q.p. band at finite hole density (although with renormalized parameters) and the crossing of the q.p. band by for densities in the approximate range .
A Large peak in the DOS
As explained in the introduction, the presence of “flat” regions in the experimental normal-state q.p. dispersion is a remarkable feature of the phenomenology of hole-doped cuprates[7]. These flat bands are located around momenta and , and at optimal doping they are below the Fermi energy[7]. Studies of holes in the 2D and Hubbard models at and away from half-filling have suggested that antiferromagnetic correlations may play an important role in the generation of these features[32, 30, 33, 36]. Our results for the model suggest the presence of flat bands in the regime close to , although care must be taken with the finite resolution of the ME-generated q.p. peaks. But even if these flat regions were not quantitatively described by one band electronic models, the intrinsic small bandwidth of the q.p. band at small hole density could be enough to induce a large peak in the DOS which can be used to enhance the superconducting critical temperature, once a source of hole attraction is identified. This leads to a natural explanation for the existence of an “optimal doping” which in this framework occurs when the peak in the q.p. band is reached by [12]. It is also natural to label as “underdoped” the regime where is to the right of the “flat band” peak (i.e. at higher energies), and “overdoped” when it is to the left (i.e. at lower energies)[37].

Previous analytical calculations[12] assumed the survival of the large DOS obtained at half-filling as the density of holes grows. The results of our simulations (Sec.III) allow us to study the evolution of the DOS with hole density and judge if these ideas are realistic. The presence of a robust q.p. peak is certainly confirmed by our results, and Figs.1b-4b show that as decreases from 1, the q.p. band is crossed by as conjectured before[12]. The DOS of the standard and Hubbard models (with ) also have a large peak in the DOS, as found in previous numerical simulations. For completeness, here those results are also presented. In Fig.11a, for the 2D model obtained with exact diagonalization (ED) techniques is shown at several densities[6]. At half-filling, a large DOS peak appears at the top of the valence band[32]. Note that substantial weight exists at energies far from , i.e. the large peak carries only a fraction of the total weight, in agreement with the QMC simulations of Sec.III. In the model, the maximum in the DOS is not strictly located at the top of the valence band but at slightly smaller energies[32]. This effect is enhanced by adding hopping terms to the Hamiltonian, as shown in the simulation results of Sec.III. As decreases, the peak in Fig.11a is now much broader but it remains well-defined. At , is located close to the energy where is maximized. At , moves to the left of the peak. These results are quantitatively similar to those of our QMC simulations for the model, and also with results for the Hubbard model (Fig.11b). Thus, while accurate extrapolations to the bulk limit are difficult, the simple qualitative picture emerging from these studies, namely that strong correlations generate a q.p. peak in the DOS which is crossed by , seems robust.
As explained before, this q.p.-peak-crossing of the DOS is important since once a source of hole attraction exists in the system, a superconducting (SC) gap would open at , and the resulting could be enhanced due to the large number of states available. The numerical results, both QMC and ED, are thus compatible with scenarios where a large is obtained due to an increase in . Since the peak width increases substantially with hole density, strictly speaking the rigid band filling of the half-filled hole dispersion is invalid. However, such an approximation seemed to have captured part of the qualitative physics of the problem, since the DOS peak is not washed out by a finite hole density.
In the cases discussed here, i.e. the and models, calculations of the spin-spin correlations show that is approximately a couple of lattice spacings when is located near the DOS peak, becoming smaller as the overdoped regime is reached. Thus, a nonzero and near a large DOS peak are features. It is in this respect that scenarios where AF correlations produce a large DOS that enhances [12] differ from vH theories where divergences in the DOS are caused by band effects already present before interactions are switch on[16].
While the existence of a robust peak in the DOS is in good agreement with ARPES data[7], it is in apparent disagreement with specific heat studies for YBCO[38]. The lack of -resolution in the specific heat measurements may solve this puzzle. Actually, angle- PES results for Bi2212 do not show the sharp flat features found in ARPES for the same material[39, 40]. Similar effects may affect the specific heat data which should be reanalyzed to search for DOS large peaks.
B Kondo resonances vs AF induced quasiparticle
Previous QMC-ME studies of the Hubbard model for [36, 41, 18] reported results qualitatively similar to those shown in Fig.11b, where the DOS obtained on a cluster is presented for the one band Hubbard model at , and . The ME technique used in Fig.11b is the same as in those previous simulations, and it does not have the resolution of the present ME variation discussed in Sec.III. The crossing of a peak in the DOS by is clearly observed in these ME simulations but at half-filling there are no q.p. peaks and Fig.11b can thus be naively interpreted as the “generation” by doping of a Kondo-like peak at the top of the valence band which does not exist at . However, our current results (Fig.1c) actually show that at a well-defined q.p. peak is present, as predicted by a variety of studies of the zero temperature model with one hole[6, 25]. Also experimentally in the cuprates it has been already established[39] that the states observed in PES upon doping are already present in the insulator and are Kondo resonances. Thus, Figs.1b-4b provide evidence that the q.p. features observed at are smoothly connected to peaks already present at half-filling. Similar conclusions have also been obtained in geometries other than the 2D square lattice, such as a ladder[31, 42].
C in the Hubbard model
The results of Figs.1b-6b show that the q.p. band is very sensitive to doping, at least at the temperatures and couplings used in this QMC-ME study. In particular a few percent hole doping is enough to transform the half-filling dispersion, containing the extra symmetry induced by long-range AF order, into a tight-binding-like dispersion although with a small hopping amplitude. These results are similar to others previously published in the literature. For example in Fig.12a,b the q.p. dispersion at , and at for the model is reproduced from Ref.[25] (for Hubbard model results, see Ref.[36, 43]). Upon doping, vestiges of the flat regions remain, inducing a large peak in the DOS (see Fig.11). However, the region around has changed substantially, i.e. the AF shadow region observed at reduced its intensity and considerable weight was transferred to the IPES region. The q.p. dispersion at of the model can also be fitted by a tight-binding nearest-neighbors (NN) dispersion with a small effective hopping likely associated with . Then, both previous literature results and the present simulations agree on the qualitative aspects of the evolution with doping of .
The changes in the q.p. dispersion with hole doping can be interpreted in two ways: First, note that is influenced by matrix elements of fermionic operators connecting states with and particles. This is
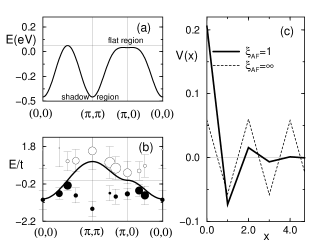
important when the q.p. weight is small, i.e. when the state does not have a large overlap with the ground state of the particles subspace ( being the ground state with particles). If the hole excitation is instead created by a new operator that incorporates the dressing of the hole by spin fluctuations, then may now have a large overlap with [44, 45]. In other words, if the dressed hole state resembles an extended spin polaron, then the physics deduced from PES studies, which rely on the sudden removal of a bare electron from the system, may be misleading. To the extent that spin polarons remain well-defined at finite density, the use of will induce spectral weight rearrangements between the PES and IPES regions, and the results at small hole density could resemble those at half-filling after such spectral weight redistribution takes place. If this idea were correct, then the study of superconductivity and transport, both regulated by quasiparticles, could indeed be handled by filling a rigid band given by . It is likely that this idea will work in the underdoped regime where is robust, and results for 2D clusters[45] and ladders[46] already support these claims. Note that the fact that the bandwidth at finite hole density remains much smaller than shows that strong correlations still play an important role in the dispersion.
However, an alternative is that the difference between Figs.12a and 12b for the model and Figs.1b and 2b for the model correspond to an intrinsic change

in the q.p. dispersion as decreases. This is the less favorable case for the real-space pairing approaches[12] which are constructed at half-filling, and thus we should analyze this possibility in detail here. For this purpose, we have applied the standard BCS formalism to an effective model with a low density of quasiparticles having a dispersion (assuming ), which roughly reproduces the dominant features of Fig.12b (the reader should not confuse this dispersion with that of free particles whose bandwidth is four times larger. A large amount of incoherent weight is still observable at the density of Fig.12b although it is not shown explicitly. The same occurs in Fig.2b for the model). As described before, to study we should include a NN attraction induced by AF between these quasiparticles. While naively it may seem dubious to use the same interaction both at and away from half-filling, the hole-hole potential should not be much affected at distances shorter than . This can be illustrated by a real space analysis (Fig.12c) of a smeared -function potential of AF origin , where the lattice spacing is set to 1, and . Fig.12c shows that the NN potential () does not change noticeably as is reduced, while is rapidly suppressed. Then, using the same NN form of the potential for many densities should not be a bad approximation[47].
To analyze the stability of previous calculations let us then use the tight-binding dispersion obtained from the numerical analysis in the BCS gap equation. Solving numerically the gap equation, is shown in Fig.13a. As reported before[12], superconductivity at in the channel appears naturally if the hole dispersion at half-filling is used. Nevertheless, if instead is used, the vestiges of the flat bands present in this narrow dispersion produce which is still large[48]. Even more remarkable is the fact that the character of the SC state is maintained. This result can be understood noticing that a combination of with an attractive NN potential effectively locates the Hamiltonian in the family of “” models with repulsive and attractive, where it is known that for a “half-filled” electronic band the dominant SC state is -wave[49]. In other words, when is at the flat region of the dispersion it approximately corresponds to an effective “half-filled” q.p. band resembling a free electron dispersion (but with smaller bandwidth), leading to a -wave SC state (Fig.13a). Then, even if the q.p. dispersion changes substantially with doping near the point, such an effect does seem to alter the main qualitative features found in previous studies[12]. This is a remarkable result and it is caused by the rapid depopulation of the q.p. band as the hole density grows. Then, while governs the actual global density of the system, there is a subtle hidden density (i.e. the population of the q.p. band) that may influence considerably on the physics of the problem. At and for the model, this q.p. band is nearly empty while globally the system is still close to half-filling. While the use of or is certainly a rough approximation, the existence of a robust and d-wave superconductivity in both cases suggests that similar results would be obtained using more realistic models for the hole pairing interaction.
D Influence of shadow bands on SC
The present analysis also shows that the AF “shadow” regions of the half-filling hole dispersion are not crucial for the success of the real-space approach. Using , which does not contain weight in PES near , is still robust and the d-wave state remains stable, as shown in the previous subsection. To establish this result more clearly, we analyzed using but modulating the contribution of each momentum with a -dependent weight in the one particle Green’s function. We considered the special case where is zero away from a window of total width centered at the saddle point, which is located in the flat bands region. Inside the window , the weight is maximum i.e. . Such a calculation also addresses indirectly possible concerns associated with widths that q.p. peaks would acquire away from half-filling in standard Fermi liquids ( is the Fermi energy). Results are shown in Fig.13b, for d-wave SC. Note that even in the case where is as small as just 5% of the total bandwidth (itself already small of order ), remains robust and close to . Then, it is clear that the dominant contribution to comes from the flat regions and the shape of the q.p. dispersion away from them has a secondary importance for the success of the real-space approach. However, it is important to remark that the calculation described in this section showing that shadow features are not much important for the actual value of does not mean that AF correlations can be neglected. On the contrary, the whole Antiferromagnetic Van Hove scenario[12] and other similar approaches are based on the notion that pairing is caused by spin fluctuations[50].
E SC in the overdoped regime
Finally, novel predictions obtained in the regime where the q.p. band is almost fully crossed by (as observed in Sec.III for between 0.78 and 0.66) are here discussed. From the point of view of the q.p. band this regime is “dilute” but, again, this should not be confused with the bottom of the whole spectrum since a large amount of weight remains in the incoherent part of . At this density a standard BCS gap equation analysis applied to a q.p. dispersion either constructed at half-filling, as in Ref.[12], or phenomenologically obtained from our data (), and supplemented by nearest-neighbor attraction induced by antiferromagnetism, shows that extended -wave SC dominates over -wave SC. This corresponds to the “overdoped” regime (Fig.13a) i.e. to an overall density in the vicinity of [51]. This change in the symmetry of the SC state can be understood recalling once again that the tight-binding dispersion of the q.p., even including renormalized amplitudes, supplemented by a NN attraction, formally corresponds to an effective “” model. It is well-known that in this model the SC state symmetry changes from d- to s-wave as the density is reduced away from half-filling to a nearly empty system[49, 52]. Actually the bound state of two particles on an otherwise empty lattice with a NN tight binding dispersion and NN attraction is s-wave. To the extend that the AF- or NN-dispersions survive up to hole doping, as suggested by the numerical data of Sec.III as well as previous literature(Ref.[25] and references therein), scenarios based on the real-space interaction of q.p.’s predict a competition between extended s-wave and -wave SC in the regime. Recent calculations based on the analysis of the low electronic density limit of the model led to analogous conclusions[53]. Our approach is based on a very different formalism but it arrives to similar results, and, thus, a crossover from d- to s-wave dominated superconductivity in overdoped cuprates could occur. Indeed recent ARPES data for overdoped Bi2212 have been interpreted as corresponding to a mixing of s- and d-wave states[54]. More work should be devoted to this potential competition between d- and s-wave for overdoped cuprates.
VI Summary
In this paper the results of an extensive numerical study of the one band Hubbard model with have been presented. The regime of strong coupling was analyzed. These parameters are fixed to reproduce ARPES data for the AF insulator. With maximum entropy techniques the spectral function was studied for several electronic densities. It was observed that as the hole density grows away from half-filling, the quasiparticle band acquires “non-interacting” features although with bandwidths substantially smaller than for the limit. As the hole density increases the q.p. peak at rapidly changes its position relatively to the Fermi energy, in qualitative agreement with recent ARPES experiments[1, 2]. In the overdoped regime it is predicted that the flat bands should be crossed by the chemical potential and thus they should no longer be observed in ARPES studies. The present results also have implications for some theories of high-. The narrow q.p. band produces a large peak in the DOS induced by strong correlations, which survives the presence of hole doping and it can be used to boost once a source of hole attraction is found. It is remarkable that both with the hole dispersion found at half-filling or the one observed using QMC-ME at, e.g., , superconductivity in the channel dominates. This result gives support to real-space pairing theories of high-[12], showing that the main ideas of the scenario are stable upon the introduction of a finite hole density. The large DOS peak is crossed by the chemical potential as is reduced. In the overdoped regime, i.e. when the q.p. band is almost empty, a possible competition between extended-s and SC was discussed.
VII acknowledgments
We thank A. Sandvik, M. Onellion, D. Dessau, J. C. Campuzano, and Z. X. Shen for useful discussions. D. D. is supported by grant ONR-N00014-94-1-1031. A. M. and E.D. are supported by grant NSF-DMR-9520776. Additional support by the National High Magnetic Field Lab and Martech is acknowledged.
REFERENCES
- [1] D. S. Marshall, et al., Phys. Rev. Lett. 76, 4841 (1996).
- [2] H. Ding et al., Nature 382, 51 (1996).
- [3] S. LaRosa, I. Vobornik, H. Berger, G. Margaritondo, C. Kendziora, R.J. Kelley and M. Onellion, preprint.
- [4] B. O. Wells, Z.-X. Shen, A. Matsuura, D. M. King, M. A. Kastner, M. Greven, and R. J. Birgeneau, Phys. Rev. Lett. 74, 964 (1995).
- [5] M. Grioni, H. Berger, S. LaRosa, I. Vobornik, F. Zwick, G. Margaritondo, R. J. Kelley, J. Ma, and M. Onellion, Physica B, in press (1996).
- [6] For a review see E. Dagotto, Rev. Mod. Phys. 66, 763 (1994).
- [7] D.S. Dessau et al., Phys. Rev. Lett. 71, 2781 (1993); K. Gofron et al., Phys. Rev. Lett. 73, 3302 (1994); J. Ma et al., Phys. Rev. B 51, 3832 (1995).
- [8] S. Doniach et al., Phys. Rev. B 41, 6668 (1990); V. J. Emery et al., Nature 374, 434 (1995); and references therein.
- [9] Note that recent ARPES results found no evidence of small hole pockets in underdoped Bi2212 even in samples with a critical temperature as small as 15K. Thus, the presence of pocket features in ARPES is still under much discussion (See H. Ding, M. R. Norman, T. Yokoya, T. Takeuchi, M. Randeria, J. C. Campuzano, T. Takahashi, T. Mochiku, and K. Kadowaki, preprint).
- [10] A. Nazarenko, K. Vos, S. Haas, E. Dagotto and R. Gooding, Phys. Rev. B 51, 8676 (1995).
- [11] O. Starykh, O. de Alcantara Bonfim, and G. Reiter, Phys. Rev. B 52, 12534 (1995); B. Kyung and R. Ferrell, preprint; T. Xiang and J. M. Wheatley, preprint; T. K. Lee and C. T. Shih, preprint; V. I. Belinicher, A. L. Chernyshev, and V. A. Shubin, preprint; P. W. Leung, B. O. Wells, and R. J. Gooding, preprint.
- [12] E. Dagotto, A. Nazarenko and A. Moreo, Phys. Rev. Lett. 74, 310 (1995).
- [13] D. J. Scalapino, Phys. Rep. 250, 331 (1995).
- [14] A. Kampf and J. R. Schrieffer, Phys. Rev. B 41, 6399 (1990); ibid, Phys. Rev. B 42, 7967 (1990).
- [15] Q. P. Li, B. E. C. Koltenbah, and R. J. Joynt, Phys. Rev. B 48, 437 (1993).
- [16] C. C. Tsuei et al., Phys. Rev. Lett. 65, 2724 (1990); R. S. Markiewicz, J. Phys. Condens. Matt. 2, 6223 (1990); A. A. Abrikosov et al., Physica C 214, 73 (1993).
- [17] P. Aebi et al., Phys. Rev. Lett. 72, 2757 (1994).
- [18] S. Haas et al., Phys. Rev. Lett. 74, 4281 (1995).
- [19] S. LaRosa, R. J. Kelley, C. Kendziora, G. Margaritondo, M. Onellion, and A. Chubukov, preprint.
- [20] R. Blankenbecler, D. J. Scalapino, and R. Sugar, Phys. Rev. D 24, 2278 (1981).
- [21] R. N. Silver, D. S. Sivia, and J. E. Gubernatis, Phys. Rev. B 41, 2380 (1990). J. E. Gubernatis, et al., Phys. Rev. B 44, 6011 (1991).
- [22] R. Preuss, et al., Phys. Rev. Lett. 73, 732 (1994).
- [23] S. R. White, Phys. Rev. B 44, 4670 (1991). N. Bulut, D. J. Scalapino, and S. R. White, Phys. Rev. B 50, 7215 (1994).
- [24] R. Preuss, W. Hanke, and W. von der Linden, Phys. Rev. Lett. 75, 1344 (1995).
- [25] A. Moreo, et al., Phys. Rev. B 51, 12045 (1995).
- [26] D. Duffy and A. Moreo, Phys. Rev. B 52, 15607 (1995).
- [27] Care is needed when using this technique, since spurious features may arise in the spectral function. By monitoring the ME result for while systematically reducing , we were able to stop the ME analysis before spurious features arose. Furthermore, to check the convergence of the spectral function, several default models were used, and we found that all gave very similar results. For a complete discussion of the influence of the parameter see Ref. [21].
- [28] Note that the sign problem is most severe near optimal doping. Furthermore, the sign problem increases with coupling strength and with the magnitude of .
- [29] A. Chubukov, Phys. Rev. B 52, R3840 (1995); J. Schmalian, M. Langer, S. Grabowski, K. H. Bennemann, Phys. Rev. B 54, 4336 (1996).
- [30] M. Langer, J. Schmalian, S. Grabowski, K. H. Bennemann, Phys. Rev. Lett. 75, 4508 (1995).
- [31] S. Haas and E. Dagotto, Phys. Rev. B 54, R3718 (1996).
- [32] E. Dagotto, A. Nazarenko and M. Boninsegni, Phys. Rev. Lett. 73, 728 (1994).
- [33] R. Putz, R. Preuss, A. Muramatsu and W. Hanke, Phys. Rev. B 53, 5133 (1996).
- [34] Similar results have been recently obtained by M. Ulmke, R. T. Scalettar, A. Nazarenko and E. Dagotto, Phys. Rev. B 54, 16523 (1996), in the context of the 3D one band Hubbard model.
- [35] Upon completion of this manuscript we received a preprint by R. Eder, Y. Ohta and G. A. Sawatzky where exact diagonalization techniques applied to the model give results similar to ours regarding the behavior of the q.p. band near as the hole density grows away from half-filling.
- [36] N. Bulut, D. J. Scalapino and S. R. White, Phys. Rev. B 50, 7215 (1994).
- [37] Note that implicitly we are here assuming that the obtained by adding the numerically calculated ’s can be related with the density of states that would appear in a BCS gap equation. The difference resides in the matrix elements that modulate the intensity in photoemission calculations.
- [38] J. W. Loram et al., Phys. Rev. Lett. 71, 1740 (1993).
- [39] A. Fujimori et al., Phys. Rev. B 39, 2255 (1989); Phys. Rev. B 40, 7303 (1990).
- [40] J. M. Imer et al., Phys. Rev. Lett. 62, 336 (1989).
- [41] N. Bulut, D. J. Scalapino and S. R. White, Phys. Rev. Lett. 72, 705 (1994).
- [42] M. Troyer, H. Tsunetsugu, and T. M. Rice, Phys. Rev. B 53, 251 (1996). Note that pairing on ladders may exist (see E. Dagotto and T. M. Rice, Science 271, 618 (1996) and references therein). Thus, a gap may open at once couplings and lattice sizes are reached where pairing effects are important. We have observed such effects in our studies, but we also found that at the DOS has a sharp peak. Then, the numerically observed ladder DOS peak cannot be attributed exclusively to a BCS redistribution of spectral weight upon doping.
- [43] E. Dagotto, F. Ortolani and D. Scalapino, Phys. Rev. B 46, 3183 (1992).
- [44] E. Dagotto and J. R. Schrieffer, Phys.Rev. B 43, 8705 (1991).
- [45] R. Eder and Y. Ohta, Phys. Rev. B 50, 10043 (1994).
- [46] J. Riera and E. Dagotto, preprint.
- [47] Note also that the local character of the real-space potential does imply small Cooper pairs. Their size can be regulated using both its range intensity.
- [48] The critical temperature may be further enhanced if attraction at distances larger than one lattice spacing are considered. See for example S. Grabowski et al., Europhys. Lett. 34, 219 (1996).
- [49] R. Micnas et al., Rev. Mod. Phys. 62, 113 (1990).
- [50] See for example J. R. Schrieffer, J. Low Temp. Phys. 99, 397 (1995); S. Grabowski et al. (Ref.[48]); A. V. Chubukov et al., cond-mat/9701196; and references therein.
- [51] This is not in contradiction with the observation of d-wave SC at quarter filling reported in E. Dagotto and J. Riera, Phys. Rev. Lett. 70, 682 (1993), since these results were obtained at large .
- [52] E. Dagotto et al., Phys. Rev. B49, 3548 (1994).
- [53] B. E. C. Koltenbah and R. Joynt, preprint, Jan. 1996. See also D. van der Marel, Phys. Rev. B 51, 1147 (1995).
- [54] J. Ma, C. Quitmann, R. J. Kelley, H. Berger, G. Margaritondo, and M. Onellion, Science 267, 862 (1995).