The Adsorption of Atomic Nitrogen on Ru (0001): Geometry and Energetics
Abstract
The local adsorption geometries of the ()–N and the (R30∘–N phases on the Ru (0001) surface are determined by analyzing low-energy electron diffraction (LEED) intensity data. For both phases, nitrogen occupies the threefold hcp site. The nitrogen sinks deeply into the top Ru layer resulting in a N–Ru interlayer distance of 1.05 Å and 1.10 Å in the () and the ()R30∘ unit cell, respectively. This result is attributed to a strong N binding to the Ru surface (Ru–N bond length = 1.93 Å) in both phases as also evidenced by ab-initio calculations which revealed binding energies of 5.82 eV and 5.59 eV, respectively.
Submitted to Chem. Phys. Lett.
Keywords: LEED; ab-initio calculations, DFT; Ru (0001); nitrogen;
catalysis, Haber-Bosch synthesis
The rate-limiting step in the Haber-Bosch synthesis (ammonia synthesis) is represented by the dissociation process of molecular nitrogen over the active metal surfaces [1]. While for the Fe(111) surface the dissociative sticking coefficient of nitrogen is about 10-6 [2], the Ru surfaces exhibit only an exceedingly small sticking coefficient of about 10-12 at room temperature [3]. Yet, the promoted Ru catalyst is even more efficient than the industrially used Fe catalyst [4] since blocking of the surface by too much nitrogen and/or poisoning by traces of oxygen is less severe. Apart from the low sticking probability, the turn over rates of the ammonia reaction are determined by the energy barriers of adsorbed hydrogen and nitrogen to form NHx. This barrier is governed by the adsorption energy and the adsorption geometry of atomic nitrogen since N is much more strongly bound to Ru than H. In this Letter, we present the atomic geometry and energetics of the atomic nitrogen adsorbed on Ru (0001) at two distinct coverages by employing the techniques of low-energy electron diffraction (LEED) and density-functional theory (DFT).
The experiments were conducted in a UHV system (base pressure mbar) equipped with a 4-grid LEED optics, a CMA for Auger spectroscopy and a quadrupole mass spectrometer for thermal desorption spectroscopy (TDS). The Ru (0001) crystal could be heated resistively up to 1500 K and cooled to 130 K using liquid nitrogen; the temperature was measured with a NiCr–Ni thermocouple spot welded to the back of the sample. Further details about the experimental setup can be found elsewhere [7]. The Ru (0001) crystal was cleaned in a standard way by Ar+ sputtering and repeated cycles of oxygen exposure followed by annealing to 1560 K in order to remove carbon contamination. Since the dissociative sticking coefficient of molecular nitrogen is extremely small we used ammonia and its ability to decompose at the Ru (0001) surface above 350 K into atomic nitrogen and hydrogen which desorbs at the chosen sample temperature. Nevertheless, NH3 exposures of several thousands of Langmuirs were needed to accommodate substantial amounts of atomic nitrogen at the Ru surface.
More specifically, the atomic nitrogen overlayers were prepared by adsorbing ammonia, which is known to dissociate into N and NH already during chemisorption above the desorption temperature of NH3. There is a delicate balance for the uptake of atomic nitrogen: NH3 dosing at lower temperatures results in a higher saturation coverage of atomic nitrogen but at the expense of very high NH3 doses, while at higher adsorption temperature the uptake of atomic nitrogen takes place rapidly reaching a smaller saturation coverage. To get the required high N coverage on a reasonable time scale, the temperature was lowered step by step starting from 580 K to room temperature while dosing a total amount of about 20000 L of NH3 by backfilling the UHV chamber with mbar NH3. The specific protocol of NH3 dosing can be found in Ref. [8]. After this procedure it took typically 12 hours to retain a base pressure of mbar (the main constituent of the residual gas was still due to NH3) as ammonia easily sticks to and desorbs from the walls of the UHV chamber.
The ()R30∘ and () phases of nitrogen were prepared by dosing NH3 as described above and by heating the sample to 525 K and 615 K for the ()R30∘ and the () phase, respectively (heating rate 5 K/s). From HREELS measurements it is known that for temperatures beyond 500 K neither NH nor NH2 species are left on the surface [8].
After cooling the sample to 140 K LEED exhibited well-ordered () and ()R30∘ patterns. LEED I(V) curves were taken at normal incidence. Four fractional-order beams and two integer-order beams in an energy range from 50 eV to 300 eV were collected in the case of the (), three fractional-order beams and two integer-order beams in an energy range from 30 eV to 350 eV for the ()R30∘. The measurements were recorded on-line from the fluorescent screen of a display type 4-grid LEED optics by using a computer-controlled video-LEED system [9]. The experimental data were further processed by averaging over symmetrically equivalent beams, smoothing, and correcting for constant emission current.
Due to re-adsorption of NH3 from the residual gas it was necessary to heat the sample again to 525 K [()R30∘-N] or 615 K [()-N] after a cooling and measuring period of about 5 minutes. This precaution ensures that the NH3-induced changes in the LEED I(V) curves of fractional-order beams remained small as quantified by a Pendry r-factor [10] of RP 0.10; note that the experimental uncertainty due to re-preparation was found to be about R.
To evaluate the experimental I(V) data, fully-dynamical LEED calculations were performed using the program package of Moritz [11]. Nine spin-averaged, relativistically corrected phase shifts were used for the Ru substrate [12], and the phase shifts of nitrogen were taken from the literature [13] which have been already successfully applied to the analysis of molecular nitrogen on the clean and O-precovered Ru (0001) surface [14]. The influence of thermal vibrations on the LEED intensities was accounted for by correcting the phase shifts with a fixed effective Debye temperature of 400 K for the substrate and for nitrogen.
The agreement between experimental and calculated I(V) curves was quantified by the RDE factor introduced by Kleinle et al. [15] and by Pendry’s r-factor RP [10]. The refinement of structural parameters and of the real part of the muffin-tin zero was carried out by employing a nonlinear least-squares optimization scheme [16] based on the least-squares sum either of the LEED intensities or of the corresponding Y functions.
For the density-functional theory (DFT) calculations we employed the generalized gradient approximation (GGA) of Perdew et al. [17] for the exchange-correlation functional and used ab-initio pseudo-potentials created by the scheme of Troullier and Martins in the fully separable form [18]; the electronic wave functions were expanded in a plane-wave basis set. The surface was modeled using the supercell approach, incorporating five layers of Ru (0001) where the N atoms were adsorbed on one side of this slab [19]. Calculations were performed using a (), a ()R30∘ and a (11) surface unit cell with an energy cut-off of 50 Ry. The integral over the Brillouin zone was performed using a special k-point set [20], and care was taken to ensure an equivalent sampling in all (surface) geometries, with 9 k-points in the irreducible part of the (11) Brillouin zone. Fermi broadening of the occupation numbers was done with a width of 0.1 eV. The calculation scheme allows for simultaneous relaxation of the electrons and atoms, where we relaxed the positions of the N atoms and the atoms in the top Ru layer, keeping the lower three Ru layer spacings fixed at the bulk values.
To estimate the accuracy of the calculations, we studied the clean substrate Ru (0001) and the free N2 molecule. The lattice constant of Ru obtained turned out to be 2.78 Å, slightly larger than in experiments (2.71 Å) as usually observed with GGA. Therefore the c/a ratio was somewhat smaller than the experimental value, being 1.5755. When relaxing the (0001) slab, the outermost layer spacing contracts by about 3 %, a value which is also slightly larger than the experimental value of 21 % [21]. For the very strong bond of the N2 molecule we obtained a binding energy of 10.24 eV (not corrected for zero-point motion), a N–N bond length of 1.104 Å, and a N–N vibrational frequency of 2336 cm-1. These values compare well with the experiment of values of: 9.77 eV, 1.097 Å, and 2359 cm-1.
The LEED analyses were performed by placing the nitrogen in both phases in high-symmetry sites – i.e., bridge, on-top, threefold hollow fcc and hcp – and varying the N–Ru layer spacing, the topmost Ru–Ru layer distance as well as the lateral and perpendicular displacements in the top Ru layer as long as they are compatible with the symmetry of the unit cell. To explore a wide range of parameter space, we changed, in a first step, the principal structure parameter, i. e., the N–Ru layer spacing, from 0.5 Å to 2.5 Å in steps of 0.1 Å, keeping the other co-ordinates of the Ru atoms at those values found for the clean Ru (0001) surface. Starting from the optimum value of the N–Ru layer distance, we then performed an automated refinement varying the structural parameters mentioned above and the real part of the muffin-tin potential. The optimum r-factors reached for each of these high-symmetry configurations are compiled in Table I, from which it is obvious that in both phases the hcp site represents the actual adsorption site. This result is consistent with a recent STM study in which the adsorption site of nitrogen was determined by labeling hcp-sites with coadsorbed oxygen atoms [22].
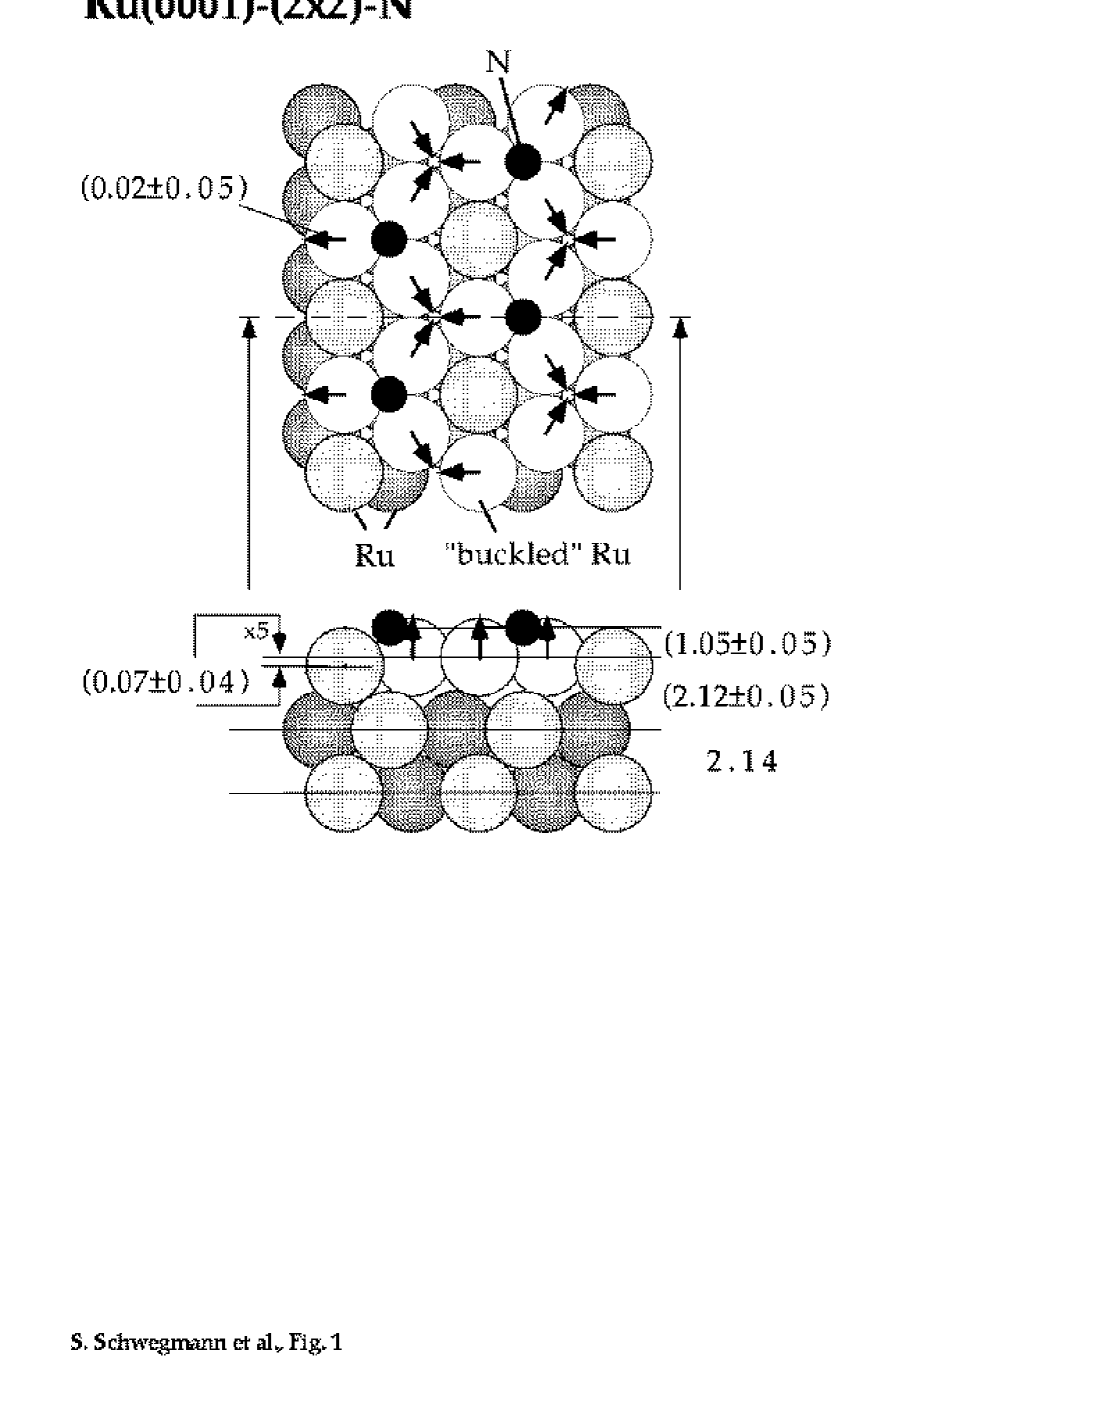
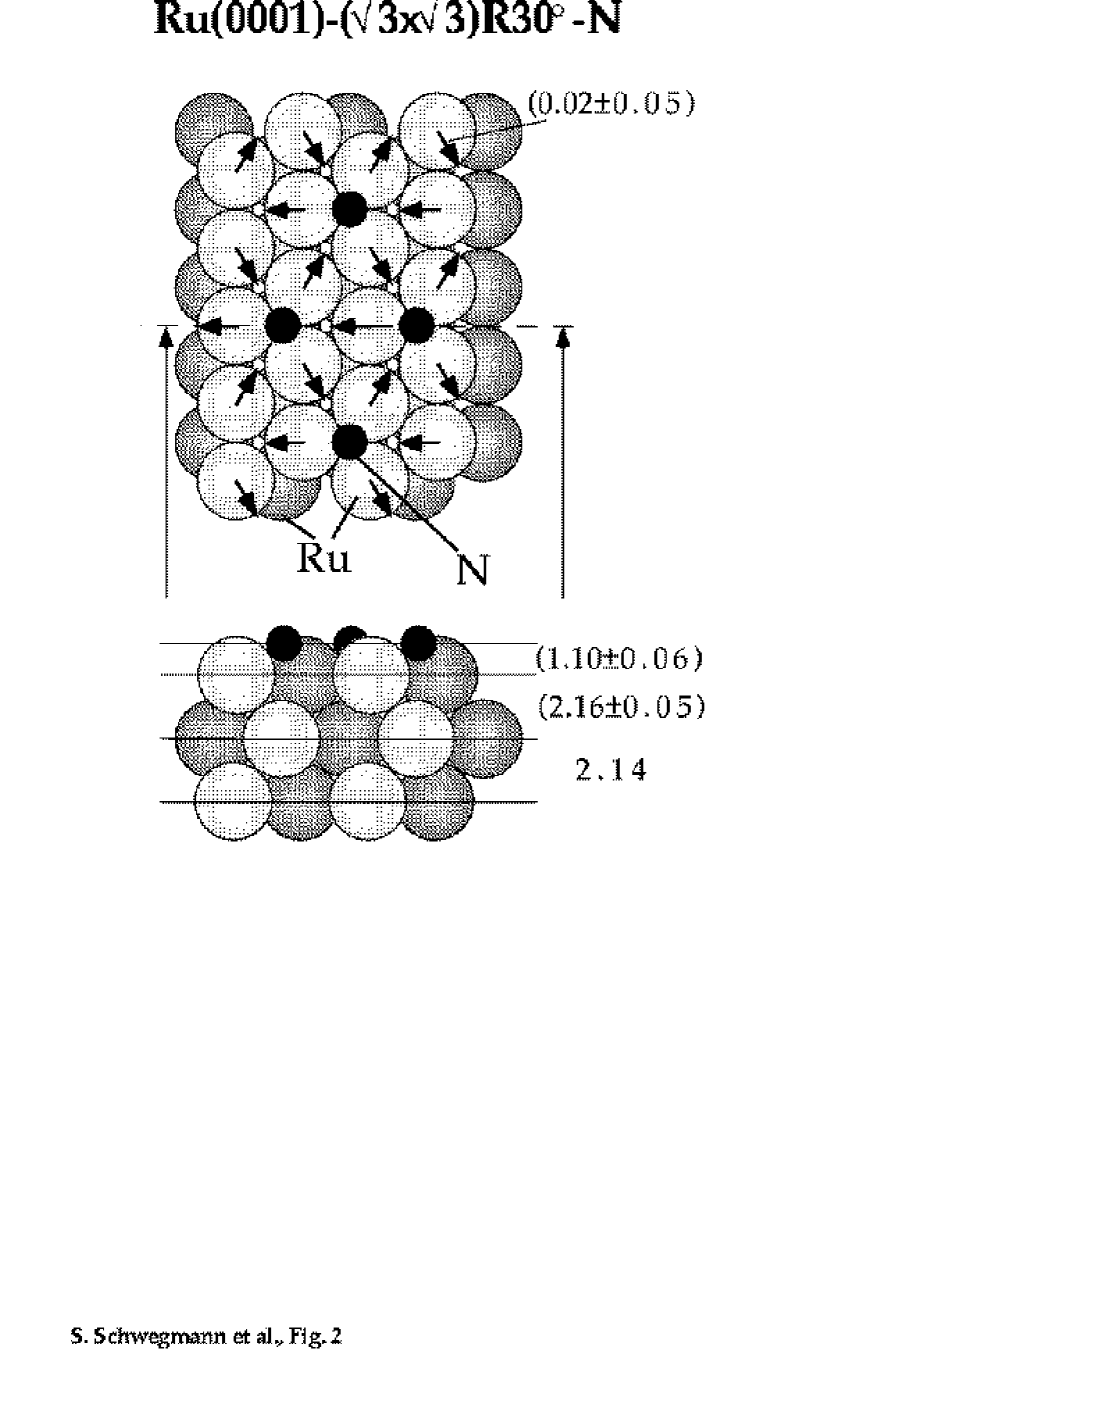
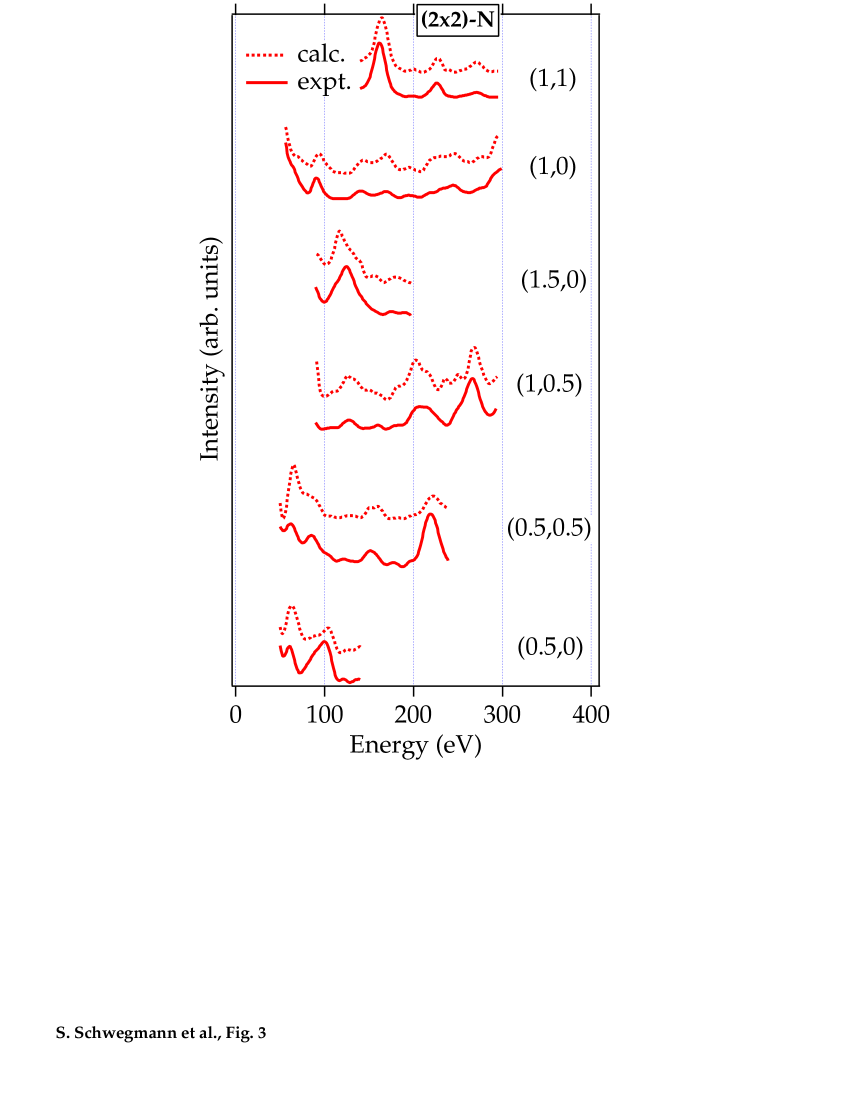
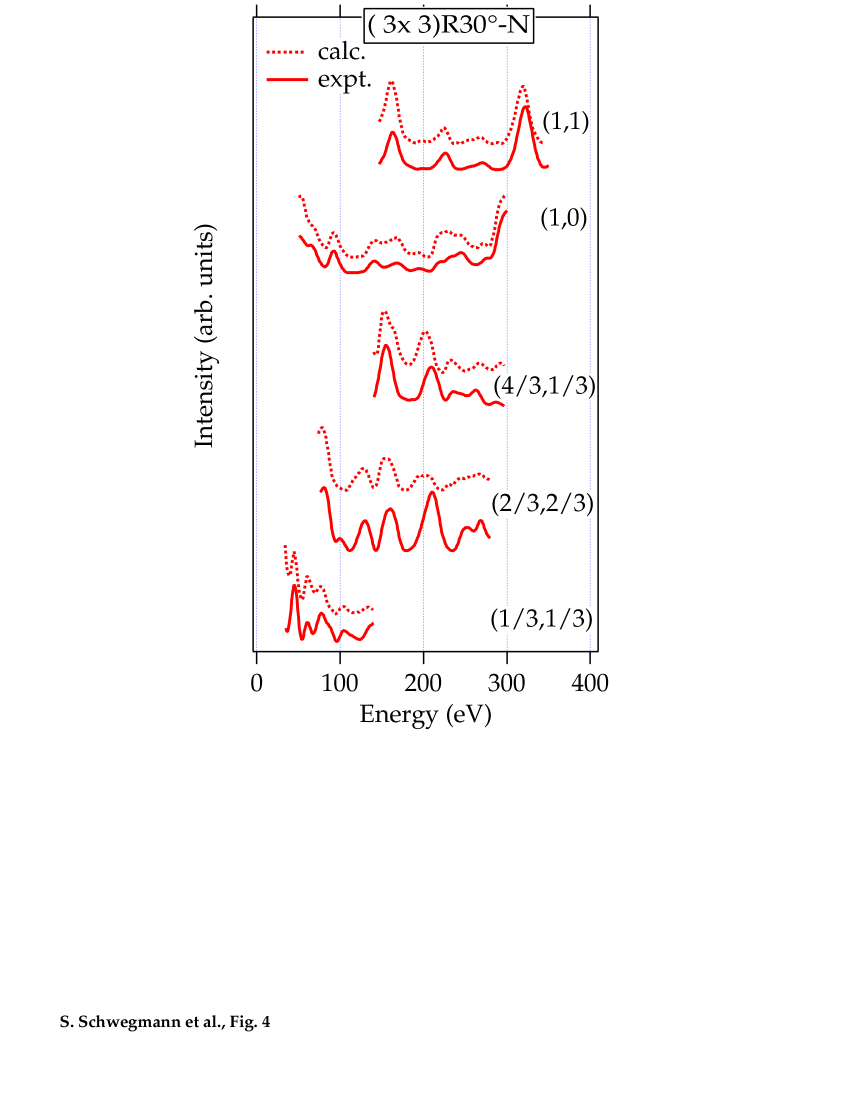
The structural parameters of the best-fit models are presented in Figs. 1 and 2, and the good agreement between calculated and experimental LEED IV data is illustrated in Figs. 3 and 4. The chemisorption of nitrogen induces small lateral displacements by 0.06 0.05 Å () and 0.02 0.05 Å ()R30∘ in the topmost Ru layer which are small if compared to corresponding displacements of about 0.1 Å due to the chemisorption of oxygen on Ru (0001) [23]. The N–Ru layer spacing turned out to be 1.05 Å and 1.10 Å in the () and the ()R30∘ phases, respectively. These values are substantially smaller than those found with oxygen phases (about 1.24 Å), which is attributed to a stronger bonding of N to Ru. In TDS, however, nitrogen comes off the surface in the temperature range from 500 K to 850 K, while oxygen desorbs above 1000 K. Yet, both experimental observations are not conflicting since the heat of formation of molecular nitrogen (9.77 eV) is much higher than that of molecular oxygen (5.16 eV). Note that TDS yields only information about the activation energy of desorption which, to a first approximation, is the difference of the Ru–X binding energy and one half of the binding energy of X2 (X either N or O). Ab-initio calculations presented here support this view and provide the Ru–N binding energies in the (22)-N, ()R30∘-N, and (11)-N phases to be 5.82 eV, 5.59 eV, and 4.90 eV, respectively, which are indeed higher than those found in the ()-O, (21)-O, and (11)-O phases (5.55 eV, 5.28 eV, and 4.80 eV) [24]. In all these cases, DFT calculations showed that adsorption takes place in the hcp site. Note that the (1x1)-N phase is not thermodynamically stable as discussed below.
In contrast to the ()-O and (21)-O phases on Ru (0001), which show a slight contraction of the top Ru-Ru layer spacing, the averaged top Ru–Ru interlayer spacing in the ()R30∘-N phase is slightly expanded by 1 % indicating that moderate amounts of nitrogen are sufficient to deplete the population of bonding d orbitals between the first and second Ru layer, thus removing the contraction of the clean Ru (0001) surface. The hard-sphere radii of N found on the Ru (0001) surface are 0.58 Å in both phases which compares well with values already found on other metal surfaces, such as Ni (110)-(23)-N (0.59 Å) [25], Cu (110)-(23)-N (0.62 Å) [26], and Rh (110)-(21)-N (0.57 Å) [27].
In Table II, the main structural parameters of both nitrogen phases obtained by ab-initio calculations are compared to those obtained by LEED. Within the quoted error bars these parameters are identical. Even details of the N structures are reconciled with DFT calculations such as the atomic displacements of the Ru atoms in the ()-N phase: While LEED revealed a rumpling of 0.07 0.04 Å and a lateral shift of 0.06 0.05 Å, DFT calculations determined these displacements to be 0.086 Å (vertical) and 0.067 Å (lateral). In addition to these experimentally observed N surface structures, DFT calculations for a hypothetical (11)-N structure were carried out. The Ru–N layer spacing (1.24 Å) turned out to be larger than that for the ()-N and the ()R30∘-N phases, and the Ru–Ru layer spacing is heavily expanded by 5.2 % with respect to the bulk value. This investigation was triggered by a recent DFT/LEED investigation of the (11)-O phase on Ru (0001) [24]. Also with the (11)-O structure it was found that the first Ru–Ru layer distance is substantially expanded by 3.5 %. The main difference between the (11)-N and the (11)-O phases on Ru (0001) is, however, that according to DFT calculations, the (11)-O is exothermic with respect to molecular oxygen, while the (11)-N phase is not. The binding energy of nitrogen in the (11) phase is only 4.52 eV which is by 0.6 eV smaller than half the formation energy of molecular nitrogen.
To determine the critical N-coverage which can be thermally stabilized on the Ru (0001) surface, we performed DFT calculations of the (2x1)-N and the (2x2)-3N overlayers assuming hcp-adsorption only. It turned out that nitrogen in the (2x1)-N is stabilized by 0.2 eV with respect to half the formation energy of N2, while nitrogen in the (2x2)-3N phase is endothermic by 0.2 eV. This result suggests the nitrogen saturation coverage to be about 0.5 (so far not observed in experiments) which is also compatible with the formation of heavy wall domain boundaries as proposed for N overlayers with coverages larger than 0.33 [8].
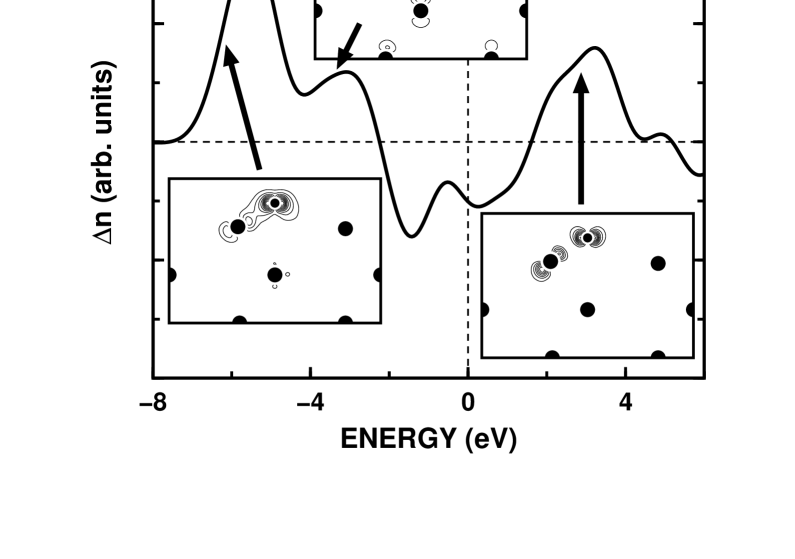
The strong bonding of nitrogen to Ru (0001) [exemplified for the (2x2)-N overlayer] can be explained most easily by using a simple two-level tight-binding model [28]. The same model has recently shown to work for O/Rh (110) [29] and O/Ru (0001) [30]. In this model the 2p orbitals of N interact with d-orbitals of Ru close to the Fermi energy (cf. Fig. 5), forming a bonding hybride at an energy slightly lower than of the 2p orbital of the free N atom and an anti-bonding hybride whose energy is 3 eV above the Fermi energy. The bonding hybride consists (mainly) of sp hybride orbitals of the N atom and d-like orbitals of the three nearest-neighbor Ru atoms, aligned along the bond axis between the N and Ru atoms. In the non-bonding hybride, at energies 3.5 eV 2.5 eV below Fermi, there are one-electron states with pz-character at the N atom and d character at the Ru atoms. Close to the Fermi energy many d-like orbitals have been emptied upon forming the anti-bonding hybride, at 3 eV above Fermi. The corresponding wave functions exhibit a distinct node between the N atoms and the nearest-neighbor Ru atoms thus indeed demonstrating anti-bonding character.
The strong bond of N on Ru (0001) relies on two effect. First, a binding hybride is formed, increasing the charge density at the N atom (as is consistent with the positive change of work function upon adsorption [31]). Second, the anti-bonding states are pushed above the Fermi level and hence do not weaken the adsorbate-substrate bond.
In conclusion, the atomic geometry of nitrogen adsorbed on Ru (0001) has been explored by making use of LEED and DFT calculation. Both techniques revealed that nitrogen atoms adsorb in the threefold hcp sites on Ru (0001), the Ru–N bond length in the ()-N and the ()R30∘-N phase being about 1.93 Å. The small Ru–N bond length is indicative of a strong binding which is also evidenced by DFT calculations, indicating binding energies of 5.82 eV and 5.59 eV for the ()-N and the ()R30∘-N phases, respectively. DFT calculations show that a hypothetical (11)-N phase on Ru (0001) is not stable thermodynamically, while a hypothetical (2x1)-N phase would be stable.
Acknowledgment: We thank C. Stampfl and M. Scheffler for valuable discussions.
REFERENCES
- [1] Corresponding author: Fax: +49 30 84135106, E-mail: over@fhi-berlin.mpg.de.
- [2] See e.g. a) H. Topsøe, M. Boudart and J.K. Nørskov, eds., in: Frontiers in catalysis: Ammonia synthesis and beyond. Topics in Catal. 1 (1994) 185.
- [3] a) F. Boszo, G. Ertl, M. Grunze and M. Weiss, J. Catal. 49 (1977) 18; b) F. Boszo, G. Ertl and M. Weiss, J. Catal 50 (1977) 519.
- [4] H. Dietrich, P. Geng, K. Jacobi and G. Ertl, J. Chem. Phys. 104 (1996) 275.
- [5] a) P.J. Shires, J. R. Cassata, B.G. Mandelik and C.P. Dijk, U.S. Patent 4479925; Oct. 30, 1984; b) F. Rosowski, O. Hinrichsen, M. Muhler and G. Ertl, Catal. Lett. 36 (1996) 229; c) O. Hinrichsen, F. Rosowski, M. Muhler and G. Ertl, Chem. Eng. Sci. 51 (1996) 1683.
- [6] H. Over, H. Bludau, M. Skottke-Klein, G. Ertl, W. Moritz and C.T. Campbell, Phys. Rev. B 45 (1992), 8638.
- [7] H. Dietrich, K. Jacobi and G. Ertl, accepted in J. Chem. Phys. (July 1996).
- [8] P. Heilmann, E. Lang, K. Heinz and K. Müller, in: Determination of surface structures by LEED, eds. P.M. Marcus and F. Jona (Plenum Press, New York, 1984), p. 463.
- [9] J.B. Pendry, J. Phys. C 13 (1980) 937.
- [10] W. Moritz, J. Phys. C 17 (1983) 353.
- [11] M Gierer, H. Over, G. Ertl, H. Wohlgemuth, E. Schwarz and K. Christmann, Surf. Sci. 297 (1993) L73.
- [12] R. Imbihl, R.J. Behm, G. Ertl, and W. Moritz, Surf. Sci. 123 (1982) 129.
- [13] a) H. Bludau, M. Gierer, H. Over and G. Ertl, Chem. Phys. Lett. 219 (1994) 452; b) H. Over, H. Bludau, R. Kose and G. Ertl, Chem. Phys. Lett. 243 (1995) 435.
- [14] G. Kleinle, W. Moritz, D.L. Adams and G. Ertl, Surf. Sci. 219 (1989) L637.
- [15] (a) D.W. Marquardt, J. Soc. Indust. Appl. Math. 11 (1963), 431; (b) G. Kleinle, W. Moritz and G.Ertl, Surf. Sci. 238 (1990), 119; (c) H. Over, U. Ketterl, W. Moritz and G. Ertl, Phys. Rev. B 46 (1992), 15438; (d) M. Gierer, H. Over and W. Moritz, unpublished.
- [16] J.P. Perdew, J.A. Chevary, S.H. Vosko, K.A. Jackson, M.R. Pederson, D.J. Singh and C. Fiolhais, Phys. Rev. B 46 (1992), 6671.
- [17] N. Troullier and J.L. Martins, Phys. Rev. B 43 (1993), 1991.
- [18] J. Neugebauer and M. Scheffler, Phys. Rev. B 46 (1992), 16067.
- [19] S.L. Cunningham, Phys. Rev. B 10 (1974) 4988; A.P. Seitsonen, unpublished.
- [20] G. Michalk, W. Moritz, H. Pfnür and D. Menzel, Surf. Sci. 129 (1983) 92.
- [21] J. Trost, T. Zambelli, J. Wintterlin, and G. Ertl, Phys. Rev. B (accepted for publication).
- [22] a) H. Pfnür, G. Held, M. Lindroos and D. Menzel, Surf. Sci. 220 (1990), 43; b) M. Lindroos, H. Pfnür, G. Held, and D. Menzel, Surf. Sci. 222 (1989), 451.
- [23] C. Stampfl, S. Schwegmann, H. Over, M. Scheffler and G. Ertl, Phys. Rev. Lett. (in press).
- [24] a) H.D. Shi, F. Jona, D.W. Jepson and P.M. Marcus, Surf. Sci. 60 (1976) 445; b) L. Wilde, N. Pangher and J. Haase, Surf. Sci. 316 (1994) L1093.
- [25] D.T. Vu and K.A.R. Mitchell, Phys. Rev. B 49 (1994) 11515.
- [26] M. Gierer, F. Mertens, H. Over, G. Ertl and R. Imbihl, Surf. Sci. 339 (1995) L903.
- [27] R. Hoffmann, Rev. Mod. Phys. 60 (1988) 601.
- [28] K. Stokbro and S. Baroni, submitted to Phys. Rev. B.
- [29] C. Stampfl and M. Scheffler, to be published.
- [30] H. Rauscher, K.L. Kostov, and D. Menzel, Chem. Phys. 177 (1993) 473.
| ()-N | ()R30∘-N | |
|---|---|---|
| on-top | 0.53 | 0.63 |
| bridge | 0.46 | 0.52 |
| fcc | 0.70 | 0.59 |
| hcp | 0.24 | 0.29 |
| method | LEED | DFT calculations | ||
|---|---|---|---|---|
| phase | ()-N | ()-N | ()-N | ()-N |
| Ru–N | () Å | () Å | 1.94 Å | 1.94 Å |
| Ru–N layer spacing | () Å | () Å | 1.08 Å | 1.12 Å |
| Ru expansion | () % | () % | 0 % | % |
| adsorption site of N | hcp | hcp | hcp | hcp |