[
Mesoscopic Behavior Near a Two-Dimensional Metal-Insulator Transition
Abstract
We study conductance fluctuations in a two-dimensional electron gas as a function of chemical potential (or gate voltage) from the strongly insulating to the metallic regime. Power spectra of the fluctuations decay with two distinct exponents ( and ). For conductivity , we find a third exponent () in the shortest samples, and non-monotonic dependence of and on . We study the dependence of , , , and the variances of corresponding fluctuations on , sample size, and temperature. The anomalies near indicate that the dielectric response and screening length are critically behaved, i. e. that Coulomb correlations dominate the physics.
pacs:
PACS Nos. 73.23.Ps, 73.40.Gk, 73.40.Qv, 71.30.+h]
The metal-insulator transition (MIT) is one of the fundamental problems in condensed matter science. Recent theoretical work [1] strongly suggests the crucial role played by electron-electron interactions in the transition regime. However, since the development of the scaling theory of localization [2], it has been asserted that all states are localized in 2D, in agreement with early experiments [3] on relatively low-mobility samples. A recent experiment [4] on a two-dimensional electron gas (2DEG) in Si metal-oxide-semiconductor field-effect transistors (MOSFETs) provides evidence for the existence of a true MIT. The samples used in that experiment [4] had a much higher mobility and, as a result, the Coulomb interactions played a greater role relative to disorder. Thus it has been speculated [4] that this MIT is driven by interaction effects. Using mesoscopic measurements, we provide direct evidence for the crucial role of Coulomb interactions at the MIT in a 2DEG.
We investigate the statistics of conductance fluctuations in a 2DEG as it undergoes a transition from strongly insulating to metallic behavior. In the insulating regime, electrons move in a strong, random potential by tunneling through localized states. In our relatively small samples and at low temperatures, the total number of states that contribute to conduction can be small, e. g. of the order of 50–100. By sweeping the gate voltage , the chemical potential is shifted relative to the energy of localized states. As a result, the number and nature of localized states that dominate the transport change, and the conductance changes up to several orders of magnitude. In addition, it is well established that, deep in the insulating regime, the density of states increases exponentially with increasing [5].
Our measurements were carried out on n-channel MOSFETs fabricated on the (100) surface of Si doped at acceptors/cm3 with 500 Å gate oxide thickness and (unintentional) oxide charge cm-2. The peak mobilities of our samples were of the order of 2 m2/Vs – comparable to those exhibiting a true MIT [4]. In contrast to those samples, ours are much smaller: rectangular with source-to-drain lengths m, and widths m. They were short enough to exhibit conductance fluctuations, and wide enough to ensure good statistics. Measurements were performed in a dilution refrigerator with a lock-in at Hz and an excitation voltage of V rms. Conductance was measured as a function of at temperatures K.
The behavior of the typical conductance, i. e. of (averaging over intervals of ), in these samples has been studied in detail [6]. At very low and for K, the conduction is due to resonant tunneling through channels containing a few localized states. At higher , the conduction proceeds via variable-range hopping along isolated chains of several hops, consistent with the model in Ref. [7]. The conductance of each channel depends not only on the energy and position of each localized state in the channel but also on the Coulomb interactions between electrons. At higher , the current paths become more complicated as more and more states contribute to conduction.
The conductance fluctuates on two, and sometimes three different scales of [6]. These scales are apparent in the raw data (see Fig. 1(a) inset), but a detailed statistical analysis is necessary for inferring the underlying physics. We have analyzed the power spectra of fluctuations for different ranges or conductivities , sample sizes, and temperatures. The power spectrum is a Fourier transform of the autocorrelation function . A typical power spectrum is presented in Fig. 1(a). There

are two distinct regions of exponential decay, , each corresponding to a Lorentzian with characteristic widths . The voltage correlation scales and represent the average peak spacings of the corresponding fluctuations. They are obtained by fitting both the low-frequency () and high-frequency () parts of separately by the above exponential form. , which separates the low-frequency part from the rest of the spectrum, does not depend on any of the parameters within the scatter of our data; mV, averaged over all of our measurements. Fig. 1(b) illustrates the evolution of the spectrum as increases. While the correlation voltage at the highest frequencies remains essentially unchanged (V) over a wide range of , we observe the emergence of a new distinct correlation voltage (i. e. a new Lorentzian in ) at intermediate frequencies. From Fig. 2, which plots the location of the

boundary between the intermediate-frequency and the highest-frequency regions (shown by the dash-dotted vertical line in Fig. 1(b)), we see that this new feature of is most pronounced for . It vanishes when the system becomes either more insulating or more metallic.
¿From the work on quantum dots and wires [8], and tunneling through localized states [9], it is known that Coulomb interactions give rise to peaks in conductance such that the peak spacing is determined by the strength of the interaction. Therefore, at least some of the measured correlation voltages should be proportional to the typical Coulomb energy in the system. As the MIT is approached from the insulating side, the Coulomb energy in our samples increases as a result of a decrease in the mean separation of the electrons. As the MIT is approached from the metallic side, also increases because the screening becomes less efficient [5, 10, 11]. Therefore, we expect to have a maximum in the transition region.
Obviously, it is important to analyze the evolution of the correlation voltages with in more detail. We start with the high-frequency () part. Fig. 3 presents and for several samples of different size. Fits to the decay rate are shown for
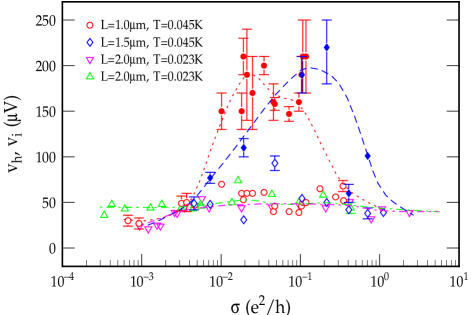
(solid symbols) and for (open symbols). For , this correlation voltage remains of the order of V, independent of sample size, , and even . For the shortest samples, however, the third correlation scale (solid symbols in Figs. 3 and 4) appears near . is observable only in the smallest samples, and it also disappears at higher , so it seems that this feature of vanishes as a result of averaging. goes through a dramatic (increasing by 400%) maximum near .
In order to characterize the fluctuations completely, we have also analyzed their variances . Fig. 4 shows how of the fluctuations for depends on in our smallest
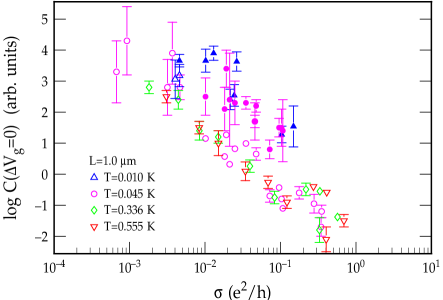
sample. For both types of fluctuations ( and ) in the high-frequency range, we observe a power-law decrease of with an increasing . For the highest-frequency fluctuations, we find no -dependence of the variance in any of our samples but we have evidence that is reduced by increasing the sample area. Although the variance of the intermediate-frequency fluctuations seems to decay with increasing , we do not have sufficient data to determine the functional form. For this part of the spectrum, seems to be suppressed rapidly by an increase of sample area.
In the low-frequency range (), the correlation scale has a maximum as a function of (Fig. 5), in a qualitative agreement with the expected behavior of . The maximum occurs again for . It is suppressed by increasing the sample size. The results obtained on two m samples with different point to the absence of area averaging
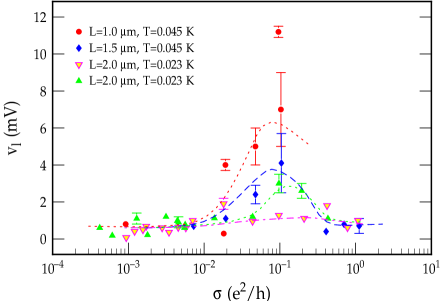
in . A rise in temperature shifts the peak to higher values of . For example, in our smallest sample (m and m) the peak moves from at K to at K. It should also be noted that is about 1–2 orders of magnitude larger than . for low-frequency fluctuations does not depend on any of the parameters that we have varied except that there seems to be a small decrease of as increases beyond .
The rate of the chemical potential shift with is [5] , where is the 2D electron density, and is the gate capacitance of our devices ( F/m2). Since it is not possible to relate to without an adequate theoretical model of transport, we are not able to obtain, for example, an accurate dependence of various correlation energies on . It is possible, however, to make some estimates, assuming that varies from its constant 2D value of cm-2eV-1 in the metallic regime down to about 10–20% of that value in the insulating limit.
With this in mind, we find that the voltage correlation scale of V, corresponding to the highest-frequency regime, varies from about 1.35 eV at low , to eV at the highest . In spite of a relatively weak dependence of correlation energy on , these fluctuations disappear eventually at high because of a decrease in their amplitude. It is interesting that these fluctuations are well resolved all the way up to 0.8 K even though their correlation energy is much smaller than which, while not intuitively plausible at first glance, is quite reasonable upon detailed consideration of this issue for a related problem [12]. Given that this is the smallest energy scale, hardly dependent on any of the parameters, and that these fluctuations are so ubiquitous, we are led to speculate that their correlation energy is related to the energy level spacing in our system. If true, it would correspond to a sample area of about m. This is somewhat smaller than the area of our devices but it is consistent with the fact that only a fraction of the sample dominates conduction, as discussed in the introduction. We recognize that there are other energy scales of importance in this problem, but without a detailed model for the transport, we must forgo further speculation.
In the same fashion, we find that the correlation energy of intermediate-frequency fluctuations, which appear only in the crossover regime, is of the order of 0.5–1 eV, also smaller than . For low-frequency fluctuations, the correlation energy varies from about 25 eV in the strongly insulating regime, to 45 eV in the transition region (assuming cm-2eV-1), down to 5 eV at the highest . Therefore, it appears that it has a maximum in the crossover regime. It is comparable to or larger than . In addition to having obtained qualitative agreement with the expected behavior of a Coulomb interaction energy, we can also make a reliable quantitative comparison in the most insulating regime, where in our devices is reduced only by screening by the metallic gate [13]. Then eV corresponds to a reasonable distance of 0.3 m, comparable to the mean separation (m) of localized states lying within an energy of a typical level spacing of . Using the same expression for in the case of intermediate-frequency fluctuations, eV gives a similar distance of 1 m. Even though, strictly speaking, this estimate is not quite accurate in the transition region, it could indicate that these fluctuations reflect some more subtle properties of the Coulomb interactions very close to the MIT, – perhaps related to the beginning of overlap between chains of states or more metallic islands – as a result of the competition of several important length scales.
In addition to three distinct correlation voltages, we have identified two characteristic voltage scales, and . is a measure of the width of the intermediate-frequency regime, observable most clearly in the crossover region. In energy units, varies from about 15 eV at low , to 0.6 eV in the transition region, up to about 1.5 eV at high . This indicates the existence of a minimum of this characteristic energy as is varied. Our current data also show a tendency for the minimal value of in Fig. 2 to go to zero as is lowered but more detailed measurements of the temperature dependence would be useful. On general grounds, one expects that the characteristic length scales, such as the localization length, will diverge at the MIT, and that the associated characteristic energy will go to zero. Our results for thus strongly support the existence of a MIT in this 2D system.
In summary, we have analyzed the power spectra of fluctuations as a function of . None of the non-interacting theories, which might be applicable to our experiment [14] within a limited range of , provide an adequate description of our findings, either because of the failure to predict the correct shape of the low-frequency part of the spectrum [15, 16] or because of the failure to describe the observed temperature dependence of the correlation voltages [7, 17]. But most importantly, general considerations based on non-interacting models [2] suggest monotonic behavior of all characteristic energy scales as a function of . In this paper, we present a striking finding of a strong nonmonotonic behavior of several energy scales, which may be understood by considering the effects of Coulomb interactions. Our experiment makes it absolutely clear that a theory that treats both disorder and electron-electron interactions on an equal footing is required in order to describe the MIT in this 2D system.
The authors are grateful to B. L. Altshuler, V. Dobrosavljević, A. B. Fowler, and B. B. Mandelbrot for useful discussions. This work was supported by NSF Grant No. DMR-9510355.
REFERENCES
- [1] V. Dobrosavljević and G. Kotliar, to be published in Phys. Rev. Lett. (1997); D. Belitz and T. R. Kirkpatrick, Rev. Mod. Phys. 66, 261 (1994).
- [2] E. Abrahams, P. W. Anderson, D. C. Licciardello, and T. V. Ramakrishnan, Phys. Rev. Lett. 42, 673 (1979).
- [3] D. J. Bishop, D. C. Tsui, and R. C. Dynes, Phys. Rev. Lett. 44, 1153 (1980); M. J. Uren, R. A. Davies, M. Kaveh, and M. Pepper, J. Phys. C 14, 5737 (1981).
- [4] S. V. Kravchenko, G. V. Kravchenko, J. E. Furneaux, V. M. Pudalov, and M. D’Iorio, Phys. Rev. B 50 8039 (1994); S. V. Kravchenko, Whitney E. Mason, G. E. Bowker, J. E. Furneaux, V. M. Pudalov, and M. D’Iorio, Phys. Rev. B 51, 7038 (1995); S. V. Kravchenko, D. Simonian, M. P. Sarachik, Whitney Mason, and J. E. Furneaux, Phys. Rev. Lett. 77, 4938 (1996).
- [5] T. Ando, A. B. Fowler, and F. Stern, Rev. Mod. Phys. 54, 437 (1982).
- [6] Dragana Popović, A. B. Fowler, and S. Washburn, Phys. Rev. Lett. 67, 2870 (1991).
- [7] L. I. Glazman and K. A. Matveev, Zh. Eksp. Teor. Fiz. 94, 332 (1988) [Sov. Phys. JETP 67, 1276 (1988)].
- [8] H. van Houten, C. W. J. Beenakker, and A. A. M. Staring, in Single charge tunneling: Coulomb blockade phenomena in nanostructures, ed. by Hermann Grabert and Michel H. Devoret (Plenum Press, New York, 1992).
- [9] V. V. Kuznetsov, A. K. Savchenko, M. E. Raikh, L. I. Glazman, D. R. Mace, E. H. Linfield, and D. A. Ritchie, Phys. Rev. B 54, 1502 (1996).
- [10] Gleb Finkelstein, Hadas Shtrikman, and Israel Bar-Joseph, Phys. Rev. Lett. 74, 976 (1995).
- [11] J. G. Massey and Mark Lee, Phys. Rev. Lett. 77, 3399 (1996).
- [12] K. B. Efetov, Phys. Rev. Lett. 74, 2299 (1995).
- [13] L. D. Hallam, J. Weis, and P. A. Maksym, Phys. Rev. B 53, 1452 (1996).
- [14] We have analyzed fluctuations of even though, strictly speaking, an analysis of would have been more appropriate at higher values of . This, however, affects only the results for variance.
- [15] M. É. Raikh and I. M. Ruzin, Zh. Eksp. Teor. Fiz. 92, 2257 (1987) [Sov. Phys. JETP 65,1273 (1987)].
- [16] P. A. Lee, A. Douglas Stone, and H. Fukuyama, Phys. Rev. B 35, 1039 (1987).
- [17] A. I. Larkin and K. A. Matveev, Zh. Eksp. Teor. Fiz. 93, 1030 (1987) [Sov. Phys. JETP 66, 580 (1987)].