The Equilibrium Shape of Quantum Dots
Abstract
The formation of dislocation-free three-dimensional islands during the heteroepitaxial growth of lattice-mismatched materials has been observed experimentally for several material systems. The equilibrium shape of the islands is governed by the competition between the surface energy and the elastic relaxation energy of the islands as compared to the uniform strained film. As an exemplification we consider the experimentally intensively investigated growth of InAs quantum dots on a GaAs(001) substrate, deriving the equilibrium shape as a function of island volume. For this purpose InAs surface energies have been calculated within density-functional theory, and a continuum approach has been applied to compute the elastic relaxation energies.
1. Introduction
When a materialaaa Here we consider the situation that the surface energy of the growing material is smaller than the surface energy of the substrate, resulting in the formation of a wetting layer and the Stranski-Krastanov growth mode. is grown on a lattice-mismatched substrate, the uniform strained film becomes unstable beyond some critical thickness. Strain relaxation can be achieved by the introduction of dislocations. However, there is another important and general mechanism of strain relaxation. For Ge/Si(001) Eaglesham and Cerullo[1] observed the formation of three-dimensional Ge islands that are dislocation-free. This change in surface morphology is driven by the gain in elastic relaxation energy of the islands, which overcompensates the energetical cost due to the increase of surface area. Provided the interface energy for dislocated islands is sufficiently large this was shown to yield the energetically preferred morphology as opposed to both the uniform film and dislocated islands for small island size.[2]
Formerly, the roughening of the surface during Stranski-Krastanov growth was considered a nuisance for device fabrication. Nowadays, the strain-induced self-assembly of small three-dimensional islands is in fact exploited to produce ordered arrays of quantum dots.[3] A frequently studied example[4, 5, 6, 7, 8, 9] is InAs/GaAs(001), the lattice mismatch amounting to about 7%. Quantum dots have attracted great interest due to their zero-dimensional electronic density of states.[10, 11] They may even be of technological importance; e.g., buried quantum dots are advantageous for improving the device properties of semiconductor lasers.[12]
The dispersion of the sizes of the InAs/GaAs(001) quantum dots is remarkably low.[6] This represents an important and desirable feature of quantum dot growth both in view of measurements and device applications, because the delta function shaped density of states of every single quantum dot is smeared out by ensemble averaging over the size distribution. However, despite its potential importance for the optimization of the quality of the quantum dot arrays, the details of the growth mechanism are not yet well understood. In particular, the reason behind the narrow size distribution, i.e. even the question whether it is due to kinetics or energetics, is still controversial.[13, 14, 15]
In this article we will focus on the equilibrium shape of coherent three-dimensional InAs islands. Knowledge of the equilibrium shape as a function of volume is an essential prerequisite for deciding upon the true growth mechanism. Though kinetic effects will be important, we expect three-dimensional islands in equilibrium to be observable under appropriate experimental conditions: When the concentration of quantum dots is low, diffusion of atoms on a single island should be faster than material exchange between the islands. Thus shape equilibration should occur on a timescale faster than that of Ostwald ripening. Conversely, if already the experimentally observed shape deviates from the equilibrium shape, equilibrium thermodynamics will not be adequate to describe the island size distribution under the respective growth conditions.
To calculate the equilibrium shape we have computed InAs surface energies for several surface orientations using density-functional theory. The elastic relaxation energy is calculated within continuum theory, applying a finite element approach. The total energy of the islands, including the strain field in the substrate, is given by the sum of these two energy contributions. All the more delicate effects,[14] like the strain-dependence of the surface energy and island-island interaction are neglected for the purpose of predicting island shapes at fixed volume.
2. Surface Energy
To determine the InAs surface energies we have carried out total-energy calculations within density-functional theory. The local-density approximation is applied to the exchange-correlation energy-functional, using Perdew and Zunger’s[16] parameterization of Ceperley and Alder’s[17] data for the correlation energy of the homogeneous electron gas. Surfaces are approximated by periodically repeated slabs. The InAs(111) surface, for example, is described by a supercell with a (22) surface unit-cell and 10 atomic layers, the topmost 4 of them being fully relaxed. The atoms in the remaining layers are kept fixed at their bulk positions, using the theoretical bulk lattice constant of 5.98 Å. The bottom surfaces of the slabs are saturated with hydrogen-like potentials.[18] For the Ga-terminated surfaces a Coulomb potential with atomic number , screened by electrons, has been used, while a Coulomb potential with has been taken for the As-terminated surfaces. The saturated surfaces are semiconducting without any surface states in the bulk band gap, in this way the interaction between both surfaces is made minimal.[19] For the polar (111) surface of GaAs the uncertainty of the total energy due to charge transfer from one side of the slab to the opposite side has been estimated to be less than 1.4 meV/Å2.[19] The In and As atoms are described by norm-conserving ab initio pseudopotentials[20], which are further transformed into fully separable Kleinman-Bylander[21] pseudopotentials, with the potential chosen as the local potential. The wavefunctions are expanded into plane waves with a kinetic energy 10 Ry, and the electron density is calculated using special -point sets with the density in reciprocal space being equivalent to 64 -points in the whole (100)(11) surface Brillouin zone. A generalized version of the computer code fhi93cp[22] has been employed.
To derive a surface energy from a total-energy calculation both the top and the bottom surface of the slab have to be equivalent. Such slabs can be constructed for, e.g., the (110) and the (100) orientation. The (111) and (1̄1̄1̄) surfaces of InAs, however, are necessarily inequivalent. This is an immediate consequence of the geometry of the zinc-blende structure: the bulk lattice can be regarded as a stacking of In–As double layers, which are cation and anion terminated towards the top and bottom surface of the slab, respectively. Chetty and Martin[23] solved this problem by introducing an energy density. While this energy density itself does not bear any physical significance, they showed that integrals over suitably chosen subvolumes of the supercell (e.g., volumes bounded by bulk mirror planes) lead to well-defined, physically meaningful quantities. In this way the total energy can be divided into a contribution from the upper and the lower part of the slab, and after subtracting the respective volume terms we get the surface energies of the top and bottom surface separately. This formalism has been implemented into the plane-wave code.[19]
Similar surface energy calculations for GaAs are described in Ref. [19]. As the InAs surface reconstructions are expected to be equivalent to those found for GaAs, we have chosen the same candidates for low-energy surface structures as discussed in that reference also for the present calculations. Furthermore, as epitaxial growth most often takes place under As-rich conditions, the energies in Tab. 1 refer to As-rich conditions, i.e., surfaces which are in equilibrium with bulk As.
| orientation | reconstruction | surface energy [meV/Å2] |
|---|---|---|
| (110) | (11) relaxed cleavage plane | 41 |
| (100) | (24) | 48 |
| (100) | c(44) | 47 |
| (111) | (22) In vacancy | 42 |
| (1̄1̄1̄) | (22) As trimer | 36 |
As opposed to the GaAs (110) the As-terminated InAs (110) (11) surface does not become stable. Independent of the chemical environment, for InAs always the relaxed cleavage surface is energetically preferred, displaying the well-known outward rotation of the As atom (see e.g. the low-energy electron-diffraction analysis for the (11) surface performed by Duke et al.[24]).
For the (100) orientation our calculation yields the c(44) reconstruction as the lowest energy surface-structure under As-rich conditions. However, as can be read from Tab. 1, the energy difference with respect to the (24) reconstruction is so small that our calculation is also compatible to the observation of a (24) reconstruction. Experimentally[25] the surface reconstruction has been reported to change from (24) to (42) as a function of As chemical potential; in our computations the (42) reconstruction comes out somewhat too high in energy to give such a transition. Further investigations are in progress.
Both for the (111) and the (1̄1̄1̄) orientation our predicted equilibrium reconstructions are consistent with recent core-level and valence photoemission studies.[26, 27] For the (111) the In-vacancy reconstruction is stable independently of the As chemical potential. The As-trimer reconstruction, which in case of the GaAs(111) becomes the equilibrium structure under As-rich conditions, is too high in energy for InAs to be competitive and thus does not become stable. On the (1̄1̄1̄) surface again both GaAs and InAs display the same As-trimer reconstruction in As-rich environment.
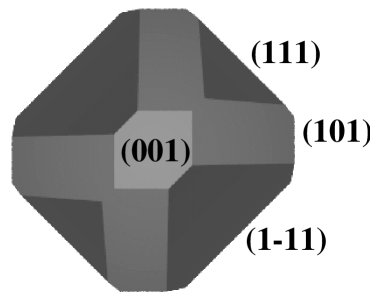
The equilibrium crystal shape (ECS) of InAs in As-rich environment displayed in Fig. 1 has been derived by applying the Wulff construction to the data in Tab. 1. As we know the surface energies only for the {110}, {100}, {111}, and {1̄1̄1̄} orientations we cannot exclude that additional high Miller-index surface orientations may appear on the ECS, but the low Miller-index surfaces are expected to be the most prominent ones. As a result we find that all four surface orientations co-exist on the ECS, which means that they are thermodynamically stable with respect to faceting into each other. This is in agreement with the shape of large, and thus presumably fully relaxed, InAs islands grown on a GaAs substrate by metal-organic vapour-phase epitaxy as observed by Steimetz et al.[28]
3. Elastic Relaxation Energy
The equilibrium shape of strained three-dimensional islands grown on a lattice-mismatched substrate has to be carefully distinguished from the equilibrium crystal shape described in the previous section. The optimum shape of a strained island, i.e., the shape that corresponds to its lowest total energy, is additionally controlled by elastic relaxation.
We have computed the elastic energy within a continuum theory. The strain field both in the island and in the bulk is fully accounted for. For simplicity we have taken the experimental second and third order elastic moduli for GaAs[29] to describe the elastic properties of both the island and the substrate. A test calculation with the linear elastic constants of InAs and GaAs has shown that this approximation does not affect any of our qualitative conclusions drawn with respect to the equilibrium shape. A finite element approach is applied to compute the displacement field and the strain tensor : The island and the slab representing the semiinfinite substrate are divided into small irregular tetrahedra. The displacement field is defined on the vertices of this subdivision, and in between a piecewise linear interpolation of is used. Thus the strain field calculated from is constant within each of the small tetrahedra. The elastic energy, which is calculated by summing the elastic energy density times the volume over all tetrahedra, is iteratively minimized with respect to . Above procedure is repeated for several finenesses of the subdivision, and the energies are extrapolated to fineness equal to zero.
The elastic energy of a truncated pyramid with volume can be approximated by a simple analytic expression once the elastic energy of the pyramid with the same side faces is known. Let denote the elastic energy of this pyramid with volume . ¿From the variational property of the elastic energy with respect to the displacement field the elastic energy of the truncated pyramid of volume is estimated by
| (1) |
with the integral denoting the elastic energy of that part of the pyramid which has been sliced off. In the following we are even going to neglect this integral. This still yields a good approximation to for any not too flat object, because the tops of the islands are almost fully relaxed. Finally, we make use of the scaling property of the elastic energy, , to transform the energy from back to the island volume :
| (2) |
The quality of this approximation can be judged from Fig. 3. The full lines, given by , pass through the data points (diamonds and squares, respectively) computed for truncated pyramids with two {111} and two {1̄1̄1̄} or four {101} faces.
4. Equilibrium Island Shape
To illustrate the basic physical mechanism we are first going to restrict ourselves to a very small part of configuration space, i.e., we consider a square based pyramid with four {101} facets and compare to the related truncated pyramids which are generated by slicing off the top, thus creating a mesa-shaped island with a (001) plane on top, and rescaling the lengths such that the volume is kept equal to the volume of the original pyramid.

When a truncated pyramid is created from a pyramid in this way the elastic energy has to increase, because material is taken away from the top of the island, where it is already almost fully relaxed, and deposited in the remaining mesa where it is still considerably strained. On the other hand, given the InAs-ECS from Sect. 2, the surface energy decreases. The optimum configuration therefore results from a competition between the elastic relaxation energy and the surface energy. The scaling properties of these two quantities, however, are different, the elastic energy being proportional to the volume while the surface energy increases with volume like . Therefore the surface energy gains more importance at small volume, while the elastic energy dominates at large volume.aaaFrom a practical point of view the volume interval where scaling makes sense is of course limited by atomistic effects for and the generation of dislocations at large volume . This explains the results displayed in Fig. 2: For small volume the total energy as a function of the height of the truncated pyramid has a minimum corresponding to some mesa-type shape. When the volume of the island increases, the elastic relaxation energy gains more influence and therefore this minimum becomes less pronounced and shifts towards the pyramidal geometry.
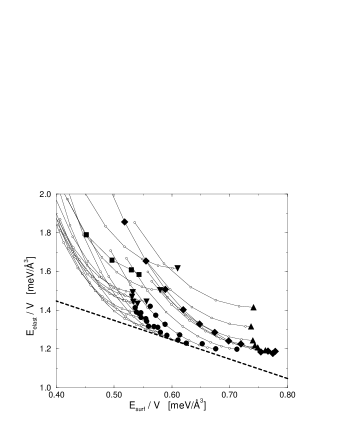
To derive the equilibrium island shape we have to account for the whole variety of possible island configurations. To this purpose we have calculated the elastic and surface energies for various arbitrarily shaped InAs islands bounded by {101}, {111}, and {1̄1̄1̄} facets. The results are displayed by filled symbols in Fig. 3. The elastic energies of the related (001)-truncated “mesa-shaped” islands have been derived by means of Eq. (2) as described in Sect. 3, the respective data being denoted by open circles in Fig. 3. The optimum shape at given volume corresponds to that point where the line of constant total energy touches the manifold of island energies from below. Even when the volume is changed, Fig. 3 can nevertheless still be used to derive the optimum shape: From the scaling relations we know that the ordinate does not change, while the abscissa has to be rescaled according to , i.e., only the slope of the total energy line decreases when the volume increases.
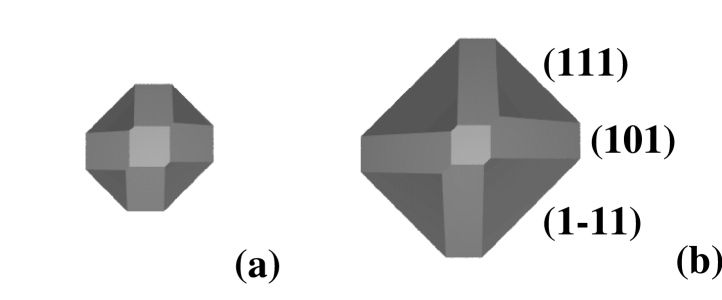
The equilibrium island shapes (see Fig. 4) are mesa-like hills bounded by {101}, {111}, and {1̄1̄1̄} facets and a (001) surface on the top, similar to a truncated ECS. Due to the different scaling properties of and the islands prefer a steeper and more pyramidal shape at larger volume while they tend to be flatter at small volume. E.g., in Fig. 4 it can be seen that in comparison to the steeper {111} faces the {101} faces are more extended on the small island than on the larger one. Our equilibrium island shapes differ from the {101}-pyramids grown experimentally by Ruvimov et al.[7] for yet unknown reason. They are, however, similar to the shapes of InP islands on GaInP observed by Georgsson et al.[30]
The equilibrium island shape evolves continuously with respect to the volume. Therefore the total energy of the equilibrium islands does not simply vary with volume like as would follow from simple scaling. Instead, when we represent the low-energy envelope of the data in Fig. 3 by , with and , and , , and independent of volume, and positive, we get the total energy per volume from the Legendre-transform of :
| (3) |
with some positive constant , i.e., the volume-exponent becomes smaller. Of course our approach which, e.g., disregards surface stress effects, still leads to Ostwald ripening by means of its construction. To discuss the possibility of an optimum island size one has to consider further elastic interactions.[14]
Acknowledgment
We thank E. Steimetz for helpful discussion and a copy of Ref. [28] prior to publication. This work was supported in part by the Sfb 296 of the Deutsche Forschungsgemeinschaft.
References
- [1] D. J. Eaglesham and M. Cerullo, Phys. Rev. Lett. 64, 1943 (1990).
- [2] D. Vanderbilt and L. K. Wickham, in Evolution of Thin-Film and Surface Microstructure, MRS Symposia Proceedings No. 202, edited by C. V. Thompson, J. Y. Tsao, and D. J. Srolovitz (Material Research Society, Pittsburgh, 1991), p. 555.
- [3] N. N. Ledentsov, in Proceedings of the 23rd International Conference on the Physics of Semiconductors, edited by M. Scheffler and R. Zimmermann (World Scientific, Singapore, 1996), p. 19.
- [4] C. W. Snyder, B. G. Orr, D. Kessler, and L. M. Sander, Phys. Rev. Lett. 66, 3032 (1991).
- [5] D. Leonard et al., Appl. Phys. Lett. 63, 3203 (1993).
- [6] J. M. Moison et al., Appl. Phys. Lett. 64, 196 (1994).
- [7] S. Ruvimov et al., Phys. Rev. B 51, 14766 (1995).
- [8] V. Bressler-Hill et al., Phys. Rev. Lett. 74, 3209 (1995).
- [9] P. M. Petroff and G. Medeiros-Ribeiro, MRS Bulletin 21, 50 (1996).
- [10] M. Grundmann et al., Phys. Rev. Lett. 74, 4043 (1995).
- [11] M. Grundmann, O. Stier, and D. Bimberg, Phys. Rev. B 52, 11969 (1995).
- [12] N. Kirstaedter et al., Electronics Letters 30, 1416 (1994).
- [13] C. Priester and M. Lannoo, Phys. Rev. Lett. 75, 93 (1995).
- [14] V. A. Shchukin, N. N. Ledentsov, P. S. Kop’ev, and D. Bimberg, Phys. Rev. Lett. 75, 2968 (1995).
- [15] D. E. Jesson, K. M. Chen, and S. J. Pennycook, MRS Bulletin 21, 31 (1996).
- [16] J. P. Perdew and A. Zunger, Phys. Rev. B 23, 5048 (1981).
- [17] D. M. Ceperley and B. J. Alder, Phys. Rev. Lett. 45, 566 (1980).
- [18] K. Shiraishi, J. Phys. Soc. Jap. 59, 3455 (1990).
- [19] N. Moll, A. Kley, E. Pehlke, and M. Scheffler, Phys. Rev. B 54, 8844 (1996).
- [20] G. B. Bachelet, D. R. Hamann, and M. Schlüter, Phys. Rev. B 26, 4199 (1982).
- [21] L. Kleinman and D. M. Bylander, Phys. Rev. Lett. 48, 1425 (1982).
- [22] R. Stumpf and M. Scheffler, Comput. Phys. Commun. 79, 447 (1994).
- [23] N. Chetty and R. M. Martin, Phys. Rev. B 45, 6074 (1992).
- [24] C. B. Duke, A. Paton, A. Kahn, and C. R. Bonapace, Phys. Rev. B 27, 6189 (1983).
- [25] H. Yamaguchi and Y. Horikoshi, Phys. Rev. B 51, 9836 (1995).
- [26] L. O. Olsson et al., Phys. Rev. B 53, 4734 (1996).
- [27] C. B. M. Andersson et al., Surf. Sci. 347, 199 (1996).
- [28] E. Steimetz, F. Schienle, J.-T. Zettler, and W. Richter, J. Cryst. Growth (in press).
- [29] Data in Science and Technology, Semiconductors, Group IV Elements and III-V Compounds, edited by O. Madelung (Springer, Berlin, 1991).
- [30] K. Georgsson et al., Appl. Phys. Lett. 67, 2981 (1995).