New features in the microwave response of crystals : Evidence for a multi-component order parameter
Abstract
New features are reported in precision measurements of the complex microwave conductivity of high quality crystals grown in crucibles. A third peak in the normal conductivity, , at around , and enhanced pair conductivity below are observed. The data are inconsistent with a single order parameter, and instead are indicative of multi-component superconductivity. Overall, these results point to the presence of multiple pairing interactions in and also provide a natural explanation to account for the low temperature conductivity peak observed in all crystals.
PACS: 74.25.Nf, 74.72.-h, 74.72.Bk
The mechanism for superconductivity and the nature of the superconducting state in the cuprates continue to be prime issues that are being debated [1]. Microwave measurements have yielded important information on the nature of the pairing, the quasiparticle density of states and scattering in the cuprate superconductors [2, 3, 4]. Surface impedance of single crystals in the past have consistently shown two features: A linear penetration depth () over a limited low range, and the presence of a bump in the surface resistance which results in a peak in the normal conductivity at well below the superconducting [2, 5]. The former behavior has been attributed to order parameter symmetry or in general, the presence of nodes in the gap. A rapidly decreasing quasiparticle scattering rate below has been proposed to account for the latter feature [5, 6]. There is a general consensus that the experimental results can be explained in the framework of a single order parameter with inclusion of effects due to strong coupling, scattering with strong temperature dependence, and fluctuations[5, 7].
In this paper, we present new results on the microwave response of high quality single crystals grown by a new method which avoids crucible corrosion. We measure the temperature dependent surface impedance and penetration depth () from which we extract the complex conductivity . The two features mentioned above, at low and the peak in are still present in these crystals. However in addition, a new peak in at and a distinct increase in below are observed. A single order parameter is insufficient to describe the new data, and instead we show that an analysis in terms of two-component superconductivity is necessary.
The single crystals (typically in size) used in this work were of very high quality grown from crucibles [8]. This growth method leads to crystals with extremely clean surfaces and exceptional purity exceeding [9] in contrast to crystals grown in other crucibles which have final reported purities of [10, 11]. As shown in this paper, this difference in purity appears to play a significant role in the microwave properties. Standard oxygen annealing procedures were followed to obtain optimally doped crystals with oxygen stoichiometry around [12]. The crystals have , and very sharp transitions in and SQUID magnetic susceptibility measurements. Crystals grown by this method also have unique physical properties due to their exceptional purity, as revealed in other experiments [13, 14]. Unlike the case in earlier crystals, the vortex lattice was imaged for the first time in with a low temperature STM [13]. Specific heat measurements indicated extremely sharp jumps at [14].
Three crystals of optimally doped grown in crucibles (hereafter called ) were measured. In addition, measurements on a crystal (of comparable dimensions) grown in the commonly used yttria-stabilized zirconia( crucible (hereafter called ) are also presented for comparison.
The high precision microwave measurements were carried out in a cavity using a “hot finger” technique [15]. This method has been extensively validated for precision measurements of the surface impedance in cuprate [3] and other superconductors. All measurements reported in this paper were carried out with the microwave field so that currents flow predominantly in the planes. Any influence due to properties [4] or finite size effects are minimal as the results obtained on three samples with slightly different dimensions and varying edge geometries were identical.
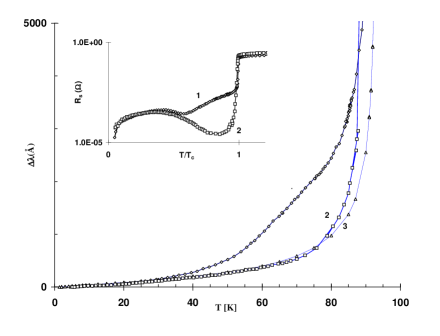
The dependence of of and crystals are shown in Fig.1. The data for the new high purity crystals clearly reveal a new feature - a bump or plateau in the vicinity of , which has not been reported in any previous data for crystals. A plateau in similar to that observed here has been reported in films and was attributed there to a 2-gap behavior [16].
The surface resistance is also displayed in Fig.1 as a function of . At low temperatures all samples showed the non-monotonic behavior in that is well-known and the low temperature values are comparable to that seen previously [5, 6]. However at intermediate temperatures, a new feature is seen - a shoulder in in the sample which is completely absent in the sample. We emphasize that the data for is representative of that reported in literature[5, 2, 17].
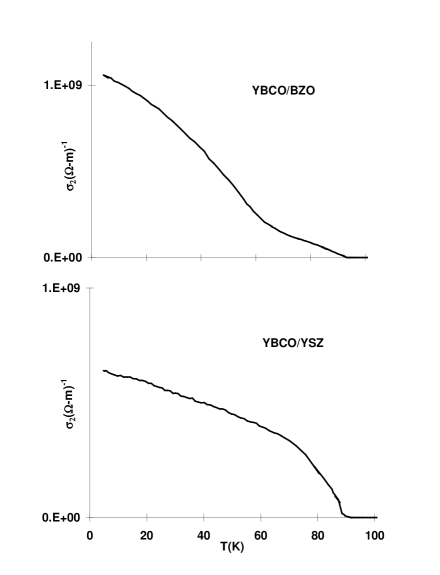
These new features are best studied in terms of the complex conductivity . The pair conductivity vs. is shown in Fig.2, and is a measure of the superfluid density , since . Although only changes and correspondingly are measured in the experiment, the absolute value of and hence are obtained by assuming the normal state at and slightly above . This procedure yields a consistent value of for all the crystals and a value of for the crystal. The data indicates an additional onset of pair conductivity below around , never observed in previous crystals reported to date as is evident from the comparison with the plot for the crystal. Also the pair conductivity rises to a higher value in the grown crystals compared with the grown crystals. All the crystals showed this feature in the data. While the accuracy of , the uncertainty in is much larger, perhaps of order . Nevertheless, the results are consistent with a lower and hence enhanced pair conductivity in the crystals compared with the crystals.
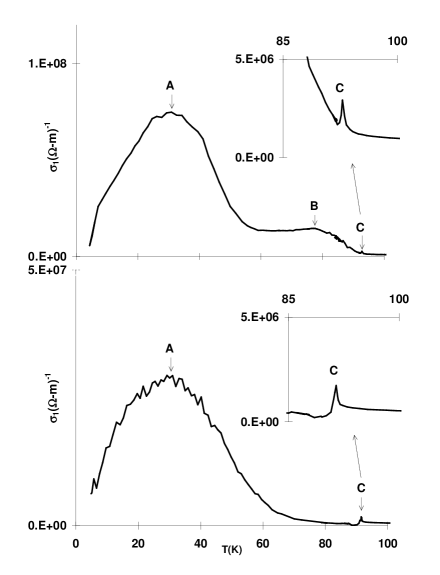
The resultant plot of the normal conductivity is shown in Fig.3. The low temperature peak at around (labeled ) is observed in several previous measurements on crystals [5, 6]. Note that very near a sharp peak (labeled ) is also present (see insets to Fig.3) in all and samples and which is often attributed to fluctuations [17]. The sharpness of these peaks in the crystals attests to the high quality of these crystals. The most striking feature is a new (third) conductivity peak (labeled ) clearly visible in the data centered at approximately (), which has not been reported previously in microwave measurements.
It is clear that the crystals reveal two new and important features in the data - (i) the additional enhancement of pair conductivity with an onset around , indicative of enhanced pairing below this temperature, and (ii) the new third normal conductivity peak at around () in . The former was observed in all the crystals, while the peak in is more sensitive to sample details, particularly the normal state scattering, and was lower in one of the samples which had the highest .(Details of results on the other and also on specially oxygenated crystals will be published elsewhere).
The data of Fig.1 for the new samples is difficult to describe using a single order parameter below . This is evident from the curve for obtained from a weak-coupling d-wave calculation shown in Fig.3.
In the “hydrodynamic” limit, . A single peak in can arise from a combination of increasing and decreasing as is lowered. Except for detailed dependences on , this peak should occur for an s- or d-wave superconductor and even in a two-fluid model. (The BCS coherence peak for an s-wave superconductor is masked by this effect). In order to describe the conductivity data in earlier crystals [5, 18] in the framework of a d-wave model, one needs a dramatic drop in the scattering rate below . However any model using a single gap or order parameter (s- or d-wave) will only lead to a single conductivity peak, in disagreement with the present data.
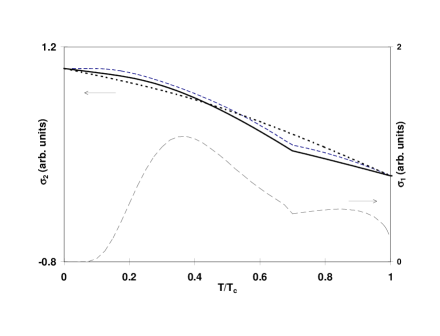
Instead it is necessary to consider a two-component system to understand the new data. The new feature in the data suggests that there is additional pairing of carriers below approximately . The essential features of the data can be well described by a simple model of two superconducting components with and . We have calculated the total conductivity . For ease of calculation we used s-wave order parameters for both the and components to calculate the conductivities using Mattis-Bardeen expressions. In the case of , calculations assuming and which is closer to the realistic case are also presented. Gap values of and were used. For , temperature dependent scattering times , with were assumed. The calculations reproduce the essential features of the data , viz. the onset of pairing around observed in and the 2 peaks in , as shown in Fig.4. Although we have used two decoupled components in the above model for illustrative purposes, a small attractive coupling between the two components is probably essential. It is easy to show in the framework of Ginzburg-Landau theory [19] that such coupling does not change the results much, and the essential features of the data are retained in more elaborate models.
The microwave measurements do not directly yield the symmetry of the order parameter in the and components, except as can be inferred from the temperature dependence of the data. The fact that is linear at low temperatures would indicate that pairing in component could be d-wave like, exhibiting nodes in the gap. Several theories have suggested the strong possibility of a mixed state in the presence of orthorhombic distortion as is the case in [20, 21], and detailed BCS calculations, such as those in ref.[20] of coupled s-d mixtures do yield penetration depth ( vs. ) curves similar to the present data.
It is tempting to assign the two superconducting components and with the associated condensates residing on planes and chains respectively in the system. However such an interpretation might be inappropriate given the facts that the crystals are twinned and microwaves probe a length scale spanning several hundred unit cells. Instead the two sets of condensates may originate from different types of pairing associated with different regions of the Fermi surface. Such a scenario based on band structure taking into account the chain-plane coupling in and eventually leading to two types of pairing interactions has been proposed[21].
Our results resolve an important issue regarding the origin of the conductivity peak at . While in previous cases, it was necessary to invoke a precipitous drop in the scattering rate to account for its location, it is natural from Figs.2 and 3 to associate the low () peak with the A- ( component and not the B ( component. The location at () is now not unreasonable for a conductivity peak associated with onset of pairing at . This implies that the type- condensate is present in the samples also but has a weaker, almost gapless, temperature dependence. We therefore believe that the same mechanisms were operating in earlier samples also but are clearly distinguished in the new crystals.
A natural suspicion that arises is whether the data in the new crystals arise from inadequate oxygen annealing leading to macroscopic chemical phase separation. It is important to note that the annealing procedures for the crystals were exactly the same as for the crystals [12]. An estimate suggests that the data cannot be explained by macroscopic segregation of an phase and an ideal phase. For one would require of the phase which cannot however account for the relative weights of the two components in our data. Instead, our data points to a physical mechanism like interlayer coupling rather than to chemical segregation for our results.
In conclusion, measurements of the microwave properties of ultra-pure crystals reveal new features suggesting the presence of two superconducting components in this compound. Our work provides a possible explanation for the microwave conductivity peak, and yields new insights into the pairing mechanism in the high temperature superconductors.
Work at Northeastern was supported by NSF-DMR-9623720, and at Geneva by the Fonds National Suisse de la Recherche Scientifique. We thank R.S. Markiewicz, A. Junod and J. Halbritter for useful discussions, D.P.Choudhury and Z.Zhai for assistance.
REFERENCES
- [1] J. R. Kirtley, C. C. Tsuei, and L. S. Yu-Jahnes, Nature 373, 225 (1995).
- [2] W. N. Hardy et al., Phys. Rev. Lett. 70, 3999 (1993).
- [3] T. Jacobs et al., Phys. Rev. Lett. 75, 4516 (1995).
- [4] S. F. Lee et al., Phys. Rev. Lett. 77, 735 (1996).
- [5] T. Jacobs et al., J. Phys. Chem. Solids 6, 1945 (1995).
- [6] D. A. Bonn, P. Donsajh, R. Liang, and W. N. Hardy, Phys. Rev. Lett. 68, 2390 (1992).
- [7] P. J. Hirschfeld, W. O. Putikka, and D. J. Scalapino, Phys. Rev. B 50, 10250 (1994).
- [8] A. Erb, E. Walker, and R. Flükiger, Physica C 245, 245 (1995).
- [9] A. Erb, E. Walker, and R. Flükiger, Physica C 258, 9 (1996).
- [10] H. Ikuta and D. M. Ginsberg, J. Supercond. 9, 259 (1996).
- [11] H. Casalta et al., Physica C 258, 321 (1996).
- [12] A. Erb, E. Walker, and R. Flukiger, Physica C 259, 83 (1996).
- [13] I. Maggio-Aprile et al., Phys. Rev. Lett. 75, 2754 (1995).
- [14] M. Roulin, A. Junod, A. Erb, and E. Walker, J. Low Temp. Phys. 105, 1099 (1996).
- [15] S. Sridhar and W. L. Kennedy, Rev. Sci. Instrum. 59, 531 (1988).
- [16] N. Klein et al., Phys. Rev. Lett. 71, 3355 (1993).
- [17] S. M. Anlage, J. Mao, and J. L. Peng, Phys. Rev. B 53, 2792 (1996).
- [18] P. J. Hirschfeld, W. O. Putikka, and D. J. Scalapino, Phys. Rev. Lett. 71, 3705 (1993).
- [19] J. Betouras and R. Joynt, Europhys. Lett. 31, 119 (1995).
- [20] C. O’Donovan and J. P. Carbotte, Phys. Rev. B 52, 16208 (1995).
- [21] R. Combescot and X. Leynoras, Phys. Rev. Lett. 75, 3732 (1995).