Subj-class: Material Science
[
The structure and phase stability of CO adsorbates on Rh(110)
Abstract
The structure of CO adsorbates on the Rh(110) surface is studied at full coverage using first-principles techniques. The relative energies of different adsorbate geometries are determined by means of accurate structure optimizations. In agreement with experiments, we find that a – structure is the most stable. The CO molecules sit on the short-bridge site (carbon below) with the molecular axis slightly tilted off the surface normal, along the (001) direction. Configurations corresponding to different distributions of tilt angles are mapped onto an anisotropic 2D Ising model whose parameters are extracted from our ab-initio calculations. We find that an order-disorder phase-transition occurs at a temperature .
Keywords: Chemisorption; Rhodium; Carbon mono-oxide; Surface thermodynamics; Density functional calculations; Ising models
pacs:
PACS numbers: 68.35.Md 68.35.Bs 82.65.My 82.65.Jv]
I Introduction
Rhodium surfaces are attracting a wide scientific and technological interest due to their catalytic properties, particularly because they act so as to reduce the energy activation barrier for the reaction , and thus to eliminate the two poisonous CO and NO gases from the pollution emission of combustion engines.
The stable structure of the Rh(110) clean surface is unreconstructed. However, if prepared in a convenient way with oxygen adsorption it may also present—upon thermal desorption—meta-stable , missing- or added-row structures which revert to the unreconstructed one at temperatures above [1, 2, 3].
The adsorption of CO molecules on Rh(110) has been studied by means of a variety of techniques [4, 5, 6, 7, 8, 9, 10, 11, 12]. The adsorption of monolayer (ML) of carbon monoxide on the unreconstructed surface results in a p2mg structure, with the C atom bound in the short bridge sites along the direction, and the molecular axis alternatively tilted with respect to the surface normal, towards direction [9]. In Ref. [6], the p2mg LEED pattern was reported to disappear at temperatures higher than , well below the desorption of CO from the surface. This fact was tentatively explained in terms of an order-disorder phase-transition.
In this paper the structure and phase stability of one ML of CO molecules adsorbed on the Rh(110) surface are studied from first principles and by mapping the low-lying energy configurations corresponding to the different distributions of tilt angles onto an anisotropic 2D Ising model. The latter is then simulated using a standard Metropolis Monte Carlo algorithm. The order-disorder transition temperature estimated from our simulations is , in fair agreement with experimental findings [6].
II Computational method
Our calculations are based on density functional theory within the local-density approximation (LDA) [13, 14], using Ceperley-Alder correlation energies [15]. The one-particle Kohn-Sham equations are solved self-consistently using plane-wave (PW) basis sets in a pseudopotential scheme. Because of the well known hardness of the norm-conserving (NC) pseudopotentials for the O and—to a lesser extent—Rh atoms, we make use of ultra-soft (US) pseudopotentials [16] which allow an accurate description of the O and Rh valence pseudo-wavefunctions with a modest basis set including PW’s up to a kinetic-energy cutoff of 30 Ry. In the case of Rh, we found it convenient to treat the and channels using a NC potential, while the US scheme is applied only to the hard orbital [17, 18]. With such a small basis set, the accuracy is slightly improved if also C is treated within the US scheme, which we decided to do. Brillouin-zone (BZ) integrations are performed using the Gaussian-smearing [19] special-point [20] technique. In agreement with Ref. [18], we find that the structural properties of bulk rhodium are well converged using a first-order Gaussian smearing function [19] of width and special k-points in the irreducible wedge of the BZ (IBZ). The isolated surface is modeled by a periodically repeated supercell. We have used the same supercell for both the clean and the CO-covered surfaces. For the clean surface we have used atomic layers plus a vacuum region corresponding to layers. For the CO-covered surface the Rh layers are completed by one layer of CO molecules on each side of the slab: in this case the vacuum region is correspondingly reduced to atomic layers. We have used the same Gaussian-smearing function as in the bulk calculations with special k-points in the surface IBZ. Convergence tests performed with a value of twice as small and a correspondingly finer mesh of special points resulted in no significant changes in total energies and equilibrium geometries. The latter are found by allowing all the atoms in the slab to relax until the forces acting on each of them are smaller than .
III Results
A Structural analysis
The clean Rh(110) surface is unreconstructed. An analysis of LEED data suggests that the top interlayer spacing is reduced by relative to the bulk interlayer spacing, while the second interlayer spacing would expand by [21]. Our ab initio data indicate a relaxation of and of in the first and second interlayer spacings respectively.
For the CO-covered surface, LEED data indicate that the molecules are bound in the short bridge site between two first layer rhodium atoms in the direction with the molecular axis tilted by degrees from the surface normal, forming a structure. In principles there are many different ways to arrange the CO molecules so as to obtain the same LEED pattern. We concentrate our attention on three possible adsorption sites: i) the short-bridge one described above; ii) the on-top one, in which the CO molecule is located on top the first-layer atoms; and iii) the hollow site, formed by two first-layer atoms in the direction and one second-layer atom. In agreement with the outcome of the LEED analysis, we find that the short-bridge site is the most favorable. The relative energies of the other two sites with respect to the short bridge—assuming a structure in all cases—are: 0.19 eV (hollow) and 0.34 eV (on top). We find that the angle between the surface normal and the CO molecular axis is degrees, and that the angle between the Rh-C bond and the surface normal is degrees; the Rh-C bond length is and the C-O distance is . The rhodium substrate presents an outward relaxation of the first layer of with respect to the bulk interlayer spacing. These results are summarized in Table I together with similar ones obtained for six other different surface geometries (See Fig. 1).
From Table I we see that the and geometries are degenerate within our error bar which we estimate to be , and that the uncertainty about the corresponding tilt angle is very large. This behavior can be understood by a simple qualitative model of the surface energetics which also accounts for the observed ordering of the structures. In order to disentangle the relative importance of the adsorbate-substrate and adsorbate-adsorbate interactions, we have modeled the former by a supercell in which a single CO molecule is constrained to sit at the same short-bridge site which would be preferred at full coverage.
| unit | degrees | degrees | meV/mol | ||
|---|---|---|---|---|---|
| Expt. | |||||
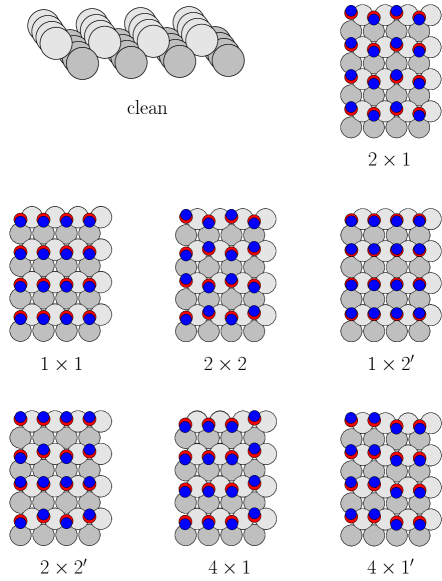
We observe that the dependence of the adsorption energy on is very weak up to , and that it becomes very steep above this angle. When the coverage increases, the dipole-dipole interaction becomes important and accounts qualitatively for the energy ordering of the structures displayed in Fig. 1. In the structure, nearest-neighbor molecules are tilted by opposite angles around the axis joining them (the direction), while next-nearest-neighbor molecules are tilted by a same angle about the (001) axis which joins them. The dipole-dipole interaction favors both these arrangements of angles. The geometry is similar to the previous one as regards the nearest-neighbor interactions, whereas it is unfavored regarding next-nearest-neighbor interactions. The next higher energies are those of the and structures which are almost degenerate because they have the same number of unlike tilt angles along the row. The next structure is the one which is characterized by an alternating arrangements of energetically favored and disfavored rows and columns of CO molecules. Finally, in the and structures the nearest-neighbor molecules are tilted by a same angle and the corresponding dipolar interaction is therefore independent of ; it is only the weaker next-nearest-neighbor interaction which depends on , more so for the structure for which the sign of the dipole-dipole interaction energy is the same as that of the adsorbate-substrate interaction, while the two interactions tend to cancel for the other structure. In both cases, this behavior results in a very weak dependence of the energy upon , and in an energy degeneracy of the two structures, within our error bars. We have also calculated the adsorption energy of the CO molecules defined as , where is the total energy of the CO covered surface, is the total energy of the clean Rh(110) surface, and is the total energy of the CO, all the calculations being done using the same slab geometry and the same set of k-points. The calculated adsorption energy is of eV/molecule, which has to be compared to the experimental value eV/molecule [4]. This large discrepancy is a common feature of the LDA which is well known to overestimate absolute binding energies, whereas equilibrium geometries and energy differences among them are usually predicted with a much higher accuracy (of the order of a few percents).
B Finite-temperature properties
1 Mapping onto a 2D Ising model
From Table I we see that the energy necessary to tilt the angle of a molecule is of the order of , whereas the energy difference between different adsorption sites is typically ten times as large. This fact indicates that—given the adsorption sites of the CO molecules—a well defined energy would correspond to each distribution of tilt angles, where every molecule is labeled by a variable which indicates in which direction it is tilted (the sign of the tilt angle, which we associate to an Ising-like variable, ). Much in the same spirit of the cluster expansion of the energy landscape of an alloy [22], the energy of each tilt-angle configuration can be expressed in terms of polynomials in the ’s. Because, of symmetry, odd-power polynomials are absent from the cluster expansion. Restricting ourselves to second-order polynomials (spin-pair interactions) and neglecting all the couplings beyond next-nearest-neighbors, the cluster expansion of the surface energy would read:
It is straightforward to see that:
|
|
where the subscripts refer to the structures of Fig. 1.
is the ground-state energy which we take as the reference energy. The and structures are degenerate within the present model, and their energy difference provides therefore an estimate of longer-range or many-spin interactions which have been neglected. Out Eqs. (2), one can extract four independent energy differences, which are linear functions of the three parameters , , and . By disregarding one of these equations in turn, one obtains 4 different linear sistems for the ’s which provide estimates for these parameters, which coincide within . The average of the four set of parameters so obtained is: , , and . Note the large difference between the absolute values of and , which is due to a stronger coupling in the ‘ziz-zag’ direction, where the distance between neighboring molecules is smaller by a factor than in the orthogonal direction.
2 Monte Carlo simulations
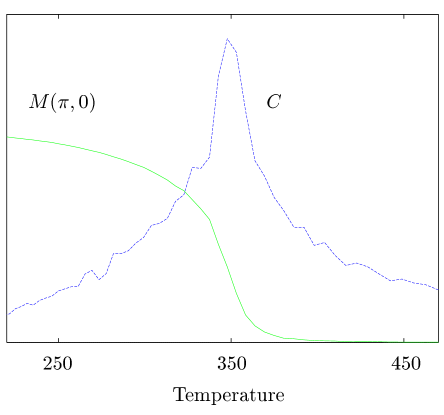
The thermal properties of our system are obtained by standard Metropolis Monte Carlo simulations of the above Ising model (see for example Ref. [23]). To this end, we have used a square lattice with periodic boundary conditions. The order parameter of the transition between the ordered phase and the disorderd phase where the tilt angles are distributed at random, is the Fourier coefficient of the spin-spin correlation function, , at wavevector . The order-disorder transition temperature, , is estimated looking at the maximum of the specific heat . We have not attempted any finite-size scaling, but we have verified that the location of the transition temperature is rather insensitive to the choice of the size of the system, by making a few simulations for a spin matrix. In Fig. 2 we show the behavior of the specific heat, , and the order parameter, , as functions of temperature. We estimate the critical temperature to be . The estimate of the error bar is based on the uncertainties on the coupling coefficients of the Ising model.
REFERENCES
- [1] G. Comelli, V.R. Dhanak, M. Kiskinova, N. Pangher, G. Paolucci, K.C. Prince and R. Rosei, Surf. Sci. 260, 7 (1992). ibid. 269/270 360 (1992).
- [2] V.R. Dhanak, G. Comelli, G. Cautero, G. Paolucci, M. Kiskinova, K.C. Prince and R. Rosei, Chem. Phys. Letters 188 237 (1992).
- [3] D. Alfè, P. Rudolf, M. Kiskinova, and R. Rosei, Chem. Phys. Lett. 211, 220 (1993).
- [4] M. Bowker, Q. Guo and R. Joyner, Surf. Sci. 253, 33 (1991).
- [5] V. Schmatloch and N.Kruse Surf. Sci. 269/270, 488 (1992).
- [6] A. Baraldi, V.R. Dhanak, G. Comelli, K.C. Prince and R. Rosei, Surf. Sci. 293, 246 (1993).
- [7] V.R. Dhanak, A. Baraldi, G. Comelli, G. Paolucci, M. Kiskinova, and R. Rosei, Surf. Sci. 295, 287 (1993).
- [8] L. Casalis, A. Baraldi, G. Comelli, V.R. Dhanak, M. Kiskinova, R. Rosei, Surf. Sci. 306, 193 (1994).
- [9] J.D. Batteas, A. Barbieri, E.K. Starkey, M.A. Van Hove, G.A. Somorjai, Surf. Sci. 313, 341 (1994).
- [10] J.J. Weimer, J. Loboda-Cackovic, J.H. Block, Surf. Sci. 316, 123 (1994).
- [11] K.C. Prince, A. Santoni, A. Morgante, G. Comelli, Surf. Sci. 317, 397 (1994).
- [12] R. Gómez, A. Rodes, J.M. Péres, J.M. Feliu, A. Aldaz, Surf. Sci. 327, 202 (1995).
- [13] P. Hohenberg and W. Kohn, Phys. Rev. 136, B864 (1964).
- [14] W. Kohn and L. Sham, Phys. Rev. 140, A1133 (1965).
- [15] D. Ceperley and B. Alder, Phys. Rev. Lett. 45, 566 (1980).
- [16] D. Vanderbilt, Phys. Rev. B 41, 7892 (1990).
- [17] K. Stokbro, Phys. Rev. B 53, 6869 (1996).
- [18] K. Stokbro and S. Baroni, Surf. Sci., in press.
- [19] M. Methfessel and A. Paxton, Phys. Rev. B 40, 3616 (1989).
- [20] H. J. Monkhorst and J. D. Pack, Phys. Rev. B 13, 5188 (1976).
- [21] W. Nichtl, N. Bickel, L. Hammer, K. Heinz and K. Müller, Surf. Sci. 188, L729 (1987).
- [22] J.W.D. Connoly and A.R. Williams, Phys. Rev. B 27, 5169 (1983).
- [23] David Chandler, Introduction to modern statistical mechanics (Oxford University Press, Oxford, 1987).