Freezing Transition of Compact Polyampholytes
The freezing transition of heteropolymers, in which the number of thermodynamically relevant states goes from an exponentially large value () in the random globule state, to only a few () conformations in the frozen state, has attracted a great deal of interest. In addition to providing an interesting problem in the statistical mechanics of disordered materials[1], this system is potentially relevant to the biologically important question of protein folding. Most previous investigations have focused on heteropolymers with short-range interactions. Recently, however, there has been renewed theoretical[2, 3, 4] and experimental[5, 6] interest in polyampholytes (PAs), which are heteropolymers with charged monomers of both signs. It has been shown that, due to screening effects, PAs collapse to compact globules if their net charge is below a critical value[7]. There is also some evidence from exact enumeration studies of short chains[8] that dense globules of neutral PAs may have a freezing transition. However, it is unclear how long range (LR) interactions affect freezing, or whether the formalism developed for globular polymers with short range (SR) interactions remains applicable to the LR case.
The freezing transition of SR heteropolymers is most commonly described by the Random Energy Model (REM)[9], although it is not always applicable even in this case[10]). As the principle underlying assumption of REM is the statistical independence of energies of states (polymer conformations) over disorder (sequence of charges along the chain), we first examine correlation of the energies and then discuss the resulting freezing transition. Our starting point is the Hamiltonian
| (1) |
where is a constant, labels monomers along the chain, and is the charge of monomer . The range of interactions is indicated through , such that for SR interactions, and for Coulomb forces in dimensional space. Finally, we only consider the case of maximally compact polymers, assuming that maximal density is maintained independently of Coulomb interactions, i.e. by an external box, poor solvent, or internal attractions, such that .
The simplest characteristics of statistical dependence of energies is the pair correlation between two arbitrary conformations and , given by
| (2) |
with . In the familiar case of SR interactions, is just the number of bonds in common between configurations and . Numerical simulations[10] indicate that in many cases the probability distribution for , i.e. is sharply peaked at small . This happens because one can easily “hide” monomers by moving them only a small distance and decreasing their contribution to . Large statistical dependence is thus achieved only for conformations that are closely related. The validity of REM rests on the statistical rarity of such closely related conformations. REM is valid when configurations that are statistically dependent can be ignored in a large limit.
By contrast, with long range interactions, the relevant parameter for judging statistical dependence is . While the geometric interpretation of is not as clear as , it measures the similarity in contributions from monomer pairs in conformations and to the overall energy. Unlike the SR case, polymeric bonds always keep monomers within the scale of LR interactions. Thus, for two conformations chosen at random, the overlap may not be negligible (even if is). The following scaling argument provides an estimate of the width of the probability distribution .
First, consider the maximum overlap which occurs (for both LR and SR) when all elements are correlated (i.e. is the correlation of a configuration with itself). To compute this, we note that for each of the monomers, there is a contribution from monomers at a distance (for compact states in dimensions), resulting in . For SR interactions, this integral is dominated by contributions at a microscopic length scale (set by the interaction range) and we get . For LR interactions, while contributions from monomers far away are smaller, there are more of them. For Coulomb interactions in , the integral is dominated by the longest distance, and for a polymer of size , we get .
We can use similar arguments for the overlap between two conformations chosen at random (). In fact, for the LR problem, and scale identically, as both cases involve pairs of monomers each giving a contribution , for a total of . Moreover, as the main contribution to comes from far away sites, this residual overlap is only weakly conformation dependent. The existence of a residual overlap changes the problem fundamentally from the SR case: REM is not valid as there is always a statistical dependence in [11].
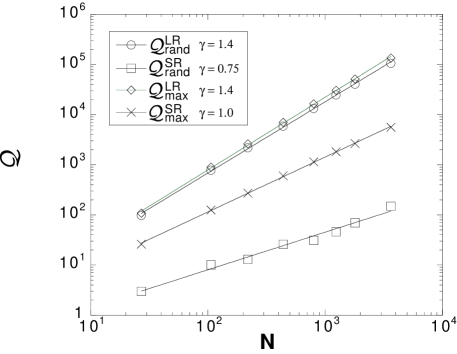
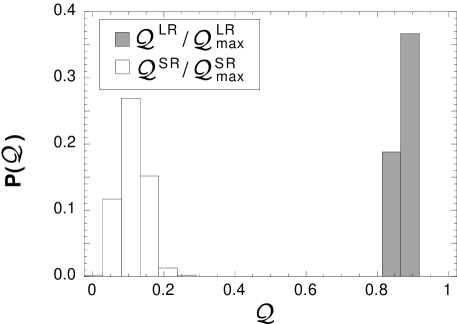
Computer simulations support the above arguments. To examine a large range in , we generated random conformations on a lattice by first choosing a radius , and then enumerating random paths [12] on the set of lattice sites which are within . was varied from 3 to 10 lattice sites, and the following results represent averages over 20 conformations for each value. Fig. 1 shows that the scaling exponents defined by appear to be the same within error for random pairs of conformations, as well as the overlap of any conformation with itself. Furthermore, the fits agree well with the predictions . By contrast, with SR interactions , while is distinctly smaller. We also calculated SR and LR overlaps and for 1000 pairs of 64-mer conformations (, cubic lattice). The resulting histograms, with overlaps normalized by the maximal value, are shown in Fig. 2. SR overlaps are peaked at small values whereas the LR overlaps are peaked closer to unity. Furthermore, the sharpness of the distribution suggests that is approximately independent of the chosen pairs of conformations.
Having demonstrated the residual overlap between energies of conformations with LR interactions, and hence the breakdown of REM, we go on to better characterize the density of states. This will take us a step closer to understanding the freezing of PAs. To describe the density of states, we use the following three characteristics: the annealed energy variance (the width of the density of states for annealed disorder), the average quenched energy variance (the width of the density of states for quenched disorder), and the quenched energy correlation function (the statistical dependence between states). These quantities are given by the formulæ
| (3) | |||||
| (4) | |||||
| (5) |
where and denote averaging over conformations and sequences respectively. Note that these quantities are related by a mathematical identity .
In the annealed case, the energy variance is , since, in this case, all possible states can be accessed and thus the width of the energy spectrum must be maximal. This result is also easily extracted from equation (2) by averaging over conformations with . Averaging the same equation over all pairs of states and , we can find : for conformations, there are pairs which completely overlap , but this is overshadowed by the remaining pairs with overlap , resulting in . In addition to measuring the statistical dependence between states, also describes how the mean of the energy spectrum for a given sequence varies between sequences. Finally the width of the energy spectrum for a typical sequence is . This makes sense physically as correlation (anticorrelation) in the energies should narrow (broaden) the width of the energy spectra. Also, we see that when there is no correlation (), , as in the REM.
The following picture emerges from the above results. As , we have for the SR case above the freezing temperature, and the mean of the energy spectrum does not vary significantly between sequences. Also, the width of the spectrum for a given sequence is large (the maximum possible value, as in the annealed case). The variation of the means of the energy spectra between sequences , is much smaller than the typical width of each spectrum ; thus disorder is not important for SR interactions above freezing. Of course, below the freezing temperature, self averaging breaks down, and disorder is relevant. By contrast, for LR interactions, does not vanish and is significant. We thus expect the widths of the energy spectra to be small and the means to vary widely from sequence to sequence.
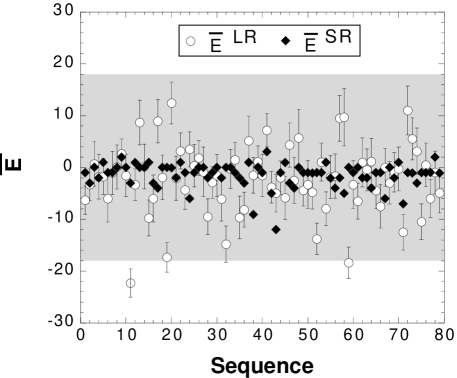
The results of a computational test of the above scenario, obtained from the exact enumeration of all globular states of 36-mers on a cubic lattice () are presented in Fig. 3. We see that for SR interactions, the means of the spectra are indeed well defined and their width (gray region) is large. For LR interactions, the means are poorly defined, with a variance between sequences which is greater than the widths of individual spectra (error bars).
Is the insight gained above sufficient to analyze the freezing transition in PAs? In general, freezing is governed by the low energy tail of the density of states , where is the total number of conformations, and is the single level energy distribution. In the standard REM entropy crisis scenario, the system freezes in a microstate, much like a snapshot, at a temperature at which , where is the density of states at the equilibrium energy at the temperature .
The density of states in the high temperature regime is governed by , as can be seen by a high temperature expansion: The partition function is first expanded in powers of , resulting in (after averaging over sequences) . From this expression (and using Eq.(3)), the entropy is calculated as , where (as demonstrated earlier) for Coulomb interactions in , , yielding
| (6) |
¿From the structure of the series[3], we expect the high temperature expansion to break down for temperatures . This temperature can also be obtained by regarding the polymer globule as a (non-polymeric) plasma of the same charges confined within the volume . As the Debye screening length for this plasma is of the order , there are two regimes: For , the plasma is fully screened as . However, for , and the charges are not screened. The latter regime is meaningless for a regular plasma, but describes the high temperature behavior of the polymer globule. It is not clear that, with the constraints of polymeric bonds, the scaling for a PA should be the same as that for a screened plasma at low temperatures. However, assuming that this is the case, the entropy can be estimated by noting that the plasma is composed of roughly independent Debye volumes. Assuming that the entropy is proportional to , we finally conclude
| (7) |
where is a numerical constant. Note that Eq. (7) indicates a very sharp decrease of the density of states in the low energy tail, proportional to , which reflects the fine tuning of configurations necessary for screening.
Typically the number of conformations of a polymer scales as , with of the order of unity. In the limit where the polymer is kept maximally compact by an external box, poor solvent, or internal attractions, such that , where is a monomeric length scale, is approximately the entropy of Hamiltonian walks. Freezing, which is signaled by , can take place in the unscreened regime only for short chains with . (The “apparent” freezing temperature for unscreened polymers grows as .) In this case, a further decrease of temperature will not lead to screening, of course. For longer chains, we predict freezing at an -independent temperature of in the screened regime. In this sense, the compact PA freezes in a phase transition that is similar to REM. We stress that this happens despite the unusual scaling of the width of the density of states, . The distinction between the two behaviors is important for understanding the results of lattice simulations, as it appears that 36-mers are in the short chain regime.
We expect that the nature of the frozen state also depends on . For freezing in the screened regime (), the system looks much like that of the SR case, i.e. like a disordered version of a salt crystal. For freezing in the unscreened regime (), we expect a smaller degree of antiferrogamnetic ordering; consistent with the idea that freezing at a higher temperature leads to a state which is less energetically optimized.
An important class of PAs are proteins. In the light of our findings in this work, we make here some concluding remarks about protein folding and evolution. Of the 20 natural amino-acids, three are positively charged (Lys, Arg, His), two are negatively charged (Asp, Glu), and the rest are neutral. Nevertheless, it is often assumed that LR interactions are not essential to proteins, as the screening length in biological solvents is often quite small. It is less clear that screening is also effective in compact globular configurations with little or no solvent in their interiors. Furthermore, secondary structural elements such as -helices effectively reduce the conformational flexibility of proteins. Indeed, the conformation space of small proteins (i.e. 70-90 amino–acids) perhaps corresponds to that of lattice 27-mers [13], and small proteins are likely to be in the short chain regime with respect to LR interactions. Thus, while the total charge on a given protein may be small, in solvents with few counter ions, this may be sufficient to lead to a REM-violating correlated energy landscape, making the results obtained here relevant. Moreover, for the typical separation of charges in a globular protein (roughly 20 Å), and given a dielectric constant of order 5-10, and , the characteristic freezing temperature is of the order of (biologically relevant) room temperatures.
We have discussed how the mean of the density of states can vary greatly from sequence to sequence. It appears that a large contribution to this mean comes from the interaction between monomers that are not far apart along the sequence. For example, while next nearest neighbors along the chain can somewhat vary their spatial distance from each other, this will still not break their great contribution to the mean energy. This is why the conformational average energy depends strongly on the correlations between charges quenched along the sequence. For Coulomb interactions, chains with anti-correlated sequences have low mean energies. This is intriguing, considering the recent finding that protein sequences are indeed anti-correlated with respect to their charge [14]. This indicates that perhaps protein evolution was not just dictated solely by the degree of hydrophobicity of monomers (which depends on the degree of charge, not the sign), but by Coulomb effects as well.
The work was supported by NSF (DMR 94-00334). AYG acknowledges the support of Kao Fellowship. Computations were performed on Project SCOUT (ARPA contract MDA972-92-J-1032).
REFERENCES
- [1] J. D. Bryngelson and P. G. Wolynes, Proc. Nat. Acad. Sci., USA 84, 7524 (1987); E. Shakhnovich, and A. Gutin, Biophys. Chem. 34, 187 (1989).
- [2] S. F. Edwards, P. R. King, and P. Pincus, Ferroelectrics 30, 3 (1980); P. G. Higgs and J. F. Joanny, J. Chem. Phys 94, 1543 (1991).
- [3] Y. Kantor, H. Li, and M. Kardar, Phys. Rev. Lett 69, 61 (1992); Phys. Rev. E49, 1383 (1994).
- [4] A. V. Dobrynin and M. Rubinshtein, J. Phys. II 5, 677 (1995).
- [5] J. Copart and F. Candau, Macromolecules 26, 1333 (1993).
- [6] A. E. English, S. Mafe, J. A. Manzanares, X.-H. Yu, A. Yu. Grosberg, and T. Tanaka, J. Chem. Phys 104, 8713 (1996).
- [7] Kantor and M. Kardar, Europhys. Lett. 27, 643 (1994); Phys. Rev. E 51, 1299 (1995).
- [8] Y. Kantor and M. Kardar, Phys. Rev. E52, 835 (1995).
- [9] B. Derrida, Phys. Rev. Lett. 45 (1980) 79.
- [10] V. S. Pande, A. Yu. Grosberg, C. Joerg, and T. Tanaka, Phys. Rev. Lett. 76, 3987 (1996).
- [11] It is tempting to compare this conclusion with an earlier result[3] that PA interactions are relevant for ideal chains in . This may however be just a coincidence as our result here is about energy correlations () for a compact chain of the size , while the result of Ref.[3] is obtained by considering the interaction of two half–chains, with charge imbalance each, over the Gaussian distance , i.e. .
- [12] V. S. Pande, C. Joerg, A. Yu. Grosberg, and T. Tanaka, J. Phys. A 27, 6231 (1994).
- [13] J. N. Onuchic, P. G. Wolynes, Z. Luthey-Shulten, and N. D. Socci, Proc. Natl. Acad. Sci. USA 92 3626 (1995).
- [14] V. S. Pande, A. Yu. Grosberg, and T. Tanaka, Proc. Nat. Acad. Sci. USA 91, 12976 (1994).