[
Vortex Plastic Motion in Twinned Superconductors
Abstract
We present simulations, without electrodynamical assumptions, of , , and , in hard superconductors, for a variety of twin-boundary pinning potential parameters, and for a range of values of the density and strength of the pinning sites. We numerically solve the overdamped equations of motion of up to flux-gradient-driven vortices which can be temporarily trapped at pinning centers. These simulations relate macroscopic measurements (e.g., , “flame” shaped profiles) with the underlying microscopic pinning landscape and the plastic dynamics of individual vortices.
pacs:
PACS numbers: 74.60.Ge]
One of the major unsolved problems in high- superconductivity is flux pinning [1]. Not only is flux pinning of intrinsic interest, understanding it is necessary in order to develop technological applications. Since vortices are pinned by interacting with defects, a great deal of work has focused on naturally occurring defects in high- superconductors [1, 2, 3]. In particular, it has been found that twin boundaries (TBs) [2-19] form easily in the high- compound YBa2Cu3O7-x (YBCO). Thus TBs have been intensively studied by numerous experimental techniques, including Bitter decoration [5], torque magnetometry [6] magnetization [7, 8, 9], and magneto-optical imaging [10, 11, 12, 13, 14]. In spite of this intense and multi-pronged effort, there is still controversy concerning the effect of TBs (see, e.g., the conflicting statements of [7, 15]). In particular, the magneto-optical measurements by Duran et al. [10] and Vlasko-Vlasov et al. [11] seem contradictory: [10] finds that TBs act as easy-flow channels for longitudinal vortex motion, while [11] finds them to be barriers. Moreover, resistivity measurements by Kwok et al. [16] suggest that pinning is enhanced within the TB. Recent results [12, 13, 14] confirm that the effect of TBs on vortex motion has a nontrivial dependence on several variables. First, there is an angular dependence, i.e., a twin may act either as an easy flow channel or a barrier depending on the angle between the flux front and the TB. Second, experiments [6, 7, 14] indicate that the effective pinning of TBs is temperature dependent. A complete picture is still lacking due to the limitations of the techniques used so far (e.g., magneto-optics imaging only probes the regime of low fields, while resistivity explores only the high temperature regime).
An alternative technique for investigating the microscopic behavior of flux in a hard superconductor is to use computer simulations (see, e.g., [17, 18, 19], and references therein). Here, we present simulations of the spatio-temporal evolution of rigid flux-gradient-driven flux lines in a twinned superconductor such as YBCO. We first describe a model for vortex-vortex, vortex-pin, and vortex-twin interactions. We then investigate how these flux-gradient-driven flux lines travel through the sample in the presence of both correlated (TB) and uncorrelated (point defect) pinning. From the microscopic dynamics of individual vortices, we compute several macroscopic measurable quantities (e.g., , , ) and relate them with pinning parameters: the angle between the TB and the sample edge, and the ratio of pinning strengths inside and outside the TB, which is expected to vary with temperature [2].
Our simulation geometry is that of an infinite slab of superconductor in a magnetic field applied parallel to both the slab surface and the TBs. Thus, demagnetization effects are unimportant. We also treat the vortices as stiff, so that we need to model only a two-dimensional (2D) slice (- plane) of the 3D slab. One can think of our rigid flux lines as representing the “center of mass” positions of real somewhat-flexible vortices, and our pinning in the bulk as representing the average of the pinning along the length of the real vortex. For a flexible vortex, the bulk pinning can be comparable to the pinning in the TB even for a large sample. Vortices enter the sample at points where the local energy—as determined by the local pinning and vortex interaction—is low. We correctly model the vortex-vortex force interaction by using the modified Bessel function with cutoffs at and ( is the penetration depth). Thus, the force (per unit length) on vortex due to other vortices (ignoring cutoffs) is Here, the are the positions of the vortices within a radius , , and [1]. Forces are measured in units of , lengths in units of , and fields in units of . Notice that our simulation correctly models the driving force as a result of local interactions; no externally imposed “uniform” current is applied to the vortices. Further details of the simulation are presented in [19].
Uncorrelated Pinning.— The most important imperfections in YBCO single crystals are random microscopic defects such as oxygen vacancies in the CuO2 planes. In order to model such a large number of defects, we divide our system into a very fine (e.g., ) grid, where each grid site represents a pinning site. The density of pinning sites, , is between and for all the runs presented here. These densities are within experimentally determined values [5]. The maximum pinning force on each grid site is randomly chosen with a uniform probability distribution, from , where is the maximum possible pinning threshold force (or strength). If the site is in a TB, then the maximum possible pinning threshold force is . When the net force acting on a vortex located on grid site is less than the threshold force , then the vortex remains pinned in that grid site. However, if the force acting on that vortex becomes larger than the threshold force , then the effective pinning force drops to zero and the vortex moves continuously until it encounters a pinning site that has a threshold force greater than the net force acting on the vortex. Thus the pinning force on each grid site acts like a stick-slip friction force where is the net force on the vortex (due to other vortices and possibly a TB) and is the Heaviside step function. In other words, if , and if .
Twin Boundary Pinning.— We have tested a very large variety of models for TBs, and compared simulation results to experiment. For the sake of concreteness, we focus here on the model which was most consistent with experimental data; the results of the other models will be discussed elsewhere. In this model, a TB consists of an attractive well containing pinning sites that have a different maximum threshold force (or strength) than that for sites outside the TB, . The ratio is expected to vary as a function of temperature because of the reduced dimensionality of the thermal fluctuations for vortices in a TB [2]. The ratio is small (i.e., pinning in the twin is weak) for low , and it is larger at higher (see, e.g., page 1321 of [2]). By varying this ratio, we can mimic some of the effects due to temperature.
For all the results presented here, we model the attractive TB well as a parabolic channel with a width . The attractive force on the th vortex due to the well of the th twin is thus where is the perpendicular distance between the th vortex and the th TB, and is the maximum force that the well of the twin exerts on a vortex (i.e., the force needed to escape the TB). The pinning inside the twin channel is modeled identically to the pinning in the rest of the sample, except that it has a different maximum strength, instead of . This microscopic model of TB pinning is very similar to the one inferred from recent measurements in [7], where it is found that the TB “channel” has strong “depth” variations.
Dynamics.— The overall equation for the overdamped motion of a vortex moving with a velocity v and subject to vortex-vortex and vortex-pinning forces (due to intrinsic pinning and TB pinning ) is where and we take .
Many parameters can be varied, making the systematic study of this problem quite complex. Here we chose to vary only the two most critical variables, the angle between the TB and the flux flow, as stressed in [12, 13, 14], and the ratio . We find the critical current, , for an untwinned sample with and Å, to be A/cm2, which is reasonable for YBCO at low . Thus we varied between . A more detailed investigation with different TB widths, TB depths, intrinsic pinning strengths and different TB potentials will be presented elsewhere. For the runs presented here, we fixed the depth of the TB channel by setting the maximum TB force to , and the width of the channel to be approximately .
Sample.— We begin by studying in detail how vortices entering a sample interact with a single TB. The actual sample region is heavily pinned, and covers the region with coordinates and (Fig. 1). The number of pinning grid sites in the sample is . The linear size of each pinning grid site is , and the pinning density is which, for a computer simulation, is extremely large. Fig. 4 shows results for other samples.
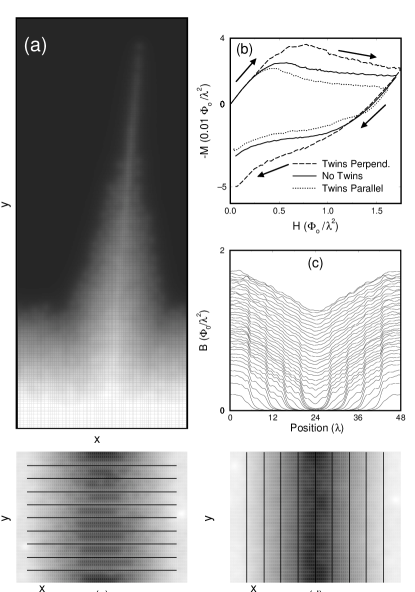
Flux Density Profiles and Current Flow.— Figure 1 shows the computed flux distribution for with (a,b,c) and (d). The TB is at an angle measured from the horizontal sample edge located at the bottom, where flux enters (note the similarity to the experimental situation in [11]). Fig. 1(a) shows the positions of the vortices after the external field has been ramped up from zero. Two important features stand out. First, we see that the vortices “pile up” on the side of the twin where the flux enters. Second, on the other side of the TB we see the “shadow” effect; the density of vortices is lowered. These features of the vortex plastic flow are more explicit in (b), which shows the induction along the horizontal line in (a). When the external field is ramped down to zero we also observe some shadowing and pile up effects, but they are weaker since the number of vortices in the sample is now smaller. Both of these effects for the ramp up and down cases are clearly observed in the experiments of [11]. Since we know the exact position of the vortices, we can calculate the field due to the vortices, and hence the current flow (contours of constant ) near the TB. Fig. 1(c) shows the current flow for the TB in (a), while (d), corresponding to lower , presents a “flame”-shaped current flow similar to the ones observed in several experiments [10, 11, 12, 13, 14].
In Fig. 2 we show the positions of the vortices after the field has been ramped up from zero for several cases. In the top panels, the ratio is held fixed, and the angle is varied; we see that the TB is a barrier to flux flow, while the other angles are easy-flow channels. Our model, like experiments (e.g., [13, 14]), exhibits TB vortex flow which has an angular dependence. In the lower panels of Fig. 2 the ratio is increased. We still observe an angular dependence, but the angle at which a twin becomes an easy-flow channel has increased. As the ratio increases, the angle between the TB and the direction of vortex flow must decrease if the twin is to be an easy flow channel.
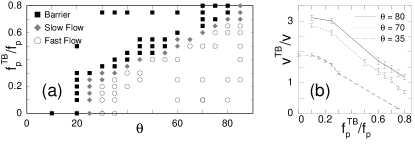
Figure 3 summarizes results obtained from many runs. Fig. 3(a) presents the “vortex plastic motion” phase diagram showing the region where the TB is an easy-flow channel (barrier) for longitudinal vortex motion, indicated by open circles (solid squares). The boundary, indicated by grey diamonds, corresponds to slow vortex motion. This phase diagram quantitatively summarizes how and affect the vortex motion. As pinning in the twin increases, we expect the flux-front velocity to decrease. This observation is quantified in Fig. 3(b). There, () is the velocity of the flux front inside (outside) the TB, measured along the direction perpendicular to the sample edge. Figure 3(b) shows decreasing monotonically for increasing . Monitoring the dynamics of individual vortices, we observe that the longitudinal vortex transport in the TB is plastic (many vortices “tear away” from the flux lattice when ) and proceeds via two mechanisms: (i) the actual motion of vortices along the TB, and (ii) vortices from the bulk (and close to the TB vortex front) falling into the TB. Finally, our phase diagram [Fig. 3(a)] suggests that the contradictory experimental results in [10, 11] can be understood as arising from probing different parameter regimes.
Refs. [13, 14] made the interesting observation that flux enters the sample in a “flame” pattern around the TB. [14] suggests, using current-conservation arguments, that this happens whenever the twin acts as easy-flow channel. We also observe flame patterns (see Fig. 4(a)) whenever the twin is an easy-flow channel. The flame is caused by vortices escaping from the TB, not gliding along it.
Magnetization.— One clear advantage of our simulation is that we can obtain direct spatio-temporal information on the distribution of individual flux lines inside the sample. This is quite difficult to obtain experimentally, especially for bulk samples. What is typically measured in experiments is the average magnetization over the sample volume. In our simulation, we thus calculate . In Fig. 4(b) we show partial magnetization loops for a sample where the TBs are perpendicular to the flux flow (d), one where they are parallel to the flux flow (e), and a sample without any twins at all. Note that Fig. 4(d,e) are two particular (and extreme) cases considered in the phase diagram Fig. 3(a): and . For these runs the sample is , , and .
The loop where the twins are perpendicular to the flux flow is clearly wider than the other two. This is because a twin is a barrier to perpendicular vortex flow since the vortices would have to cross the TB, which is a parabolic channel. The loop where the TBs are parallel to the flux flow is narrower because these TBs are easy flow channels. Also, we repeated the above experiments at a higher ratio, , and found that the perpendicular TBs are still barriers to flux flow, i.e., the magnetization is still higher than the untwinned case. The parallel twins no longer act as easy-flow channels and thus the magnetization is nearly identical to the untwinned case. All these results are qualitatively similar to those in Ref. [7]; the minor differences are most likely due to finite size effects.
To summarize, we have performed simulations of flux-gradient-driven vortices in twinned superconductors with a very large number of () point defects. Experiments can be explained by using a simple model for a twin boundary: a parabolic well containing pinning sites which are different in strength from the rest of the sample. In agreement with experiments, we show that the twin may act as either a barrier or an easy flow channel (producing “flame”-type flux patterns), depending on the angle between the flux flow and the pinning ratio, . We quantify these results in detail and provide a phase diagram for the plastic motion of vortices [Fig. 3(a)]. When the twin is a barrier, it acts to guide flux motion resulting in the pile up and shadowing effects. We also compute magnetization loops for samples where the twins are parallel and perpendicular to the flux flow and obtain results similar to recent experiments [7].
SF was supported in part by the NSF under grant No. DMR-92-22541.
REFERENCES
- [1] See, e.g., [2] and: S. Senoussi, J. Phys. III 2, 1041 (1992).
- [2] G. Blatter et al., Rev. Mod. Phys. 66, 1125 (1994).
- [3] I.N. Khlyustikov, A.I. Buzdin, Adv. Phys. 36, 271 (1987).
- [4] D.R.Nelson, V.M.Vinokur, Phys.Rev.B 48, 13060 (93); G. Blatter et al., ibid 43 7826 (91); M.C. Marchetti, V.M. Vinokur, Phys.Rev.Lett. 72, 3409 (1994).
- [5] G.J. Dolan et al., Phys. Rev. Lett. 62, 827 (1989).
- [6] E.M. Gyorgy et al., Appl. Phys. Lett. 56, 2465 (1990).
- [7] M. Oussena et al., Phys. Rev. B 51, 1389 (1995).
- [8] B.M. Lairson et al., Phys. Rev. B 42, 10067 (1990).
- [9] A.A. Zhukov et al., Phys. Rev. B 52, 9871 (1995).
- [10] C.A. Durán et al., Nature 357, 474 (1992).
- [11] V.K.Vlasko-Vlasov et al, Phys.Rev.Lett.72, 3246 (1994)
- [12] C.A. Durán et al., Phys. Rev. Lett. 74, 3712 (1995).
- [13] U. Welp et al., Phys. Rev. Lett. 74, 3713 (1995).
- [14] U. Welp et al., Physica 235C, 241 (1994).
- [15] S. Fleshler et al., Phys. Rev. B 47, 14448 (1993).
- [16] W.K. Kwok et al. Phys. Rev. Lett. 64, 966 (1990).
- [17] O. Pla and F. Nori, Phys. Rev. Lett. 67, 919 (1991).
- [18] R.A. Richardson et al., Phys. Rev. Lett. 72, 1268 (1994).
- [19] C. Reichhardt et al., Phys. Rev. B 52, 10441 (1995).
- [20] A.M. Chang et al., Europhys. Lett. 20, 645 (1992).
- [21] L. Cooley, A. Grishin, Phys. Rev. Lett.72, 2788 (1995).