Simulations of Pattern Formation in Vibrated Granular Media
Abstract
We present simulations of peak pattern formation in vibrated two-dimensional (2D) granulates and measure the dispersion relation of the pattern for various frequencies, accelerations, cell sizes, and layer heights. We report the first quantitative data from numerical simulations showing an interesting dependence of the pattern wavelength on the acceleration and the system size. Our results are related to recent experimental findings and theoretical predictions for gravity waves.
Pacs: 46.10.+z, 47.20-k, 05.60+w
The dynamical properties of non-cohesive granular media have attracted a lot of interest in recent years [1]. Vibrated granular assemblies show a variety of possible responses like surface fluidization [2, 3, 4, 5, 6], convection [7], heaping [8], and surface waves [9, 10, 11, 12, 13, 14], all phenomena being observed in both 2D and 3D systems. In 3D experiments on vibrated layers of sand, Melo et al. [11] find surface patterns similar to the surface waves obtained by parametric excitation in regular fluids, i.e. the Faraday instability [15]. For a review concerning gravity waves in fluids see Ref. [16] and refs. therein. The patterns in granular materials, viewed from the top of the 3D cell, display regular structures such as stripes, squares or hexagons. Recent experiments in a reduced 2D geometry on layers of aluminum beads [12] have also shown the formation of a peak pattern instability. From these measurements of the parametric excitation, a dispersion relation was reported, analoguous to the findings of Melo et al. [11]. No clear mechanism for the instability has been given so far, but results seem to indicate a behavior specific to granular assemblies. At high frequencies or great layer heights, the wavelength saturates at a value independent of the excitation frequency. In a more recent study a scaling was proposed for the high frequency limit [17]; the argument accounts for a dissipation mechanism due to some granular viscosity but no clear evidence for the validity of the scaling was given either. Here, we report simulations of vibrated 2D arrays of polydisperse spheres and compare with experiments [12]. Using material parameters close to experimentally reported values, we observe that the instabilities appear rapidly and that the dispersion relation for different geometries, excitation, material parameters, and initial conditions can be studied in detail.
The model system consists of spheres of diameter ( = 1,…,) randomly chosen from the interval with mm and . Testing different values of we observed the surface waves even in the extreme monodisperse case . We use cells of horizontal width and not limited in height. The container moves with a vertical trajectory: , where is the amplitude and the frequency of excitation. The maximum acceleration of the bottom plate is defined as the dimensionless quantity , with the gravitational acceleration . The layer thickness is with the dimensionless system width .
Here, an event driven (ED) method is used to simulate the dynamics of rigid hard spheres with no intrinsic material elasticity, i.e. the duration of a contact is zero (). This choice is made for two reasons: Firstly, it is crucial to show that the instability presented here, is decoupled from a possible parametric excitation of collective elastic modes which might be generated in the elastic network formed by a dense packing of soft spheres (), i.e. the “detachment effect” [18]. Secondly, in the range of response where the typical separation between the beads is not too small, the ED simulation scheme is quite efficient. The method’s principles are the following: under the influence of gravity, the particles follow a parabolic trajectory, until an event occurs. An event is either a collision between two particles, or a collision of one particle with a wall or the bottom plate. From the velocities just before the event, the velocities after this event are computed, accounting for the energy loss due to friction, and some inelasticity of the material. In the tangential direction, we account for friction, using the coefficient of friction and the maximum tangential restitution . This simplified description of tangential dissipation introduces a coupling between the linear and the rotational degrees of freedom [5] and is consistent with recent experimental results on colliding particles [19]. Simulations performed with different and values show the instability, even for no rotational coupling at all, i.e. . This means that the rotational degree of freedom of the particles is not crucial for the instability to occur. Furthermore, the patterns also occur when dissipation and friction at the walls is switched off, proving that the pattern forming instability is not influenced by the wall’s properties, as e.g. convection is. Switching off friction with the bottom leads to less stable patterns in the sense, that the peaks move in the horizontal direction more easily.
In contrast to previous ED simulations of granular assemblies [4, 5, 20, 21], we implement a dissipation model which uses a velocity dependent restitution coefficient. Such a model is qualitatively consistent with experimental measurements of binary collisions, reporting a restitution coefficient approaching unity with decreasing velocity [22, 23, 24]. The specific model we consider here is the limiting case of a visco-elastic interaction law for the contact of spherical particles. The variation of the surface of contact during the interparticle penetration causes a non-linear elastic force, i.e. the Hertz model [25], and a non-linear dissipative force, i.e. the Kuwabara-Kono model [23]. Thus we use here the coefficient of normal restitution , with the relative velocity in the normal direction , and the power = +1/5. In order to model aluminum spheres we use = 0.4, which leads for typical velocities of = 1m/s to = 0.6. Larger velocities yield smaller coefficients of restitution. Other models, e.g. based on the hypothesis of plastic deformation, lead to qualitatively similar behavior [26], but so far, experiments do not provide a discriminant conclusion about the exact velocity dependence [19, 22, 26].
However, this systematic decrease of dissipation with decreasing average relative energy is not sufficient to keep the collision frequency small under all conditions. The divergence of collision frequency, connected to a (possibly local) loss of relative energy is usually referred to as the ”inelastic collapse”. In order to keep our simulations out of the regime of the inelastic collapse, we also introduce a cut-off time , prohibiting dissipation for a second collision within a time-interval shorter than . In order to test the sensitivity of the method to the exact value of this cut-off time, we have compared identical simulations using only different values = 0s, s, s, and s. Except for the largest values, we get quantitatively the same results. Note that surface waves may occur also in the case of traditional ED simulations with extreme values s and , i.e. . In general, the computational effort decreases with increasing cut-off time, and allows simulations with rather large values of . The authors are aware that more detailed studies are neccessary to investigate all the implications of the ED-extensions used here; however, this problem is out of the scope of this paper.
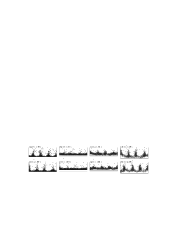
In Fig. 1 snapshots of a typical simulation with = 600 particles, in a box of width = 100, vibrated with = 10 Hz and the acceleration = 3.6 are plotted. The parameters of dissipation and friction are here = 0.4, = 0.2, = 0.2, and = 0.0, where the index indicates the particle-wall interaction parameters, corresponding to strong particle-particle and weaker particle-wall dissipation. In Fig. 1, we present a time-series ranging from s to s. We observe, like in the experiment, a parametric response of the layer with a period . When the bottom moves up, see (a) and (e), the array is compressed and the peaks vanish, see (b) and (f). The array separates from the bottom plate after the latter accelerates downwards, see (c) and (g), and the peaks grow, see (d) and (h), until the array hits the bottom again. Note that the position of the peaks is interchanged with the position of the valleys from one period to the next. An arch-like structure below the array, just before the collision with the bottom plate, is also visible, see (h). This behavior is in agreement with the experimental findings of Clément et al. [12].
To perform systematic quantitative measurements on the wavelength of the observed pattern, we monitor the behavior of the horizontal particle-particle correlation function: , with the delta function for and elsewhere. If the instability is present, this function displays some modulation in with a first maximum which we indentify with the wavelength of the surface waves. The modulation is strongest just before the collision of the granular layer with the bottom plate. We trace over 20 to 50 periods and get , the averaged wavelength.
Clément et al. [12] observe from experiment little influence of the acceleration on the dispersion relation of the waves. This was found for aluminum beads in a range of accelerations where the frequency of layer-bottom collisions roughly equals the frequency of the bottom-plate, i.e. . Varying the cell width from 100 to 200 bead diameters, no influence was reported either. Thus an empirical dispersion relation was proposed to fit all the data ranging from to layers, i.e. , with = 7.2 mm, and = 1.05 m/s2. In contrast, the simulations show that the wavelength does depend on . In Fig. 2a, we plot the wavelength of a system with at constant frequency Hz and for accelerations in the range .


The solid flat line is the empirical estimate of Ref.[12]. For (squares) a modulation of the wavelength is clearly evidenced and also for increased by a non-integer factor, i.e. (solid triangles), this modulation exists, however with a different structure. We give some typical standard deviations of the averages, to show that the structure is not only due to noise. Since is averaged over many periods, not much quantitative can be said about . For the simulations with a large standard deviation we mostly observe a significant periodic change of from period to period between two values. In Fig. 2b we plot versus for various simulations with , and . Comparing the results with the empirical fit of Ref. [12] for , we observe qualitative agreement with the corresponding simulations. Now, we vary the height of the layer from = 5 to = 15. The acceleration is kept constant at = 3.6 and the system width is = 100 (diamonds) or = 200 (solid diamonds). In Fig. 2c, the wavelength is plotted as a function of . We observe an increase of with but we cannot extract a functional behavior from our data due to the strong fluctuations. In Fig. 2d, the dispersion relation for fluid gravity waves is tested [13]. We plot as a function of with , and the wavenumber , for the simulations of Figs. 2b and c. The dotted line is the expected dispersion relation for gravity waves . Even when the data seem to gather near the line, the fluctuations are too strong to allow for a conclusive statement on the dispersion relation.
In this letter, we present simulations of vibrated 2D layers of grains, using an algorithm based on an event driven procedure with a restitution coefficient depending on the impact velocity and a collision frequency dependent dissipation threshold. The simulation procedure keeps us, by algorithmic construction, out of the regime where multiparticle effects become dominant. However, we verify that the patterns also occur with a standard interaction model. The present procedure is designed to explore more efficiently larger domains of parameter space, i.e. the divergence of the collision frequency (the “inelastic collapse”) can be avoided. The reported patterns are in qualitative agreement with the experimental findings. We observe standing peak patterns at the layer top and - depending on different parameters - an arch structure forming at the bottom. The patterns oscillate with twice the bottom plate period. The pattern wavelength was systematically extracted using the horizontal density correlation function. Like in the experiments, we evidence a regime where the wavelength decreases when the frequency increases and an almost constant wavelength in the limit of large frequencies. We observe a modulation of the wavelength around the experimental empirical determinations, which is triggered by a resonant effect between the box size and the bottom plate acceleration. This effect was not reported in previous experiments in large cells but something analogous was reported for small cells [13]. For layer heights between H = 5 and H = 15, we measure a weak increase of the wavelength compatible with previous experimental determinations but the data does not allow for a definite quantitative conclusion.
Finally, we remark that the picture of a completely inelastic block - often used to describe a dissipative thick granular layer - is not valid if the system succeeds to choose a state, i.e. standing waves, in which energy is not totally dissipated during the contact with the bottom. The aim of fully understanding the instability presented here is to unravel the physics governing the modes of transport of mass, momentum and energy in a vibrated granular material. An open and challenging question is to extract from these parametric excitation studies what might be specific to granular assemblies and what can be understood in the general framework of hydrodynamic instabilities. The qualitative convergence we find here between experimental results and numerical computations is encouraging and calls for more detailed studies on both sides.
We thank Francisco Melo for interesting discussions. L.A.O.M.C. is the U.R.A. 800 of the C.N.R.S. We acknowledge the support of the EU program ”Human Capital and Mobility” and of the PROCOPE/APAPE scientific collaboration program. S.L. acknowledges the support of the DFG, SFB 382 (A6).
REFERENCES
- [1] H. M. Jaeger, S. R. Nagel, and R. P. Behringer, Physics Today 49, 32 (1996).
- [2] E. Clément and J. Rajchenbach, Europhys. Lett. 16, 133 (1991).
- [3] S. Luding et al., Phys. Rev. E 49, 1634 (1994).
- [4] S. Luding, H. J. Herrmann, and A. Blumen, Phys. Rev. E 50, 3100 (1994).
- [5] S. Luding, Phys. Rev. E 52, 4442 (1995).
- [6] S. Warr, J.M.Huntley, and G. Jacques, Phys. Rev. E 52, 5583 (1995).
- [7] P. Evesque and J. Rajchenbach, Phys. Rev. Lett. 62, 44 (1989); E. Clément, J. Duran, and J. Rajchenbach, Phys. Rev. Lett. 69, 1189 (1992); E. Ehrichs et al., Science 267, 1632 (1995).
- [8] S. Douady, S. Fauve, and C. Laroche, Europhys. Lett. 8, 621 (1989).
- [9] S. Fauve, S. Douady, and C. Laroche, J. Phys. (Paris) 50, 187 (1989).
- [10] H. Pak and R. Behringer, Phys. Rev. Lett. 71, 1832 (1993).
- [11] F. Melo, P. Umbanhowar, and H. Swinney, Phys. Rev. Lett. 72, 172 (1994); ibid 75, 3838 (1995); P. Umbanhowar, F. Melo, and H. Swinney (unpublished).
- [12] E. Clément, L. Vanel, J. Rajchenbach, and J. Duran, Phys Rev. E 53, 2972 (1996).
- [13] A. Goldshtein, M. Shapiro, L. Moldavsky, and M. Fichman, J.Fluid Mech. 287, 349 (1995).
- [14] S. Wassgren (private communication).
- [15] M. Faraday, Philos. Trans. R. Soc. London 52, 299 (1831).
- [16] M. C. Cross and P. C. Hohenberg, Rev. Mod. Phys. 65, 851 (1993).
- [17] T. Metcalf, J. Knight, and H. Jaeger (unpublished).
- [18] S. Luding et al., Phys. Rev. E 50, 4113 (1994).
- [19] S. F. Foerster, M. Louge, H. Chang, and K. Allia, Phys. Fluids 6, 1108 (1994).
- [20] B. D. Lubachevsky, J. of Comp. Phys. 94, 255 (1991).
- [21] J. Duran et al., Phys. Rev. E 53, 1923 (1996).
- [22] W. Goldsmith, IMPACT, The theory and physical behavior of colliding solids (Edward Arnold, London, 1960).
- [23] G. Kuwabara and K. Kono, Japanese Journal of Applied Physics 26, 1230 (1987).
- [24] N. Brilliantov, F. Spahn, J. Hertzsch, and T. Pöschel, Phys. Rev. E 53, 5382 (1996).
- [25] L. Landau and E. Lifschitz, Theory of elasticity (MIR, Moscow, 1967).
- [26] O. Walton and R. Braun, Journal of Rheology 30, 949 (1986).