Crossover to Self-Organized Criticality in an Inertial Sandpile Model
Abstract
We introduce a one-dimensional sandpile model which incorporates particle inertia. The inertial dynamics are governed by a new parameter which, as it passes though a threshold value, alters the toppling dynamics in such a way that the system no longer evolves to a self-organized critical state. A range of mean-field theories based on a kinetic equation approach is presented which confirm the numerical findings. We conclude by considering the physical applications of this model, particularly with reference to recent experimental results.
PACS numbers: 64.60.Ht, 02.50.+s, 05.40.+j, 05.60.+w
I Introduction
The concept of self-organized criticality (SOC) was introduced by Bak, Tang and Wiesenfeld [3] as a possible explanation for the common occurrence of scale-invariance in nature. To demonstrate this behaviour, they introduced the sandpile model, a driven dissipative cellular automata whose dynamics are defined by local interactions. Despite the short-range dynamics, the system organizes itself into a non-equilibrium critical state with no finite correlation length and hence no characteristic length scale. A feature common to all SOC systems is that the sizes of fluctuations follow power-law distributions, a direct consequence of the scale-invariance. However, comparisons with real systems have met with only partial success. Power-laws were observed in a granular mixture when avalanches were initiated by watering the pile [4], but not in a pile of glass beads that was gradually tilted [5]. Adding grains individually to a conical sandpile only showed power-laws for sufficiently small piles [6]. Recently, Frette et.al. [7] performed experiments on one-dimensional piles of rice and found power-law behaviour only for grains with sufficiently large aspect ratio. In light of these experiments, we believe it would be informative to construct a sandpile model with greater physical applicability, whilst hopefully retaining some of the interesting dynamics.
One important ingredient missing from the basic model is inertia. To the best of our knowledge, there have only been two attempts to construct an inertial sandpile model. Prado and Olami [8] chose to associate moving particles with a decrease in the local stability, and found SOC behaviour only for small systems, in both one and two dimensions, thus giving an explanation for the results in [6]. Krug, Socolar and Grinstein [9] gave a single measure of momentum to the entire cluster of moving particles in a one-dimensional system. They found that their inertia parameter needed to be fine-tuned to zero for the system to become SOC.
In this paper, we consider a new way of incorporating inertia into the sandpile model. A full description of the model is given in the following section, but briefly, we suppose that moving particles only come to rest on those sites whose slopes are not too steep, where the definition of ‘too steep’ is controlled by a new parameter. Our main result is the crossover between SOC and non-SOC behaviour as this parameter passes through a threshold value. The existence and value of this transition point has been confirmed by extensive numerical analysis, mean-field theories and qualitative reasoning.
This paper is arranged as follows. The new model is defined and some of its immediate consequences explored in section II. In section III, the results of numerical simulations are given for the simplest non-trivial sandpiles. These results are confirmed by the mean-field analysis given in section IV, where a rate equation approach has been adopted. Finally, in section V, we explain the nature of the transition threshold and discuss applying the model to real physical systems.
II The Model
A one-dimensional sandpile is defined by a set of integer heights , , or equivalently by the local slopes . The right-hand boundary is taken to be open, , whereas the left-hand boundary is treated as closed, . Particles are added sequentially to randomly chosen sites, increasing their height by one unit. In the limited local sandpile (LLS) model [10], a site becomes unstable when becomes greater than the critical slope parameter . Any such unstable site will topple, particles leave site and move to site (or leave the system if ), so
| (1) | |||||
| (2) | |||||
| (3) |
with equivalent rules for toppling at boundaries. It is now possible for and/or to become unstable and topple, and an avalanche will begin. We call the series of the initial topplings at sites , , …the back-avalanche. A back-avalanche propagates to the first site with , where such sites are called troughs. In terms of the slopes before particle addition to site , will also stop a back-avalanche. Some previous literature [11] refers to such instances as slide events. Topplings occur on a timescale much smaller and separated from that of particle addition, in that no more particles are added to the pile until the avalanche is over and every site has become stable ( ).
As this model stands, the inertia of the toppling particles has been ignored, any momentum in the topple is assumed to be dissipated instantaneously from the sandpile as soon as the particles have moved. The previous attempts to incorporate inertia into the system [8, 9] used quantities that evolved throughout the avalanche and hence introduced a form of memory into the system. In this paper, we consider a new set of rules for toppling that requires just one extra, time-independent quantity, but nonetheless intuitively mimics inertia. We introduce the minimum-slope inertial limited local sandpile (MILLS) model, which has a second critical slope parameter, the inertial threshold . Now when a site topples, the particles will be deposited on the first site obeying
| (4) |
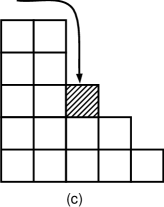
or (if no such site exists) leave the system. This calculation is performed right-to-left for each unstable pile and individually for each of the particles involved in every toppling, recalculating the slopes as a particle comes to rest. An example is given in fig.1 for and . Note that we have implicitly introduced a timeframe for inertial effects which is much smaller than that of toppling events. This separation of timescales means that the time taken for an unstable site to begin to topple is much longer than that for the ensuing particle motion itself.
As a realistic physical system, this model does have some obvious drawbacks, the most notable being that a particle will be stopped just as easily if it has just toppled, or if it has rolled down a large region of slopes . We could of course make dependent on each particle’s previous motion, but it is the lack of inherent memory that makes much of the subsequent analysis possible. Furthermore, with this implementation of inertia the sandpile takes a microscopically smooth, realistic shape which further justifies its study.
We can immediately make some general observations about the MILLS model. Since the particles toppling from an unstable site all move at least one step, the slope of the site to the immediate left will always increase by independent of the value of . Thus, the back-avalanches in this model are identical to those in the standard model, and consequently troughs are still important as bounds of the left-hand edge of an avalanche. However, troughs no longer necessarily bound the right-hand edge of an avalanche as they did in the LLS model. Indeed, no expression involving a single site can now serve as a general right-hand bound, so the previous analysis of the standard model based on troughs [9, 12] cannot be extended to this model.
For , the sandpile soon reaches a trivial steady state with independently of . Inertial effects are now indistinguishable from topplings, added particles move downslope by either mechanism and leave the system in an unaltered state. Varying will change the time taken for the particle to reach the right-hand boundary, but only for can have any influence on the nature of the critical state.
If , inertial effects will dominate and all toppling particles will immediately leave the system, as if the sandpile has become ‘infinitely slippery’. This is equivalent to the case for the model in [9]. Since sites with negative slope are rare, will have a similar effect to . For , no particle will come to rest on a site with critical slope and so no sites to the right of the initial topple can become unstable. As a result, there will be no forward toppling and the avalanche will consist solely of the back-avalanche.
It may appear that implementing inertia in this manner could allow for a large cluster of sliding particles to all come to rest simultaneously on the same site, say a site with large and negative. It is easy to prove, however, that at most particles can stop on a site during any one step in the toppling process. To see this, first realise that a back-avalanche consists of one topple per avalanche time step, so to get more than particles moving at once we must have . Furthermore, a site must topple and subsequently allow at least one particle to slide through it, ie.
| (5) |
so for this sequence of events to occur requires . Although site toppling could contribute to such a large slope, having on the previous step would simultaneously require , except at the left-hand boundary of the avalanche, as closer analysis soon reveals. It should now be apparent that for any site to gain more than particles during any one avalanche step, there must already exist a site in the system to which this has already happened. Since particle addition cannot create such a site, we must conclude that they never occur. Intuitively, this result implies that inertial effects serve only to broaden the shape of the avalanche.
If , inertial effects will be so weak that toppling particles will never move by more than one site, and we just have the LLS model. In fact, from the result given in the previous paragraph, it should be apparent that the maximum slope that a site can reach is , so if , inertial effects become redundant and the MILLS model reduces to the standard model.
![[Uncaptioned image]](/html/cond-mat/9606186/assets/x1.png)
![[Uncaptioned image]](/html/cond-mat/9606186/assets/x2.png)
In [7] it was suggested that it was the shape of the particles that determined the nature of the critical pile. Although any sandpile model is over-simplified compared to real piles of any substance, for instance in failing to allow for the particles to overlap and for ignoring any variation in particle dimensions, it is still instructive to consider qualitatively how the two parameters and might relate to actual systems. Suppose the particles all have an aspect ratio . A vertical stack consisting of rounded particles will clearly be much less stable than a stack of flat particles, so will decrease as decreases. The parameter should also decrease with , since rounder particles will roll more easily and each site will be narrower and hence easier to traverse. Indeed, varying should cause to change faster than does, so we can see that the ratio will increase with . More precise analysis in this manner is possible but any such accuracy is lost within the artificial framework common to all sandpile models.
In summary, the MILLS model differs from the LLS model by the extra parameter . For we just get the LLS model, for the toppling process consists of just the back-avalanche, and for the majority of sliding particles leave the system immediately after toppling.
III Results
Numerical analysis of finite one-dimensional sandpile models is difficult because the convergence to the asymptotic SOC regime is very slow. Indeed, we are not aware of any simulations sufficiently large to demonstrate the power-law behaviour expected in the thermodynamic limit, so an alternative test for self-organised criticality must be employed. If the critical state is governed by exponentially decaying correlations, then increasing the system size far beyond the correlation length could not alter the avalanche size. However, if instead the correlations decay as power-laws, then the critical state is scale-invariant and so the largest avalanche sizes will always vary with the system size. Two examples of dropsize frequency distributions are given in fig.2, where the dropsize is defined as the number of particles to leave the pile as the result of a single particle addition. The distribution broadens for when the system size is doubled, which is clearly not the case for , thus the system is not SOC for . It is obviously important to find the value of between these two extremes at which the transition between SOC and non-SOC behaviour occurs.
The distribution of dropsizes is not always a useful measure of avalanche size, since for the maximum dropsize is just , as the following analysis demonstrates. Suppose an avalanche is started by the addition of a particle onto a site with critical slope, so that before toppling we have and . When site topples, will decrease by at least , possibly more if any particles stick to , so now and . Presuming now that topples, all but possibly one particle will stick to , giving . Even if now topples, no particles can slide past and so now . From now on this is all that happens, toppled particles neither slide nor cause any further topples. The avalanche will eventually end with at most particles from the leading edge of the avalanche moving beyond site and potentially contributing to the dropsize. More qualitatively, toppling is minimal for and the bulk of the sliding is limited to within the avalanche for , so for we should expect particle transport to be low. Less commonly considered measures of avalanche size, such as the total number of topples involved, must be used in this case.

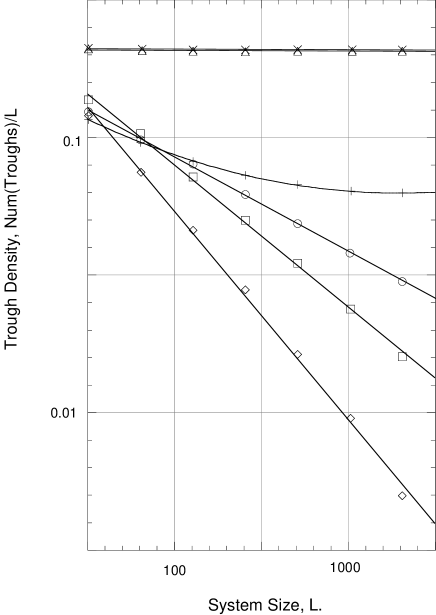
For and , the dropsize distributions broaden with the system size, as shown in fig.3. There is perhaps some hint of a lessening in the broadening for the larger systems. However, long processing times have resulted in statistically noisy data which it is difficult to analyse. An alternative does exist, since when the avalanche size is bounded above by the distance between troughs, so a system with a finite concentration of troughs must have a finite correlation length and hence cannot display SOC. The trough density, being just a single value, is much less susceptible to noise and can be measured reliably for larger . The distribution of trough densities for and for up to 2048 is given in fig.4. That is not SOC is now evident as the trough density tends to a finite value, although this value is small, corresponding to a large correlation length, which explains the observed broadening of the dropsize distribution in small systems. For , the trough density approaches zero with system size faster than for any other value of , corresponding to a singular correlation length and SOC behaviour. These results are borne out by the mean-field analysis in section IV.

Another useful measure to consider is the average slope ,
| (6) |
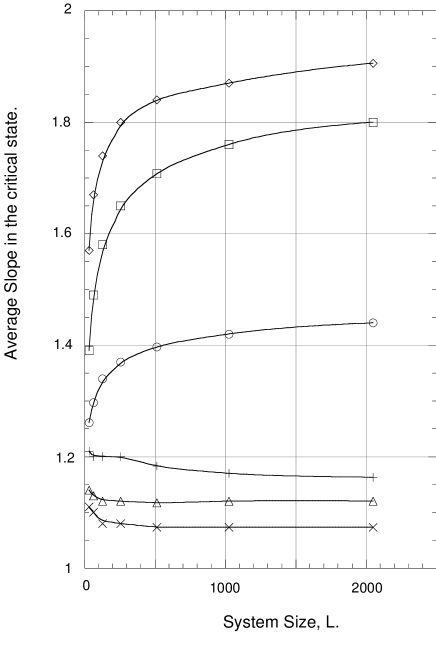
where is the angle of repose. The variation of with and is given in fig.5. For the lines converge on values in the range . It is already known [13] that for the slope for is . Comparing this line to those for other in fig.5, it could be judged that the curves for and are both tending to in a similar manner. Since convergence is slow, however, verifying these asymptotic limits is impossible from this data alone. Taking logarithmic plots to project the lines further, as was done successfully for the standard model [13], fails here as it gives reasonable straight line fits for a range of limiting slopes. Instead, a rough prediction of the asymptotic slope for is given by the following qualitative argument.
For particles leaving the pile cannot cause the rightmost site to topple, although if they will stick there and increase . Once is in the range , all particles will slide over , so is fixed until the end of the current avalanche. The same thing will then happen for site , then , and so on. Thus, the effect of any avalanche reaching the right-hand boundary is to leave behind a cluster of sites with slopes in the interval . Furthermore, the slopes in this region are stable under subsequent particle addition on any site to its left. Similar clusters should grow throughout the pile for similar reasons, although their right-hand edges will not be fixed. This has special significance for , since the clusters of sites will all have slope and is expected to tend to a value at least close to . Given that this system becomes dominated by sites of critical slope, the particles that slide from any avalanche should all leave the pile, thus the modal dropsize should also be the maximum one, . This has been confirmed by the numerical studies.
IV Mean-Field Analysis
Christensen and Olami [14] successfully formulated a random nearest neighbour mean-field model for critical height sandpiles. Directly extending their procedure to critical slope models has proved to be intractable, but the principle of taking random neighbours in an infinite system can still be applied to the MILLS model with some success. Utilising this approach is non-trivial, however, as the dynamics of the system change significantly as is varied. In this section we present a range of models for with , comparing their predictions to the numerical findings. All these models are cast in terms of the slope distribution , where each is defined to be the proportion of sites in the system at time with slope . For convenience, we also define
| (7) |
which is the trough density. As these slopes represent the sandpile in its stable state, the maximum value any can take is two and
| (8) |
The simplest case to analyse is , where any avalanche propagates back to the first trough and all toppled particles are removed from the system. Particle addition alone has the effect of increasing the slope of a randomly chosen site from to ,
| (9) | |||||
| (10) |
and in a similar manner decreasing the slope of another randomly chosen site by one. Troughs are assumed to be primarily sites of slope zero, so increasing the slope of a trough will give a site of slope one, whereas the effects of decreasing the slopes of troughs are ignored.
When a particle is added to a site of slope two, (9–10) must be replaced by equivalent rules for the whole of the subsequent sequence of topples. There are two cases to consider - if the site to the immediate left (here chosen at random) has slope one, a slide event occurs, removing two particles from the system but leaving unchanged. Otherwise, we get a full avalanche which only alters the slopes at its leading edge (where the particle was added) and its trailing edge (at the trough that halted the toppling). The net result of both these edge effects is the lose a trough and a site of slope two, and to gain two sites of slope one. It is now straightforward to write down rate equations for , with the timescale normalised to particle additions per unit ,
| (11) | |||||
| (12) | |||||
| (13) |
These equations can be justified directly - for instance, the first term on the right hand side of (12) corresponds to particle addition onto or adjacent to a site of slope one, the second term is for a particle added to a trough, the third term accounts for particle addition adjacent to or onto a site of slope two, where the latter instance invokes an avalanche, and finally the fourth term subtracts out trivial slide events. In practice, however, it is simpler to derive these equations by writing down all nine possible combinations of pairs of sites, ie. (TT) (T1) (T2) (1T) (11) (12) (2T) (21) and (22), then computing directly the effects of particle addition to the right hand site and weighting them accordingly.
The equations (11–13) converge on the stable solution , in good agreement with the numerical values (0.18,0.48,0.34). Since the influence of sites with strictly negative slope have been ignored, this mean-field theory actually covers the range of all , and indeed the agreement still holds up to . For the avalanching particles can no longer be ignored and new terms need to be added to account for where they come to rest. The expected number of particles brought into motion during an avalanche depends on the state of the site to the immediate left of the site where the first particle was added. If this site has slope less than two then just the one site topples. Otherwise, the number of sites that topple is half the average distance between troughs. In this random neighbour model, the probability that two nearest troughs are a distance apart is . Consequently, half the mean distance between troughs is and the total number of sites that topple during an avalanche is on average . Each toppled site releases two particles, so we will need a factor of two. Furthermore, since avalanches are initiated by particle addition to sites of slope two, we will also need a factor of . Thus, the expected number of toppling particles per unit time is
| (14) |
Each of these particles will stop on a trough, creating a site with slope one. This will also cause the site to the immediate left to decrease its slope by one. Moreover, we know that the particle passed over this site, so it cannot be a trough. Therefore it must have slope one or two with probability or , respectively. Since we are ignoring any correlations between where a particle starts moving and where it stops, all we need to do is to add extra terms to the right hand sides of (11–13) to account for the changes in the slopes caused by the particles coming to rest,
| (15) | |||||
| (16) | |||||
| (17) |
These equations now converge to , whereas numerically the slope distribution is . Note that the trough density is small but non-zero, corresponding to a large but finite correlation length. Thus, as noted in the previous section, large system sizes are required to demonstrate that this system is not SOC.
For , the unique nature of the avalanche requires a new set of rate equations, which can be derived in a similar manner to before by considering the consequences of particle addition to a pair of sites with arbitrary slopes,
| (18) | |||||
| (19) | |||||
| (20) |
where is the expected number of particles that emerge to the right of the particle addition. Although these equations admit the steady solution with and , cubic corrections are required for it to be stable. Numerically, the slopes are for but, as mentioned in section III, the asymptotic slope appears to be which demands the slope distribution .
For , all the sites involved in an avalanche resolve in a highly non-trivial way, so calculating rates between the states before and after an avalanche becomes impossible. Instead, we introduce the following local slope argument to predict the slope distribution in the critical state. Within an avalanche, a toppled site deposits a pair of particles to its right, which, after any inertial motion, settle and possibly cause further toppling. Keeping our random neighbour approach, the expected number of further topples caused takes the same constant value throughout the avalanche. If then avalanches would die out exponentially quickly, particles will not get transported from the pile and so the sandpile would build up, increasing the average slope and hence also . If , avalanches would grow exponentially and large numbers of particles would leave the pile, decreasing . Although transport from the pile is not actually catered for by this model, we infer that in the critical state, so finding an expression for in terms of gives an additional constraint which might help to fix the slope distribution.
This local slope argument has several deficiencies, apart from the obvious drawbacks of the random neighbour approach. Back-avalanches have been ignored, so this method will certainly break down for . The effects of single particle addition has not been accounted for, which will further exasperate the situation when is small. Although this gives a limited range of applications for this model, it has the advantage of being conceptually and mathematically simple. For instance, in the standard model , adding two particles to any site with a slope greater than zero will cause one further topple, so . Requiring that this equals one gives , as expected.
For , consider the effect of adding the particles to two adjacent sites, and . If , then both particles would stick to , giving the site a slope , which will topple if . However, if then the last particle added will slide onto the adjacent site, resulting in and remaining unchanged. Thus, the expected number of further topples is
| (21) |
Setting this equal to one and employing (8), we get an equation for the trough density,
| (22) |
By definition, all the must lie in the range [0,1]. However, (22) is strictly negative for , so for consistency we must have or . Avalanches could never begin in a system with , so we conclude that , in agreement with the numerical work.
V Conclusions and Discussion
It has been demonstrated that the MILLS model with displays self-organized criticality for systems with , but SOC is lost when . The SOC state for was identified by the broadening of the dropsize distribution with the system size, whereas for the existence of a finite correlation length was found both numerically and from the mean-field theories. Preliminary numerical results for up to 4 demonstrate that the transition point holds more generally. We postulate that for all the model is SOC only when , and now argue why this should be so.
An essential requirement of any SOC system is that it is governed by local driving forces [3]. For , inertial effects only come into play inside an avalanche, since it is only within an avalanche that sites with slopes greater than can occur. Thus, the couplings remain short-range and SOC behaviour is preserved. For , however, particles can slide far beyond the avalanche, so interactions become non-local and the system ceases to be SOC. We might na vely expect that a system with will also fail to be SOC, especially since the system becomes dominated by sites of slope , which should allow particles to slide through large distances. However, the exact analysis in section III proved that only a tiny proportion of particles move beyond the avalanche. In fact, the vast majority move by just one site, which is certainly a local driving force, so we can conclude that a system with is SOC.
In the experiments carried out on piles of rice [7], power-law behaviour was only observed for rice with sufficiently large aspect ratio. In section II it was argued that should increase with the particle aspect ratio. Thus, if the aspect ratio is increased such that becomes greater than , the MILLS model gives a possible explanation for the appearance of power-laws - the system has crossed over into the SOC regime. However, many non-SOC systems also exhibit power-law behaviour, and an alternative model has recently been proposed by Newman and Sneppen [15]. Here, they claim that an SOC approach is invalid when the power-laws have characteristic exponents in the vicinity of 2, as was observed for the rice piles. Their model is instead driven by external noise, but still predicts a crossover from power-law behaviour.
Regardless of its experimental applications, the MILLS model represents an interesting addition to the range of sandpile systems already studied, in that it provides an inertial sandpile model which is SOC for a broad band of parameter space - that is, without the need for fine tuning - and independent of the system size. Extending this model to higher dimensions or to critical height sandpiles should in principle be straightforward, but since our original motivation was to try and account for the results from the rice pile experiments, we chose to base our model on that system.
REFERENCES
- [1] e-mail address: David.Head@brunel.ac.uk
- [2] e-mail address: G.J.Rodgers@brunel.ac.uk
- [3] P.Bak, C.Tang and K.Wiesenfeld, Phys.Rev.A 38 364(1988).
- [4] E.Somfai, A.Czirók and T.Vicsek, J.Phys.A 27 L757(1994).
- [5] H.M.Jaeger, C.Liu and S.R.Nagel, Phys.Rev.Lett. 62 40(1989).
- [6] G.A.Held, D.H.Solina II, D.T.Keane, W.J.Haag, P.H.Horn and G.Grinstein, Phys.Rev.Lett 65 1120(1990).
- [7] V.Frette, K.Christensen, A.Malthe-Sørenssen, J.Feder, T.Jøssang and P.Meakin, Nature 379 49(1996).
- [8] C.Prado and Z.Olami, Phys.Rev.A 45 665(1992).
- [9] J.Krug, J.Socolar and G.Grinstein, Phys.Rev.A 46 R4479(1992).
- [10] L.P.Kadanoff, S.R.Nagel, L.Wu and S.Zhou, Phys.Rev.A 39 6524(1989).
- [11] J.M.Carlson, J.T.Chayes, E.R.Grannan and G.H.Swindle, Phys.Rev.A 42 2467(1990).
- [12] J.Krug, J.Stat.Phys 66 1635(1992).
- [13] A.B.Chhabra, M.J.Feigenbaum, L.P.Kadanoff, A.J.Kolan and I.Procaccia, Phys.Rev.E 47 3099(1993).
- [14] K.Christensen and Z.Olami, Phys.Rev.E 48 3361(1993).
- [15] M.E.J.Newman and K.Sneppen, preprint 1996 (cond-mat/9606066)