[
Multiband Electronic Raman Scattering in Bilayer Superconductors
Abstract
A theory of electronic Raman scattering in the presence of several energy bands crossing the Fermi surface is developed. The contributions to the light scattering cross section are calculated for each band and it is shown that the cross section can be written in terms of the sum of the single band contributions and a mixing term which only contributes to the fully symmetric channels . Particular emphasis is placed on screening in bilayer superconductors. Since any charge fluctuation with long range character in real space is screened by the Coulomb interaction, the relevant fluctuations in a single layer case are induced between different parts of the Fermi surface. In a single band -wave superconductor the scattering at energy transfer twice the maximum gap is dominated by those parts of the Fermi surface where is largest. As a consequence, the fully symmetric () scattering is screened. In the case of a bilayer superconductor however, the charge transfer is possible between layers inside the unit cell. Therefore a formalism is considered which is valid for general band structure, superconducting energy gaps, and inter-layer hopping matrix elements. The spectra is calculated for La 2:1:4 and Y 1:2:3 as representative single and bilayer superconductors. The mixing term is found to be negligible and thus the response is well approximated by the sum of the contributions from the individual bands. The theory imposes strong constraints on both the magnitude and symmetry of the energy gap for the bilayer cuprates, and indicates that a nearly identical energy gap of symmetry provides a best fit to the data. However, the part of the spectrum depends sensitively on many parameters.
pacs:
PACS numbers: 74.20.Mn, 74.60.Ge, 64.60.Ak, 74.40.+k]
I introduction
In the recent few years Raman scattering has been proved to be a very powerful tool to study the anisotropy of the superconducting energy gap in high-Tc superconductors[1, 2, 3, 4]. Even if Raman scattering (in clean materials) can give information only about the absolute value of the superconducting gap, the spectra clearly indicate the extremal points of the gap as the maxima and minima which show up as singularities in the electronic density of states. The spectra show that the electronic part has essential density of states below the maxima associated with the maximum of the energy gap. On the other hand, the data clearly shows that there is only one sharp maximum in the spectra, indicating that the absolute value of the maximum and minimum of the gap are very close[5, 6, 7]. Thus the gap smoothly interpolates between and and no other singular part exists. Such a gap occurs in wave superconductors. One can clearly state that if the gap contained mixtures of different symmetries, the wave part at least must be the dominant one[1].
The experiments carried out with different polarization orientations pick up the contributions to the light scattering on different parts of the Fermi surface. For example, incident and scattered light polarizations aligned along or , select then the or part of the spectra is measured, where the coordinate system is locked to the CuO2 planes. Measuring the spectra provides information mainly concerning the light scattering in the neighborhood of the and axes, spectra probes mainly along the diagonals, and is a weighted average over the entire Brillouin zone. The sharpest spectra are observed in the channel and thus the maxima of the absolute value of the energy gap must lie along the axes, supporting a gap of symmetry. The recent experiments carried out in different hole doped high-Tc materials provide almost identical spectra showing very characteristic differences between the various polarization orientations[5].
In forming the Raman spectra, long-range Coulomb screening plays a very important role. Namely, those parts of the spectra which are coupled to the Coulomb fields are screened and do not appear in the limit of small momentum transfer , as is always the case. The long-range Coulomb forces play an important role if there is charge transfer between unit cells at large distances. Thus only the charges produced by charge transfers inside the unit cell determine the measurable spectra. This transfer is between the different atoms in the cell or the redistribution of the electrons between different parts of the Fermi surface or between different Fermi surfaces. In this way, only the part of the spectra can be coupled to the Coulomb forces. This argument is based on the assumption that only one Fermi surface is relevant, which is very reasonable for materials with a single CuO2 plane in the unit cell. Recently Krantz and Cardona [4] have raised the relevant question how a double-sheeted Fermi surface, as occurs in materials with more than one CuO2 planes in the unit cell, changes the above argument.
The general idea of charge transfers between different regions of space with energies nearby the Fermi level is very similar to the case of semiconductors, where the electrons or holes can be redistributed among several valleys of the conduction bands or the different parts of the valence bands[8].
Except for scattering in the channel. the presence of the double layer does not affect essentially the theory of Raman scattering as the Coulomb screening does not play a role. In the symmetry, however, additional effects may occur as expected by Ref.[4]. Therefore, the channel will be examined in great detail in the present paper.
The main question is whether or not in the double layer compound a singularity can occur at 2 in the symmetry, similar to the one which occurs in the case. In the single layer compounds the calculations show that the peak with symmetry is far from being singular, with a position ranging from somewhat near [1, 2] to slightly below [4].
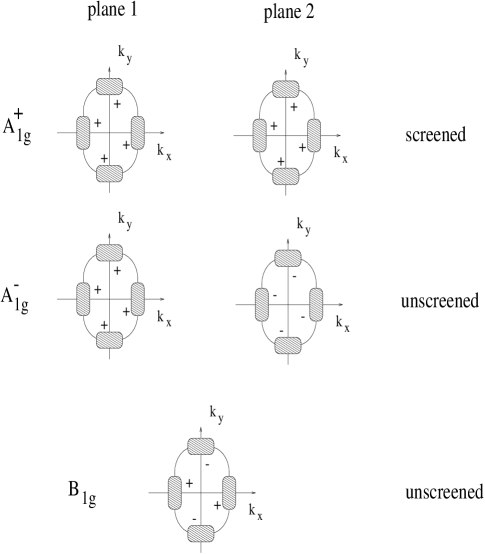
The consideration will be focused on the energy range , thus nearby the singular contribution. If there is a singularity at , then the region nearby the axes dominates the spectrum and from the point of view of screening the other parts can be ignored as their relative weight disappears as . In Fig. 1, those regions of are shown, which is also where the absolute value of the gap is maximal. There, the Fermi surface of the two layers are shown. Of course, in a more appropriate discussion followed in the present paper, the even and odd (bonding and anti-bonding) combinations of the wave functions of the layers must be introduced. In order to first get an insight the labels of the CuO2 layers is used. Considering the electronic density, the singular regions of the Fermi surface are indicated by small ellipsoids with a strong resemblance to the different valleys in the case of multivallied semiconductors. The two layers double the number of these regions. In the case of symmetry the charge transfer is between the region of the and axes, respectively, and changes sign going from one region to the other. In contrast, for symmetry, each region has the same phase on a particular Fermi surface. Therefore, in the case of the single layer material, considering the singular part, the charge transfer is only between different cells, which is screened. In the double layer case, the symmetry allows a charge transfer between the two layers of both the same and opposite sign on each Fermi surface. Using the bonding and anti-bonding wave functions of the two layers, the odd combination plays an important role.
Considering the interlayer charge transfer process, the question must be raised how the light coupled to both planes in a similar way can result in a charge transfer between the symmetrically displaced layers. That discrepancy can be resolved only by considering the coupling between the planes which automatically leads to the introduction of the a bonding and anti-bonding wave functions. The coupling leads to a split of the two bands which is also a measure of the possible charge transfer between the planes, as will be discussed in the present paper. A nearly singular peak at can occur if the splitting of the superconducting gaps for the electrons with even and odd wave functions is small. The strength of the peak is proportional to the square of the difference between the Raman efficiency , where correspond to the coupling of light to the bonding and anti-bonding electrons, respectively. This difference can be demonstrated in the limit where the incident and scattered photon energies are small compared to the relevant band energies. In this limit, is proportional to the splitting of the effective mass in the two bands. It turns out that considering a realistic description of YBa2Cu3O7 and Bi2Sr2CaCu2O8, the splitting of the mass is less than 10 percent[9]. Thus the peak at can not have a larger relative intensity then . If that argument holds, the spectra must be very similar to those calculated from the two separate uncoupled layers and the effect of the coupling is very likely to be beyond the observable range.
In our paper, we consider the most representative of the single and double layer compounds La 2:1:4 and Y 1:2:3, respectively, while we will only briefly mention the multilayer compounds, such as Tl 2:2:3:2, in the Appendix since the main physical ideas can be best illustrated by contrasting the single and double sheet compounds.
II model and calculations
The simple model which contains the physics of bilayer systems is given by
| (1) | |||
| (2) |
where is the in-plane momentum, represent the given plane indices and the sum over spins is implicitly included. represents the interplane coupling, through which electrons can hop from one plane to the other directly or through an intermediate state such as the chains or Y atoms. are the band energies for the separate planes in the absence of an interlayer coupling.
Due to the mirror plane symmetry of the bilayer, the above Hamiltonian can be diagonalized by considering even and odd combinations of electron operators on the two planes. We introduce the new operators
| (3) |
allowing us to rewrite the Hamiltonian in diagonal form
| (4) |
with the bonding and anti-bonding band energies given by , respectively, where for simplicity we have taken degenerate bands in the absence of interlayer coupling: . Also we have defined .
The intensity of Raman scattering can be given as a scattering off an effective charge[10]
| (5) |
where are the plane indices and is the Raman scattering amplitude. The effective charge is a nonconserving quantity in contrast to the real charge. Here the Raman vertices are related to the incident and scattering photon polarization vectors , resulting from a coupling of both the charge current and the charge density to the vector potential. In general the Raman vertex depends non-trivially on both the incident and scattered photon frequencies. In the case of a bilayer system the light can interact with the electrons on the planes or the atoms in between. The effective charge can be rewritten in terms of the bonding and anti-bonding combinations of the bands,
| (6) | |||
| (7) |
where
| (8) | |||
| (9) |
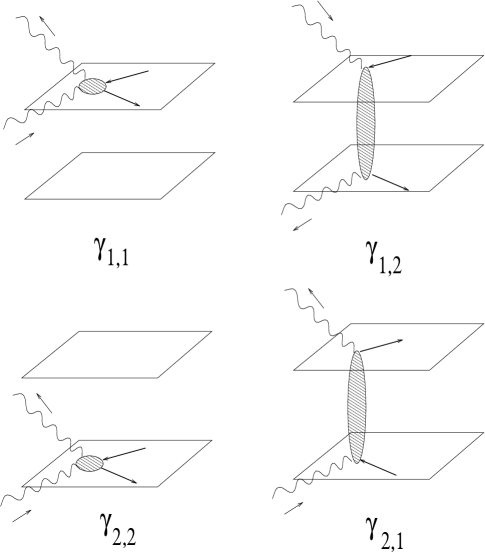
This corresponds to a diagonal contribution which allows light to be scattered by density-like fluctuations on either plane 1 () or plane 2 () and an off-diagonal term () which allows light scattering on both planes simultaneously (see Fig. 2). Since in the limit of the long-range intercell fluctuations are screened, only the intracell fluctuations remain. Therefore only charge transfer fluctuations between the atoms in the plane and outside the plane (e.g., and the chains), and between the planes can effectively cause light scattering. Since experimentally the interlayer coupling is small, the resulting vertex must be smaller than the combination, labelled as . Similar considerations have been applied to the case of multi-valley scattering in the conduction band of semiconductors. In the case when the intervalley scattering does not take place, no light scattering can occur as the density fluctuations are screened completely. Scattering is restored when inequivalent valleys are considered or the scattering is between different parts of the valence band.
According to Abrikosov and Genkin[11] if the energy of the incident and scattered frequencies are negligible compared to the relevant energy scale of the band structure, can be expressed in terms of the curvature of the bands and the incident and scattered photon polarization vectors as
| (10) |
where terms of the order of are dropped. This expression is valid given that the incoming laser light cannot excite band-band transitions. This effective mass approximation has been extensively used to calculate the Raman spectra in unconventional superconductors.
However one might question the appropriateness of this approximation for the cuprates given that typical incoming laser frequencies are on the order of 2 eV - certainly on the order of the relevant electronic energy scale for a single band. For the case of two bands near or crossing the Fermi level, the effective mass approximation is even more questionable. Since in the bi-layer superconductors Bi 2:2:1:2 and Y 1:2:3 the band splitting of the even and odd bands is on the order of tens of meVs, the approximation misses large terms corresponding to interband transitions at relatively small energies. Detailed knowledge of the magnitude of the scattering amplitude in this case requires knowledge of the wave functions of the two states, which has currently not been investigated. Thereby, use of the effective mass approximation is uncontrolled in many band systems and comparisons to experiment intensities must be viewed with caution. A discussion of this point is elaborated in the Appendix.
However, even if the above assumption does not hold in the actual experiments, this gives an insight into the relative orders of and , or in other words measures the splitting between and (see Eq. (6)). Without interlayer coupling the degenerate bands have the same dispersion such that , which holds generally due to reflection symmetry.
An alternative approach is based on the experimental observation that the spectra near optimal doping for a wide range of cuprate materials depends only mildly on the incoming laser frequency. Since the polarization orientations transform as various elements of the point group of the crystal, one can use symmetry to classify the scattering amplitude, viz.,
| (11) |
where are either Brillouin zone (B.Z.H., orthogonal over the entire Brillouin zone) or Fermi surface (F.S.H., orthogonal on the Fermi surface only) harmonics which transform according to point group transformations of the crystal[12]. Representing the magnitude but not the -dependence of both intra- and interband scattering, the prefactors can be approximated to be frequency independent and taken as model constants to fit absolute intensities. Thus we have simplified the many-band problem in terms of symmetry components which can be related to charge degrees of freedom on portions of the Fermi sheets. While sacrificing information pertaining to overall intensities, we have gained the ability to probe and compare excitations on different regions of the Fermi surface based solely on symmetry classifications. This can be illustrated by considering the various experimentally accessible polarization orientations.
Using an coordinate system locked to the CuO2 planes, incident and scattered light polarizations aligned along for example transform according to symmetry, and thus
| (12) |
where are higher order B.Z.H. Likewise, aligned along transforms as :
| (13) |
The basis function is
| (14) | |||
| (15) |
where the expansion parameters determined via a fitting procedure with experiment[13]. The response is not directly accessible from experiments and must be obtained by subtracting several combinations of the response for various polarization orientations.
By considering the dependence of the basis functions, it is clear that the part of the spectra essentially probes light scattering events along the or axes, probes the diagonals, and is more of an average over the entire Brillouin zone. It is in this manner that information about the momentum dependence of the superconducting energy gap can be usefully extracted from the data[1]. That information lies in two important aspects: the low frequency power- law behavior of the spectra and the positions of the low energy peaks.
At this point we can derive an expression for the cross section of the two band system. First we define the dependent Tsuneto function as[1, 2]
| (16) | |||||
| (17) |
Here and we have set . We have neglected vertex corrections of the pairing interactions which while responsible for maintaining gauge invariance and producing collective modes[10], can be shown to have only a limited effect on the spectra at low energies for wave superconductors[1].
The Raman cross section is related to the Raman density correlation function via the fluctuation-dissipation theorem,
| (18) |
with
| (19) |
with the time-ordering operator and the imaginary part is obtained by analytic continuation, . In order to take into account the long-range Coulomb screening in the limit of , the following formula must be calculated
| (20) |
where is given by Eq. (14), and
| (21) |
| (22) |
It is straightforward now to calculate the light scattering cross section for the two band model using Eqs. (5-6) and (12-17). We arrive at the following compact expression for the cross section:
| (23) | |||
| (24) |
where is the Tsuneto function for the bonding/anti-bonding band, with energy gap . Rearranging terms, we can cast the result in terms of an addition of the result for each single band plus a mixing term:
| (25) |
where
| (26) | |||
| (27) |
| (28) | |||||
| (29) |
Eqs. (19-21) are our central results. It shows that the total response can be considered as a sum of the single band contributions in addition to a mixing term which corresponds to odd combinations of fluctuations on the bands simultaneously (see Fig. 1). In order to discern the features of the mixing term, it is useful to write , where the average of around the Fermi surface vanishes. The Fermi surface average of a quantity is defined as
| (30) |
Then it useful to consider the following cases:
(1) If the layers are uncoupled, then and the mixing term vanishes: .
(2) If the scattering in the symmetry channel is independent of for each band (as in the case of scattering on real charge), then . This means that the light scattering induces an interlayer charge transfer.
(3) Considering when the light induces charge transfers on different parts of the Fermi surfaces, must be included and includes different symmetry channels depending on the orientation of the incident and scattered light polarizations. symmetry reflects the approximate tetragonal symmetry of the CuO2 planes, while the part of showing symmetries different than (e.g., and ) changes sign when symmetry transformations are applied. The Tsuneto function depends only on the energy gap squared, and thus all the sums in Eq. (21) are zero except for the component of . For tetragonal materials, this means that the and channels do not have a mixing term and therefore the total response for these channels is simply the additive contributions from each single band. The mixing term only contributes to the channel, the strength of which is roughly determined by the interlayer coupling.
In the following section, we will investigate Eqs. (19-21) in detail for the single layer compound with different Fermi surfaces (section IIIA.) and bi-layer Y 1:2:3 (section IIIB).
III evaluation for model superconductors and discussion of results
We start by considering previous approaches[1, 2, 3, 4]. The majority of the calculations have been performed by restricting the k-sum onto the Fermi surface[1, 3, 4]. While giving qualitatively insightful description of the resulting Raman spectra, this approximation does not capture important physics of charge dynamics over the entire Brillouin zone, such as the role of van Hove singularities, and since the energy gap is a sizeable portion of the bandwidth, neglecting light scattering which breaks Cooper pairs at energies off the Fermi surface will miss large contributions to the overall cross section. This has been pointed out in the recent calculations of Branch and Carbotte [2]. Moreover, since the channel measures weighted averages over the Fermi surface, restricting the calculation for the spectra to only the Fermi surface would generally overemphasis the effect of small changes of the Fermi surface manifold due to the presence of the gap singularities. Therefore, in our opinion the entire k-sum must be performed.
In the following we confine ourselves to tetragonal systems with in-plane lattice constant which can be modeled in the absence of interlayer coupling by the following band structure:
| (31) | |||
| (32) |
This form of the band structure results from a downfolding of an 8 band Hamiltonian into a single band as described in Ref. [15]. The parameters , and can either be taken from LDA calculations[15] or be taken as parameters to fit the Fermi surfaces observed via photoemission[16, 9].
A Single layer case
In this section the Raman response for a single CuO layer is obtained by evaluating the -sums directly for the parameters for La 2:1:4[14] and Y 1:2:3[15].
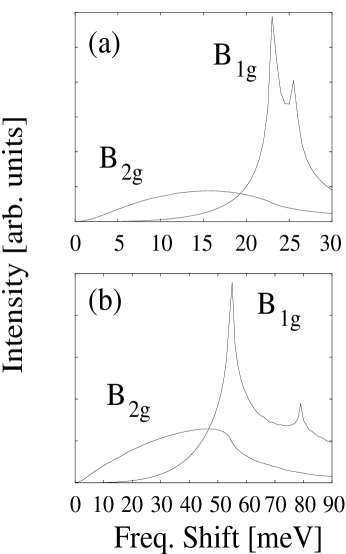
The and responses are plotted in Fig. 3 using an energy gap of symmetry, , with chosen to be 12 (30) meV for La 2:1:4 (Y 1:2:3), respectively, in order to match the position of the peak to that seen in experiment[5]. In both cases, the response for low frequencies varies as while the varies linearly with . This can be shown to be generally true for these channels for any number of higher harmonics used, and results from a consideration of the density of states (DOS), which varies linearly with energy due to the nodes, and the behavior of the Raman vertex near the gap nodes. Since the vertex is finite near the nodes, the DOS determines the low frequency behavior. However, the gap and the vertex vanish at the same place for the channel, which in turn leads to the cubic behavior. This delicate interplay of vertex and energy gap can thus provide a unique determination of the nodal gap behavior.
Moreover, additional information lies in the peaks of the spectra. A smooth peak is seen for and a double-peak is obtained for . The lower peak is due to the energy gap while the other comes from the van Hove singularity. The peak of the spectra due to superconductivity in both cases is higher for the channel () than for , () since the gap maxima are located at the same part of the Fermi surface where the basis function is largest, and where the basis function vanishes. This is generally true regardless of Fermi surface shape, although the relative positions of the peaks can be affected slightly by changing the underlying manifold (see Figs. 3a and 3b and Refs. [1, 2, 3]). The shape of the spectra can also be slightly modified by considering higher harmonics of the energy gap [2] and/or by including final-state interactions[1] or impurity scattering[17]. Apart from the last case, the power-law behaviors at low frequencies are unaffected and therefore their observation is a robust check on the symmetry of the energy gap.
The van Hove peak only shows up in the channel since the channel assigns no weight to the location of the van Hove points. The van Hove peak lies at a higher energy determined by its location off the Fermi surface and the value of the energy gap there. There are indications that a double-peak feature has been seen in underdoped Y 1:2:3 with a T[6]. As the van Hove moves further away from the Fermi surface for example with doping, the peak shifts to higher frequencies and has a smaller residue. Inelastic scattering at higher energies will also act to smear out this feature and thus a single smeared and perhaps asymmetric peak would be seen if the van Hove lies quite near the Fermi surface, and could in principle move the peak slightly above . This may be reflected in the experiments of Ref. [7] which saw a sensitivity of the peak position to doping.
In Fig. 4 we show a calculation of the unscreened and screened response for a paired superconductor for the Y 1:2:3 parameters. We have chosen the coefficients in Eq. (11) using the effective mass approximation[13]. By again considering the nature of the nodal structure of the energy gap, since the response measures a weighted average of charge fluctuations around the Fermi surface, it can be shown that the low energy part of the response must vary with energy in the same way as the DOS.
The screened and unscreened responses at higher energies are very different. For the unscreened response, two peaks arise corresponding to the singular contribution of pair breaking along the axes and the van Hove contribution as in the channel. Screening completely reorganizes the spectra to remove both peak contributions, replacing them with a much smoother function with more spectral weight at lower energies and a much reduced spectral weight at higher energies. This is due to the screening function (2nd part of Eq. (15)) which also contains peaks at due to the weighting along the and axes, and the van Hove. These peaks cancel the unscreened peaks and create a mild shoulder lying near , as seen in Fig. 4.
These results are different than those obtained previously for the case of a simpler evaluation of Eq. (18) on a cylindrical Fermi surface [1] and for a more thorough evaluation of Eq. (18) using the full k-sum and a consistent treatment of the harmonics for both the band structure, Raman vertices, and energy gap[2]. Since publication of Ref. [1], a numerical error was detected in the code which once corrected also produced curves similar to the one shown in Fig. 4. This is treated and corrected in a forthcoming publication [20]. We also note that Ref. [4] also produced an response which is peaked near , but remark that these calculations were performed by neglecting the real parts of Eq. (20).
In an effort to understand these differences we have investigated Eq. (20) for various choices of band structure, Raman vertices, and additional harmonics added to the energy gap. While we found that the linear power-law rise of the response is robust to changes in parameters, the position of the peak in the spectra can vary anywhere less than or equal to depending on the choice of parameter sets. This suggests that the calculations for the screened response are unstable to the inclusion of higher order Brillouin zone harmonics for either the energy gap, band structure, or the Raman vertex.
Specifically, we have included the next few harmonics for a energy gap,
| (33) | |||
| (34) |
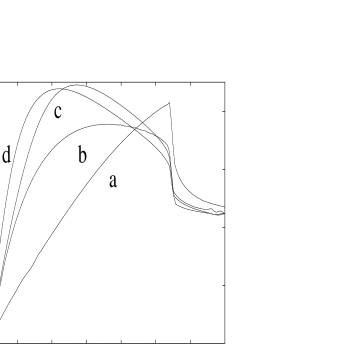
and used the parameters in Eq. (11) for the vertex derived from the band structure[13]. The results are summarized in Fig. 5, which shows the various forms for the screened response using different combinations of energy gap harmonics. This result suggest that the weighting of the vertex in the Brillouin zone depends strongly on a variety of parameters and can easily weight regions where the energy gap is quite different for small changes in the parameters. This results in varying positions of the peak. In general, including higher harmonics for the energy gap pushes the peak in the channel downward from near , which is in agreement with the results obtained by Branch and Carbotte[2]. We are then to conclude that the position of the peak can not provide useful information without detailed knowledge of the fine structure of the energy gap itself even for the case of a single band near the Fermi level.
In this manner, similar symmetry considerations can be made for various types of energy gaps. The Raman spectra calculated for various energy gaps is summarized in Table 1 and compared to the low energy DOS . The dominant contribution to the Raman lineshape is due to the location and behavior of the energy gap near both the nodes and the maxima. Subsequently, different energy gaps produce different line shapes as summarized in Table 1. Here it is important to note that the cubic rise of the spectra in any channel requires that both the vertex and the energy gap have the same behavior near the nodes. In tetragonal systems, this requires the presence of a energy gap. By considering small orthorhombic distortions, the and channels become mixed and therefore a linear rise with frequency could be obtained at low energies in a region determined by the amount of symmetry breaking. Since experimentally the low frequency part of the spectra rises cubically in the most tetragonal systems, while in Y 1:2:3 the spectra may have an intrinsic small linear part, this strongly suggests the likelihood of a pair state for these systems. Exploration of the low frequency part of the spectra could put stringent constraints on other pair-state candidates.
B Bi-Layer
In this section we consider the bi-layer superconductor Y 1:2:3. For the interlayer coupling , we follow Ref. [15] and define
| (35) |
with . In the absence of inter-layer coupling the chemical potential is chosen so that . The two Fermi surface sheets are shown in Fig. 6 for these choices of the parameters. Lastly, we choose the energy gaps on the two bands to be of the type, , and further choose meV for both bands for simplicity.
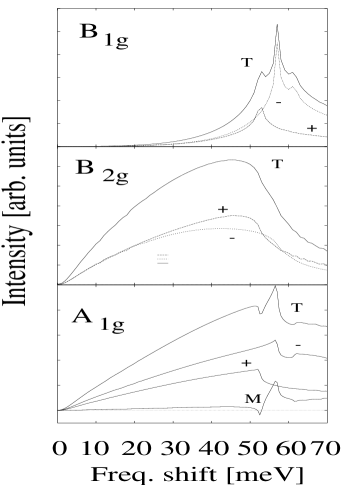
The resulting spectra for the bonding and anti-bonding bands, as well as the mixing term for are shown in Fig. 7. Here again we have used the effective mass approximation for the expansion parameters of Eq. (11) for illustration[13], although as indicated earlier this approximation does not hold for this bi-layer system. Considering the and channels, which are simply additive, it can be inferred from experimental result which shows only one peak in these channels that either the energy gap is nearly identical both in symmetry and magnitude or alternatively that the Raman response is given predominantly by one band. Otherwise two distinct peaks would appear (if gaps have different symmetry and/or magnitude) and identical power-law behavior for each channel would be seen (if the gaps were of different symmetry but same magnitude)[18]. Since the band splitting is relatively small in Y 1:2:3 and even smaller in Bi 2:2:1:2, the second possibility in our opinion is unlikely[9]. Therefore, the energy gap on each band must be similar on energy scales determined by the amount of inelastic scattering which would smear a double-peak feature. Again we note that the sharp nature of the peak would imply that its position and shape would be most sensitive to the location of the van Hove points for each band and the maximal value of the energy gaps[6, 7]. In fact, as shown in the Fig. 8, the van Hove peak in some cases can be stronger than the peak which could erroneously lead to an overestimated value of Tc.
Due to the small bi-layer splitting the mixing term for is small, as shown in Fig. 7. Two very small peaks with opposite curvature at roughly for each of the bands are seen due to the odd combination of interlayer charge transfer, as suggested by Krantz and Cardona. These peaks are non-divergent and are strongly suppressed compared to the contributions from the individual bands. Since adding electron correlations suppresses the bi-layer splitting even further[19, 9] the mixing term is only of minor importance and the resulting spectra can be well approximated as the sum of the contributions from the two individual bands. In this way, a consistent picture can emerge since experimentally the electronic Raman spectra do not differ substantially in the bi-layer or single-layer materials [1, 5].
We have also checked the effect of abandoning the effective mass approximation for the vertex as well as adding additional harmonics to the energy gap, as considered in the previous section. Our results are shown in Fig. 8 for the parameters chosen to most closely model the experimental data [5]:
The results show that the peak of the spectra moves downward in frequency with the inclusion of the additional energy gap harmonic as for the single band case, while the mixing term and power-law behavior remains unaffected. The peak is pushed to lower frequencies by the inclusion of the higher harmonic for the energy gap as seen in Ref. [2], but can be shifted back by including the next harmonic for the Raman vertex. The resulting peak lies roughly 30 percent lower than the peak in the spectrum. The van Hove feature does not change appreciably and thus the channel changes are quite small. The power-law behavior is unaffected, as remarked earlier. From these results we can then conclude that the Raman response for the bi-layer can be well modelled by the added response calculated for the two separate energy bands with the only difference is that the use of the effective mass approximation is invalid (see the Appendix for more details).
IV Conclusions
We have seen that electronic Raman scattering contains a wealth of information concerning the nature of superconductivity in unconventional superconductors which can be extracted from symmetry considerations alone. When applied to the experimental data for doped cuprate materials, good agreement can be obtained for pairing in single band materials, and nearly identical gaps of symmetry for bi-layer systems. The analysis is based on the prominent behavior of the spectra at low frequencies and the approximate position of the maxima for each channel. It is also worthwhile to point out that similar considerations can be applied to the optically active phonon lineshapes below [21].
In this paper we confined ourselves to the simple case of clean, weakly coupled unconventional superconductivity. As pointed out earlier, like other correlation functions Raman in clean systems is insensitive to the phase of the order parameter around the Fermi surface. Moreover, as a consequence of taking the limit, the considered spectra vanishes as one approaches Tc due to phase space constraints. Both of these deficiencies have been remedied recently by considering both the effect of impurity scattering[17, 22]. As shown previously, disorder effects on unconventional as opposed to conventional superconductors can in principle be used to determine whether the gap averages to zero around the Fermi surface[23]. In particular, the disorder dependence of the exponent of the low frequency and/or temperature dependence of the channel provided a useful signature of gap phase properties[17, 22]. While the resulting spectra could be applied to low frequencies, the flat “Marginal” behavior at high frequencies cannot be reproduced by this method. However, that can be corrected by considering spin fluctuation scattering or electron-electron scattering due to nesting[17, 22, 24]. However, more work is needed to correctly describe the full channel dependent Raman spectra for large frequency ranges for optimally doped cuprates.
Further, we have seen that the lineshape of the screened response is sensitive to parameter changes and to the number of harmonics used for the energy gap. However, the low frequency behavior and the general “flatness” of the lineshape seems to be independent of parameter choices. We remark that a consistent treatment of the number of harmonics used for the band structure, Raman vertices, and energy gap must be considered to give meaningful results for the peak position. Without a more detailed knowledge of the actual -dependence of the energy gap (symmetry is not enough), a theoretical description of the peak of the spectrum in the channel is incomplete. In addition, a recent study found that the position of the peak did not move under pressure, in contrast to the peak in the channel[25], which may indicate that the peak in may not be directly related to the charge degrees of freedom. Clearly, further work is needed.
Moreover, further work is needed in order to understand the properties of the Raman spectra away from optimal doping[5, 6, 7, 26]. It is suggested that the peak may be the most sensitive to doping due to (1) the sharpness of the peak, (2) the role of the van Hove singularity, and (3) the sensitivity of the Fermi surface along the axes to small changes of the band structure parameters. However, in order to understand the effects of doping and to arrive at a more complete picture of Raman scattering in the cuprates, a particular model of superconductivity is needed as is a more sophisticated approach for handling the spin degrees of freedom.
Acknowledgements.
We wish to thank M. V. Klein, J. C. Irwin, R. Hackl, D. Einzel, M. Cardona, J. Carbotte, D. Branch, and G. Blumberg for many enlightening discussions. This work was supported by the U.S.-Hungarian Science and Technology Joint Fund under Project Number 265, NSF Grant No. DMR 95-28535, and by the Hungarian National Research Fund under Grants No. OTKA T016740, T021228, 7283, and T020030. One of the authors (T.P.D.) would like to acknowledge the hospitality of the Institute of Physics at the Technical University of Budapest, the Research Institute for Solid State Physics, and the Walther Meissner Institute für Tieftemperaturforschung, where parts of this work were completed.V Appendix: Extension to bands crossing the Fermi level
In this appendix we develop formulas for electronic Raman scattering applicable for a multiband model. Our goal is to show that
i) the use of the effective mass approximation for the Raman vertex is unjustified in case of more than one band crossing the Fermi level, and
ii) there can be no divergence in the Raman spectrum in the superconducting state.
First we recall that the differential electronic Raman scattering cross section is given by[10]
| (36) |
where is the difference between the incoming and scattered light frequency, is the Thomson radius, and
| (37) |
For a Bloch electron system with one-electron states the effective density operator is represented as
| (38) |
with is the difference of the incoming and scattered light wavenumber. In the experimental situation relevant for Raman scattering , and the Raman vertex simplifies to[11]
| (39) | |||
| (40) | |||
| (41) |
where and are the polarization vectors of the incoming and scattered light, , and is the energy of the Bloch electron. The correlation function of the effective density is now readily evaluated as
| (42) | |||
| (43) |
The above susceptibility consists of both intraband () and interband () contributions.
In the context of an band model it is implicitly assumed that out of the infinite bands of a Bloch system only bands (with typical bandwidth ) cross the Fermi level, while all the other bands are far above or below those bands of interest, separated by a gap of order . This is the largest energy scale of the problem, therefore when we consider Raman scattering in this model we must assume , although the energies of the incoming and scattered light may well exceed those of the optical transitions between bands close to the Fermi level (non resonant scattering). Under these assumptions only terms with indices and both labeling bands crossing the Fermi level will contribute to the Raman susceptibility in Eq.(30). The relevant Raman vertex will further simplify to
| (44) | |||
| (45) | |||
| (46) |
where the prime on the summation indicates that runs only over indices belonging to the faraway bands. Since and belong to bands close to the Fermi level, the light energies are negligible compared to the large band gaps in the denominators of Eq. (30). On the other hand when assumes values belonging to the ”close” bands, the band gaps are negligible compared to the light energies, and it is easily seen, that those terms yield contributions of the order of . Under usual experimental circumstances () these terms can be neglected in the Raman vertex.
Since we are interested in the low frequency response and interband transitions contribute to Im only above some finite threshold, in the following we restrict ourselves to intraband () transitions. The Raman susceptibility is now given by
| (47) |
where the Raman vertex is
| (48) |
real, and an even function of . The susceptibility is additive for those bands crossing the Fermi level, however the Raman vertex reduces to the familiar effective mass formula[11]
| (49) |
only for the case of a single band crossing the Fermi level. This is because in the effective mass formula[27] runs over all values except , while for more than one bands crossing the Fermi level there are some other terms also excluded from the sum for the Raman vertex in Eq.(33). The missing terms are in general of order unity due to the relatively small gaps between bands close to the Fermi level. In the Raman vertex however, these terms are negligible because of the large laser light energies (see Eq.(29)). Therefore in a multiband problem knowledge of the electronic energies is not sufficient for a precise evaluation of the Raman vertices . Using the effective mass formula in this situation renders the analysis qualitative at best.
Consider our system in the superconducting state. Assuming that superconductivity develops independently in the bands crossing the Fermi level, the intraband Raman response will again be additive, and the well known formula[10] is generalized as
| (50) |
where
| (51) |
is the Tsuneto function for the band involving the superconducting order parameter and quasiparticle energy of that band. Although it is not trivial, it can be shown that for the band model outlined above the Raman vertex derived for the normal state in Eq. (33) is an excellent approximation for the one to be used in the superconducting state[28].
The screening effect of the long range Coulomb interaction can be taken into account by including coupling of the effective density to the density () fluctuations[29]. In the long wavelength limit appropriate for Raman scattering the screened response is given by[1, 10]
| (52) |
with
| (53) |
and
| (54) |
Note that there is no interband contribution to and in the long wavelength limit appropriate for the present analysis. On the other hand, the second term in Eq. (37) mixes the bands (unless ), thereby making the screened response non additive. The screening effect of the long range Coulomb interaction can be made more transparent by rewriting Eq. (37) with the help of Eqs. (35), (38) and (39) as
| (55) |
where the average of the Raman vertex (which is screened out) involves all the relevant bands and depends on frequency as
| (56) |
The Raman response as given by Eqs. (40) and (41) has been thoroughly investigated for the case of only one band crossing the Fermi level[1]. It was shown, that for tetragonal symmetry and for a quasi two-dimensional electron system only the response is screened. Moreover, since the Tsuneto function picks up divergent contributions only for , and those contributions come from the neighborhood of points on the Fermi surface where the maximum value of is attained, the necessary condition for divergent Raman response is that the Raman vertex does not vanish at those points. For example, in case of a superconducting gap of symmetry, the response is divergent at translating into a robust peak at that frequency in experiments, while there is no divergence (anywhere) in the response. Therefore the frequency of any observed maximum in that spectrum is not related to the superconducting gap maximum. The unscreened response is also divergent at , but this divergence is removed by screening, since at takes exactly the same value as does at the critical points. This is because for the Tsuneto function assigns infinite weight in to exactly that value. Therefore again, any peak in the experimental spectrum is not directly related to the superconducting gap.
In a multiband situation the question might arise as to whether the above one band result holds for the removal of any divergences in the symmetry. Fueling doubts about it is the fact that in a one band model a momentum independent Raman vertex would completely be screened out leading to no response at all, while in the multiband case different but still momentum independent values will obviously lead to finite response according to Eq. (40). The existence of a divergence however is a more subtle problem. Any divergence can only come from one of the Tsuneto functions at one of the different frequencies . There is no reason to assume that the maximum gap is the same for any two bands if those bands are different. For a given only can give rise to divergence, the contribution of all the other bands in Eq. (40) is finite at that frequency. Similarly, will be determined solely by the divergent contributions from the band both in the numerator and denominator of Eq.(41). Therefore as far as the existence of divergences in the spectrum is concerned, the multiband problem reduces to the one band problem with the same result: any possible divergence at the various gap maxima in the Raman spectrum is removed by screening.
REFERENCES
- [1] T. P. Devereaux et al., Phys. Rev. Lett. 72, 396 (1994); Phys. Rev. B 51, 16336 (1995); Journ. of Supercond. 8, 421 (1995); Journ. of Phys. Chem. Solids 56, 1711 (1995).
- [2] D. Branch and J. P. Carbotte, Phys. Rev. B 52, 603 (1995); to appear in Phys. Rev. B.
- [3] X. K. Chen et al., Physica C 227, 113 (1994); ibid., 1089 (1995) [These calculations did not include Coulomb interactions].
- [4] M. C. Krantz and M. Cardona, Phys. Rev. Lett. 72, 3290 (1994); Journ. of Low Temp. Phys. 99, 205 (1995).
- [5] S. L. Cooper et al, Phys. Rev. B 37, 5920 (1988); R. Hackl et al., ibid 38, 7133 (1988); S. L. Cooper et al., ibid, 11934 (1988); T. Staufer et al., Phys. Rev. Lett. 68, 1069 (1992); A. Yamanaka et al., Phys. Rev. B 46, 516 (1992); R. Nemetschek et al., Phys. Rev. B 47, 3450 (1993); X. K. Chen et al., Phys. Rev. Lett. 73, 3290 (1994); ibid. Journ. of Supercond. 8, 495 (1995); A. Hoffmann et al., Physica C 235-240, 1897 (1994); C. Kendziora et al, Phys. Rev. B 52, 9867 (1995), and references therein.
- [6] F. Slakey et al., Phys. Rev. B 42, 2643 (1990).
- [7] X. K. Chen et al., Phys. Rev. B 48, 10530 (1993).
- [8] G. Contreras, A. K. Sood and M. Cardona, Phys. Rev. B 32, 924 (1985); I. P. Ipatova, A. V. Subashiev and V. A. Voitenko, Sol. State Commun. 37, 893 (1981).
- [9] Z. X. Shen et al., Physics Rep. 253, 1 (1995); Science 267 343 (1995); M. R. Norman et al., Phys. Rev. B 52 15107 (1995); H. Ding et al., Phys. Rev. Lett. 76, 1533 (1996).
- [10] M. V. Klein and S. B. Dierker, Phys. Rev. B 29, 4976 (1984); H. Monien and A. Zawadowski, Phys. Rev. B 41, 8798 (1990).
- [11] A. A. Abrikosov and V. M. Genkin, Zh. Eksp. Teor. Fiz. 40, 842 (1973) [Sov. Phys. JETP 38, 417 (1974)].
- [12] P. Allen, Phys. Rev. B 13, 1416 (1976).
- [13] In the effective mass approximation Eq. (11) yields and .
- [14] Q. Si et al., Phys. Rev. B 47, 9055 (1993).
- [15] O. K. Andersen et. al., Phys. Rev. B 49, 4145 (1993); Journ. of Phys. Chem. Solids 56, 1573 (1995).
- [16] R. J. Radtke et al., preprint; G. Blumberg et al., Phys. Rev. B 52, 15741 (1995).
- [17] T. P. Devereaux, Phys. Rev. Lett. 74, 4313 (1995).
- [18] The power-law behavior would not be changed if one of the gaps has the same magnitude as the other but completely isotropic -wave. However, then all channels would show a sharply defined peak at . This is in disagreement with experiment and appears to be unlikely.
- [19] A. I. Liechtenstein et al., LANL preprint 9509101; M. Langer et al., Phys. Rev. Lett. 75, 4508 (1995).
- [20] T. P. Devereaux and D. Einzel, erratum to be published.
- [21] T. P. Devereaux et al., Phys. Rev. B 51, 505 (1995), and references therein.
- [22] T. P. Devereaux, to be published in Int. Journ. of Mod. Phys. B.
- [23] L. S. Borkowski and P. J. Hirschfeld, Phys. Rev. B 49, 15404 (1994), and references therein.
- [24] C. Jiang and J. P. Carbotte, Sol. State Commun. 95, 643 (1995).
- [25] A. F. Goncharov et. al, AIP Conference Proceedings 309, 707 (1994); preprint.
- [26] R. Hackl, J. C. Irwin, C. Kendziora and M. V. Klein, private communication.
- [27] N. W. Ashcroft and N. D. Mermin, Solid State Physics (Saunders College, Philadelphia, 1976), p. 766.
- [28] A. Virosztek (unpublished).
- [29] L. P. Kadanoff and I. I. Falko, Phys. Rev. 136, 1170 (1964).
TABLE I
Summary of Raman response for various pair state candidates for clean, tetragonal superconductors.∗
| isotropic wave | 2 | 2 | 2 | ||||
| 2 | variable | ||||||
| 2 | |||||||
| 2 | variable | ||||||
| 2 | variable | ||||||
| wave† | |||||||
| 2 | 0.6 | variable | |||||
| extended wave†† | |||||||
| 2 | variable | ||||||
| experimental results | |||||||
| for optimal doping | 2 | ||||||
∗ Here phase is undetermined and thus would
yield the same as . Moreover, orthorhombic distortions
will mix and channels.
† Parameters chosen to split node at into two
modes at and a subsidiary
maximum equal to 20 percent of gap maxima.
†† Parameters chosen such that .
††† peak position depends sensitively on
harmonic representation of band structure, vertices, and energy gap (see
text for a discussion).