Parametric Generation of Second Sound by First Sound in Superfluid Helium
Abstract
We report the first experimental observation of parametric generation of second sound (SS) by first sound (FS) in superfluid helium in a narrow temperature range in the vicinity of . The temperature dependence of the threshold FS amplitude is found to be in a good quantitative agreement with the theory suggested long time ago [1] and corrected for a finite geometry. Strong amplitude fluctuations and two types of the SS spectra are observed above the bifurcation. The latter effect is quantitatively explained by the discreteness of the wave vector space and the strong temperature dependence of the SS dissipation length.
pacs:
67.40.Nj, 67.40.Pm, 43.25.+y, 67.90.+zParametric generation of waves is observed in a wide class of nonlinear media. Spin-waves in ferrites and antiferromagnets and Langmuir waves in plasma parametrically driven by a microwave field, ferrofluid surface waves subjected to an ac tangential magnetic field, and surface waves in liquid dielectrics parametrically excited by an ac electric field are just a few examples (see, e.g., [2, 3, 4]). Parametric excitation of standing surface waves by vertical vibration is another canonical example of such a system which recently has become particularly popular due to easy visualization of its pattern dynamics. Depending on the number of nonlinear modes, either nonlinear patterns or a wave turbulent state are observed. In the case of the Faraday instability, a rather modest experimentally reachable aspect ratio between the system’s horizontal size and the wavelength, and a relatively large dissipation, strongly limit advantages of this system to study the wave turbulence which is expected to exhibit some rather universal properties [3]. From this point of view, the spin-wave instability seems to present a better example of a system with many excited modes, thanks to its extremely large aspect ratio and minute dissipation. However, in spite of a well developed and detailed theory for this system, the few experimental detection techniques accessible in this case limit quantitative investigation of the wave turbulent state[3].
In this Letter, we report the first experimental observation of parametric generation of second sound (SS) waves by first sound (FS) waves in superfluid helium in a rather narrow temperature range close to the superfluid transition temperature . Due to relatively weak dissipation and a large attainable aspect ratio on the one hand, and experimental advantages of using high sensitivity amplitude measurements on the other hand, this system may become an appropriate one to quantitatively study the wave turbulence. However, we are aware of only one experiment on nonlinear (not parametric) interaction of first and second sounds [5].
In superfluid helium, there are two kinds of three-wave processes that are responsible for SS generation by FS waves: Čerenkov emission and parametric decay. These processes were considered theoretically about 20 years ago [1, 6]. In the first one, a FS phonon decays into a pair of FS and SS phonons. In the second process, a FS phonon decays into a pair of SS phonons. Both processes result in decay instabilities which are characterized by thresholds in the FS amplitude. In this paper, we concentrate on the parametric instability.
In the parametric excitation process, a FS wave with wave vector and frequency decays into two SS waves with wave vectors and and frequencies and that obey the conservation laws (resonance conditions)
| (1) |
, , and and are the first and second sound velocities. A FS wave of amplitude generates SS waves at the rate , where is the interaction matrix element [1]. The SS waves dissipate at the rate . The parametric instability occurs when the SS generation exceeds the dissipation. The threshold FS amplitude is [1].
It was found in Ref. [1] that in an infinite system, the temperature range where the parametric excitation occurs before the Čerenkov emission is between 0.9 K and 1.2 K. However, our estimates, based on the asymptotic behavior of the thermodynamic properties of superfluid helium near [7], show that the decay instability threshold is almost constant in a wide range of reduced temperature , where . The threshold of the Čerenkov emission in the same range is higher than that of the parametric instability and diverges at as . Thus this region is convenient to conduct experiments. In this temperature range, the matrix element reaches its maximum value for SS waves propagating perpendicularly to the FS wave. Moreover, since the attenuation length of the SS, , varies drastically in this temperature range [8], the finite length of the cell in the direction of the SS propagation should be taken into account.
The experiment was done on a short cylindrical cell of 50 mm in diameter and length mm (Fig 1). The sides of the cavity were formed by a pair of capacitor transducers. Such transducers and their calibration method are described in Ref.[9]. In the short direction, the cell was used as a FS resonator with the first harmonic frequency about 28 kHz . The frequency of parametrically excited SS waves was about 14 kHz. In the experimentally investigated temperature range, the SS wavelength varied from 0.09 to 0.3 mm. The resonator’s lateral side was open, and several layers of paper were put around it to absorb transverse acoustic modes. The resonator quality factor was : that allowed one to neglect influence of all other acoustic modes.
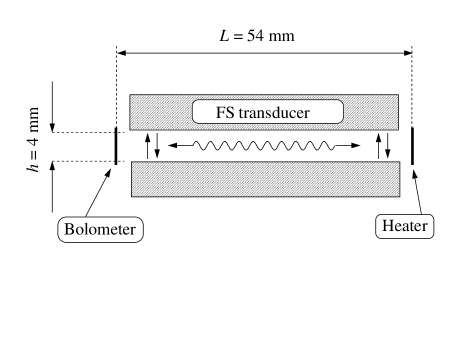
Two SS bolometers and two heaters were evaporated on 22 mm diameter glass substrates. One bolometer was placed diametrically opposite to each heater and the two pairs were mounted at to each other. The bolometers were 40 m wide superconducting Au-Pb line in the form of a round serpentine pattern of diameter mm [10]. Each heater–bolometer pair, with the mm base, formed a resonance open cavity for the SS, with resonances from 12 to 40 Hz apart. Possible incidental effects of these resonances on experimental observations are discussed below. The bolometers were sensitive to waves incident within the angle to the normal direction, i.e., from 0.05 to 0.15 for from to . The cell was placed into a container filled with about 300 ml of purified He4 and vacuum sealed. A three-stage temperature regulated cryostat with the helium container as the third stage was used [10, 11]. Its temperature stability was about K, and the operating temperature range was between 1.9 K and .
The experiment was performed at a constant temperature by generating FS at pump frequency , which was chosen to be the first harmonic frequency of the cavity. For a given FS amplitude, the SS amplitude was measured by the bolometers. In a typical experimental run, a signal from a bolometer was sent to a preamplifier and then to a lock-in-amplifier at reference frequency . The two-phase output signal was sampled at 16 Hz and digitized over a 128 s period. The complex Fourier transform of the both digitized components of the signal provided the SS spectrum in a narrow window, Hz, around , with resolution of Hz.
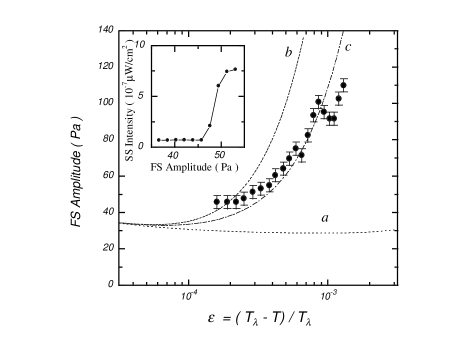
A typical plot of the time averaged SS intensity as a function of the driving FS amplitude in the vicinity of is shown on the inset of Fig. 2. There exists a well pronounced threshold for the driving amplitude at which the SS intensity first exceeds twice the background noise level. We point out that the SS amplitude as a function of time strongly fluctuates. Its intermittent behavior is particularly striking close to the onset where the time intervals between isolated spikes increases up to 1,000 seconds which was the maximum sampling interval. This time scale is much longer than all characteristic scales in the problem. Those fluctuations limit the resolution in the threshold determination and hinder quantitative studies of the amplitude behavior above the onset. Nevertheless, they do not change the main features of the phenomena discussed in the paper. The threshold FS amplitude as a function of temperature is shown in Fig. 2 together with theoretical predictions.
As mentioned above, heater–bolometer pairs, mm apart, formed boundaries for SS waves. In our experiments, the attenuation length changed from 10 to 600 mm. Therefore, reflections from the boundaries play an important role in the parametric instability. A straightforward generalization of the envelope method [12, 13] for a system of the size , where waves arrive and reflect normally to the boundaries, with an arbitrary reflection coefficient , yields the following expression for the threshold
| (2) |
where is the minimal positive root of the equation
| (3) |
For the value of (along with its temperature dependence) is mainly determined by the second term in the parenthesis in Eq. (2), i.e., (see curve () in Fig. 2). Note that if the reflection coefficient tends to unity, the threshold coincides with that in an infinite system.
To compare results of our threshold measurements with theoretical predictions we plotted theoretical curves for the cases of perfect reflection () - curve (a) in Fig. 2, and of the complete absorption () - curve (b) of SS on the boundaries. The SS dissipation rate, , was found from experimental measurements [8]. The curves converge in the region , where the size effect is negligible (). We also plot a curve (c) for the reflection coefficient . In the temperature range , this curve fits the experimental data rather well. Near the edges of the cell, SS waves are not amplified but they do attenuate. With approaching , the attenuation length, , becomes comparable to the characteristic length of the edge effects, . This results in a decrease of reflection from the cell boundaries. Therefore the effective reflection coefficient decreases and the experimental points lie closer to the theoretical curve (b) in the temperature range . Because of a steep decrease of the amplitude of the measured signal we did not succeed to extend our measurements closer to than .
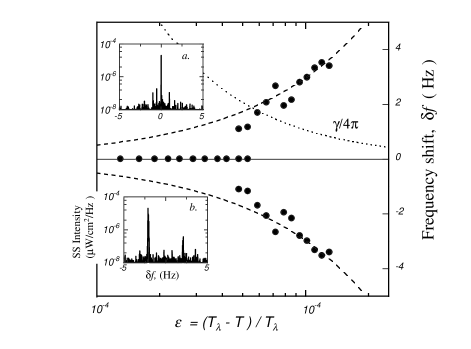
Another result, which was unexpected for us, was the observation of different types of SS power spectra in different temperature regions. Two typical spectra of the SS signals close to the onset at the reduced temperatures and are shown in the insets of Fig. 3. The first spectrum has a single sharp peak at exactly , while the second one, observed further from , exhibits two equidistant peaks around . The left peak at the lower frequency is always larger than the right one at the frequency .
In order to explain such a spectrum splitting one needs to consider the conservation laws (1). In the temperature range where our experiment was performed (), the sound velocity ratio varies between 0.06 and 0.019 [7]. From the conservation laws (1) one gets , i.e., the SS wave vectors are located on an ellipsoid of revolution with an eccentricity of , and and are almost opposite (Fig. 4a). A more detailed analysis of these equations reveals an angular dependence of the SS frequency
| (4) | |||
| (5) |
A weak angular dependence of the threshold amplitude due to an angular dependence of [1] yields a weak minimum for the symmetric configuration with .
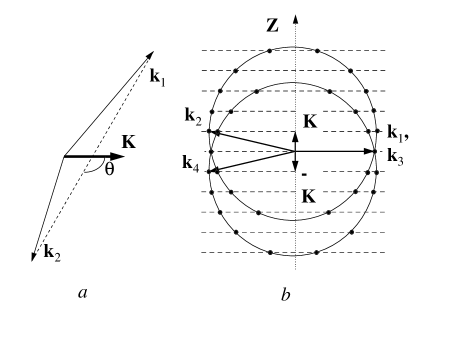
The existence of two types of spectra and the transition between them can be explained by the finite cell geometry in the direction of FS propagation and by discreteness of the wave vector in this direction (see Fig. 4b). Indeed, if the attenuation rate is larger than the frequency difference between resonance peaks, , that occurs closer to , the discreteness of the resonance states is smeared out. Then just a single peak appears in the spectrum. This symmetric case corresponds to the minimum of the threshold as a function of the angle for the infinite cell geometry[1]. The opposite inequality corresponds to discrete resonance states and leads to two peaks in the power spectra. If is sufficiently large compared to , one can consider two parametric excitation processes caused by two components of the FS standing wave, with the wave vectors . The momentum conservation conditions for these processes are
| (6) |
The processes do not interfere unless the same SS phonon participates in both processes. If that happens, e.g., , the two components of the standing wave contribute to the excitation process. Therefore, this process has a lower threshold. It follows from Eqs. (4–6) that in this case the common wave vector is exactly perpendicular to the FS wave vector , the waves with , having the lower frequency, , and . The splitting transition in the SS spectrum occurs when .
The experimental data on the frequency shift and the attenuation rate (dotted line) are plotted in Fig. 3. Closer to , the spectrum has just one peak at the frequency that corresponds to the symmetric decay of FS. Further away from ( ), the spectrum changes to two peaks equally separated from . The crossover from one type of the spectrum to another occurs in the reduced temperature interval where both the central peak and a pair of separated peaks coexist in the spectrum. The temperature dependence of the frequency shift of the peaks is described rather well by (dashed line). This corresponds to the decay process in which one of the SS waves propagates normally to the FS direction, and both components of the FS standing wave contribute to the parametric excitation.
The large difference between the peak amplitudes can be explained as a result of constructive interference of SS waves propagating exactly in the cell plane. The smaller peak at the higher frequency corresponds to two SS waves which propagate at a small angle to the FS waves and interfere destructively.
Two heater–bolometer pairs allowed us to examine the SS correlations on the bolometers. We found no significant correlations between the signals on the bolometers near the threshold. That indicates no tendency to pattern formation. The reason for such an essential difference from surface wave experiments is probably as follows: normal modes were not generated in our partially open cell that changed completely the pattern formation conditions compared to those in the Faraday crispation experiments [14].
In conclusion, a number of new features distinguish the SS parametric excitation in superfluid He from well studied parametric instabilities of spin-waves in magnets and of surface waves on liquid: (i) the instability was observed in a partially open system, (ii) the finiteness of the system lifts the degeneracy in pairs of parametrically excited SS waves that leads to the spectrum splitting in the temperature range , and (iii) the high sensitivity of the setup allowed us to observe strong fluctuations of the SS amplitude very close to the threshold.
We gratefully acknowledge useful and helpful conversations with V. L’vov and experimental advice by M. Rappaport and M. Reznikov.
This work was partially supported by a grant from the Minerva Foundation and by the Minerva Center for Nonlinear Physics of Complex Systems.
REFERENCES
- [1] I. M. Khalatnikov and V. L. Pokrovskii, Sov. Phys. JETP 44, 1036 (1976).
- [2] H. Suhl, J. Phys. Chem. Solids 1, (1957) 209.
- [3] V. L’vov, Wave Turbulence Under Parametric Excitation. (Applications to Magnetics) (Springer-Verlag, 1994).
- [4] M. C. Cross and P. C. Hohenberg, Rev. Mod. Phys. 65, 851 (1993).
- [5] S. L. Garrett, Technical Report No. 39, Department of Physics, UCLA, (1977).
- [6] N. I. Pushkina and R. V. Khokhlov, Sov. Phys. JETP Lett. 19, 348 (1974).
- [7] G. Ahlers, in The Physics of Liquid and Solid Helium: Part I, edited by K. H. Bennemann and J. B. Ketterson (John Wiley and Sons, Inc., N.Y. , New York, 1976).
- [8] R. Mehrotra and G. Ahlers, Physical Review B 30, 5116 (1984).
- [9] I. Rudnick and M. Barmatz, Phys.Rev. 170, 224 (1968).
- [10] H. Davidowitz, PhD thesis (The Feinberg Graduate School of the Weizmann institute of Science, 1992).
- [11] V. Steinberg and G. Ahlers, J. Low Temp. Phys. 53, 255 (1983).
- [12] V. S. L’vov and A. M. Rubenchik, Sov. Phys. JETP 45, 67 (1977).
- [13] V. B. Cherepanov and A. N. Slavin in High frequency processes in magnetic materials, edited by G. Srinivasan and A. N. Slavin (World Scientific, 1995).
- [14] S. Douady and S. Fauve, Europhys. Lett. 6, 221 (1988), A. B. Ezerskii, M. I. Rabinovich, V. P. Reutov, and I. M. Starobinets, Sov. Phys. JETP 64, 1228 (1986).
2