[
Magnetotransport with two occupied subbands in a Si(100) inversion layer
Abstract
We have studied an electron transport in inversion layers of high-mobility Si(100) samples. At high electron concentrations and temperatures below 4.2 K, two series of Shubnikov-de Haas oscillations have been observed. The temperature damping of the second series oscillations indicates that the second occupied subband belongs to the first energy level of the fourfold-degenerate ladder . Samples with two occupied subbans exhibit a strong anomalous negative magnetoresitance, reaching of a zero field value at 12 T. The resistance decrease is more pronounced for lower temperatures and higher electron concentrations. We explain this behaviour by an increase of the second subband mobility due to the freezing-out of the scattering of electrons. Based on the measured periods of SdH oscillations, we conclude that the electrons are distributed inhomogeneously beneath the sample gate.
73.40.-c
]
The -type inversion layer on a (100) surface of -type Si has been the subject of investigation for many years (for review see [2]). The silicon is an indirect gap semiconductor having six minima (valleys) in the conduction band along the (100) direction. In the case of (100)-oriented wafers, two of the valleys in the Brillouin zone are oriented perpendicular to the interface (with ), while the other four are parallel and have . A quantum well is formed at the interface by applying a positive voltage to the gate, and the electron motion in direction is quantized. The difference in causes a splitting of the energy spectrum into two independent ladders of levels: a twofold-degenerate ladder denoted , and a fourfold-degenerate ladder . Due to the higher effective mass in the direction, the lowest energy level in the potential well belongs to the -ladder.
Disagreement exists in the literature on the electron concentration at which the Fermi energy crosses the next energy level and on the question whether it forms the bottom of the second subband of the ‘unprimed’ ladder, or the first subband of the ‘primed’ ladder [3, 4]. More recently this problem was discussed in [5], based on the combination of measurements of the gate voltage dependence of the magnetoresistance and the Hall voltage. It was shown that the mobility of the second subband is higher than in the first subband (but relatively low), and that it linearly decreases with the temperature. This temperature dependence was tentatively explained by the temperature-dependent screening of the elastic scattering in the second subband. It was concluded from the experimental data that the second subband is the lowest subband of the fourfold-degenerate ladder, but the corresponding Shubnikov-de Haas (SdH) oscillations have never been observed explicitly. Here we report, to our knowledge for the first time, the magnetoresistance measurements on high-mobility Si(100) samples, showing clearly both series of Shubnikov-de Haas oscillations and supporting the idea that the second occupied subband belongs to the first energy level of the fourfold-degenerate ladder.
We employed in our experiments five Hall bar samples prepared from three different wafers. The wafers were made from -type silicon with resistivity at the room temperature, their crystallografic orientation was checked by X-ray diffraction and found (100) with an accuracy within . The edges of samples, defined by the gate geometry, were oriented along (110) direction. Results of measurements were very similar for all samples used. Therefore, we present data obtained for two of them, denoted as ‘sample 1’ and ‘sample 2’. The maximum mobility of electrons in 2D inversion layers was about 2.7 for the sample 1, and 2.0 for the sample 2 at the temperature 4.2 K. The dimensions of samples were , with the distance between potential leads , (sample 1) and , with the distance between leads (sample 2). The 0.2 thick gate insulator allowed to feed the electrons into an inversion layer with the maximum concentration . There is a linear dependence between and determined by the sample capacitance; the rate of filling, , was approximately for both samples. Shubnikov de Haas oscillations were investigated either as a function of , for a constant magnetic field , or as a function of , assuming fixed . We used a DC measuring method, the current through the sample was varied in the range 0.1-100, and the voltage between the potential leads was measured by a digital voltmeter. The samples, immersed in the liquid , were cooled down to 1.9 K in magnetic fields up to 12 T.
Figure 1 presents the selected measurements of magnetoresistance as a function of the gate voltage .
Firstly, the upper panel shows the ‘standard’ data obtained using the measuring current A; these results agree quite well with results of previous measurements [5]. The observed oscillations of magnetoresistance correspond to filling of Landau levels of the first subband and they are periodically dependent on for the electron concentration lower than . Due to the spin degeneracy, and the twofold valley degeneracy, there are electrons per unit area in each Landau level. The amplitude of oscillations drops down rapidly for higher electron concentrations, and their period decreases. To help resolve the oscillations, the inset presents the derivative of the magnetoresistance curve with respect to for higher region.

The lower panel shows the filling factor of electrons in the first subband, determined from the minima of the SdH oscillations shown above. For , the concentration follows the straight line, implying . For higher , a single period oscillations remain present, but the electron concentration in the first subband is lower, since a part of electrons is fed into the higher subband.
Secondly, a part of an ‘anomalous’ magnetoresistance curve is presented in the upper panel of figure 1. The measuring procedure was the same as described above, but the current through the sample, , was reduced one hundred times, to 0.1 A. In that case the second series oscillations became visible and the decrease of the magnetoresistance is observed. It is important to stress that the resistance measured at was identical for both measuring currents, i.e. the same curves were obtained for 10 A and 0.1 A. Therefore, it is not possible to explain the drop of magnetoresistance simply as due to the reduced heating of 2D electron gas. If it would be the case, the reduced electron temperature should imply e.g an increase of amplitude of SdH oscillations of the first subband electrons. Instead of it, the decrease of amplitudes was observed, as if a part of a current, originally carried by the first subband electrons, was taken over by the second subband electrons with higher mobility. This indicates that only the electrons from the second subband are influenced by the the current magnitude.
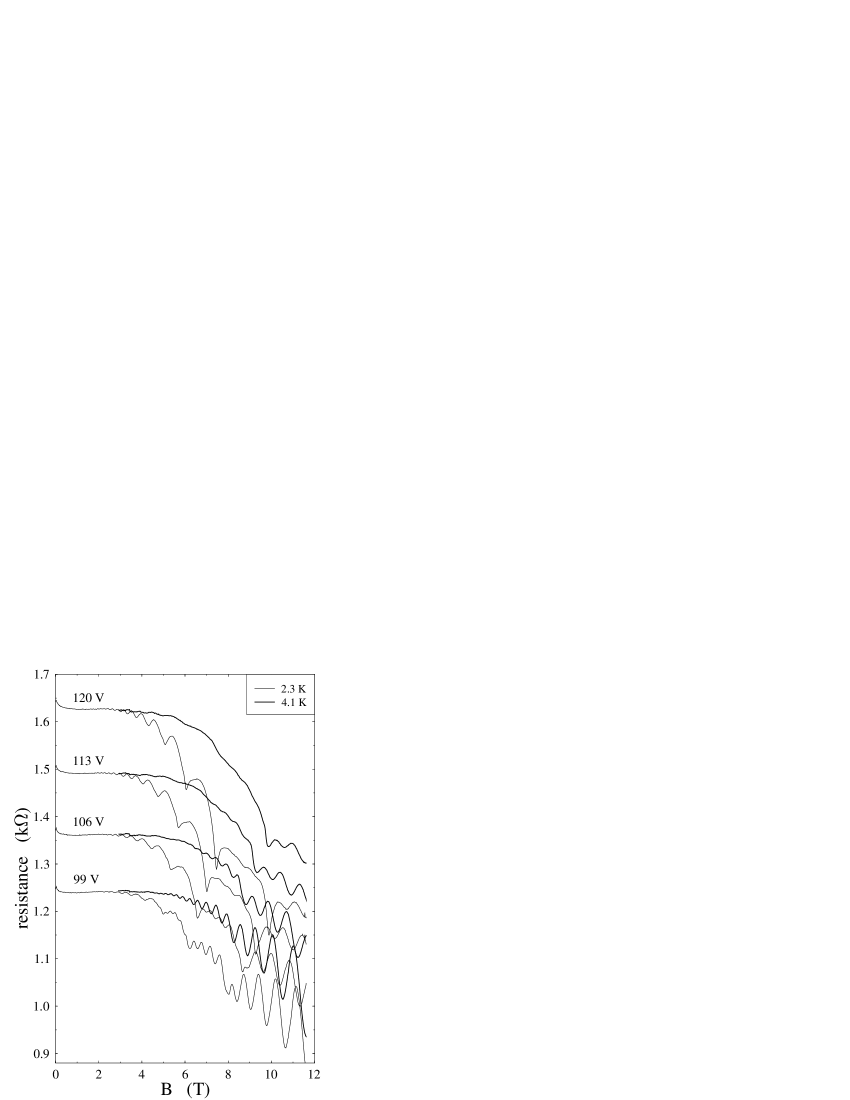
These unusual results motivated us to more laborious investigation of the field dependence of magnetoresistance with the fixed gate voltage and the variable magnetic field. In that case the coexistence of two series of oscillations can be studied, together with the development of the negative magnetoresistance. Examples of such curves, obtained for four gate voltages at two different temperatures, and employing a relatively high current , are presented in figure 2. In the lowest magnetic fields, the negative magnetoresistance, attributed to the localization, is observed for all four , followed by a slight increase, which lasts till T. In this low field region, the magnetoresistance practically does not depend on the sample temperature. For higher fields, the SdH oscillations appear, corresponding to both subbands, and their emergence is accompanied by onset of a strong negative magnetoresistance. The field dependence of smooth parts of curves is very sensitive to the temperature, for lower temperatures a more pronounced resistance decrease occurs, similarly as in the case of reduced current density, as presented in figure 1.
The magnetoresistance curves, measured as a function of at various temperatures, allow us to derive important characteristics of the second subband. Firstly, we have determine the cyclotron effective mass from the temperature damping of the oscillations amplitudes, and found , in good agreement with a theoretical value, . This implies that the first subband of the ladder is occupied, in agreement with conclusions of references [3] and [5].
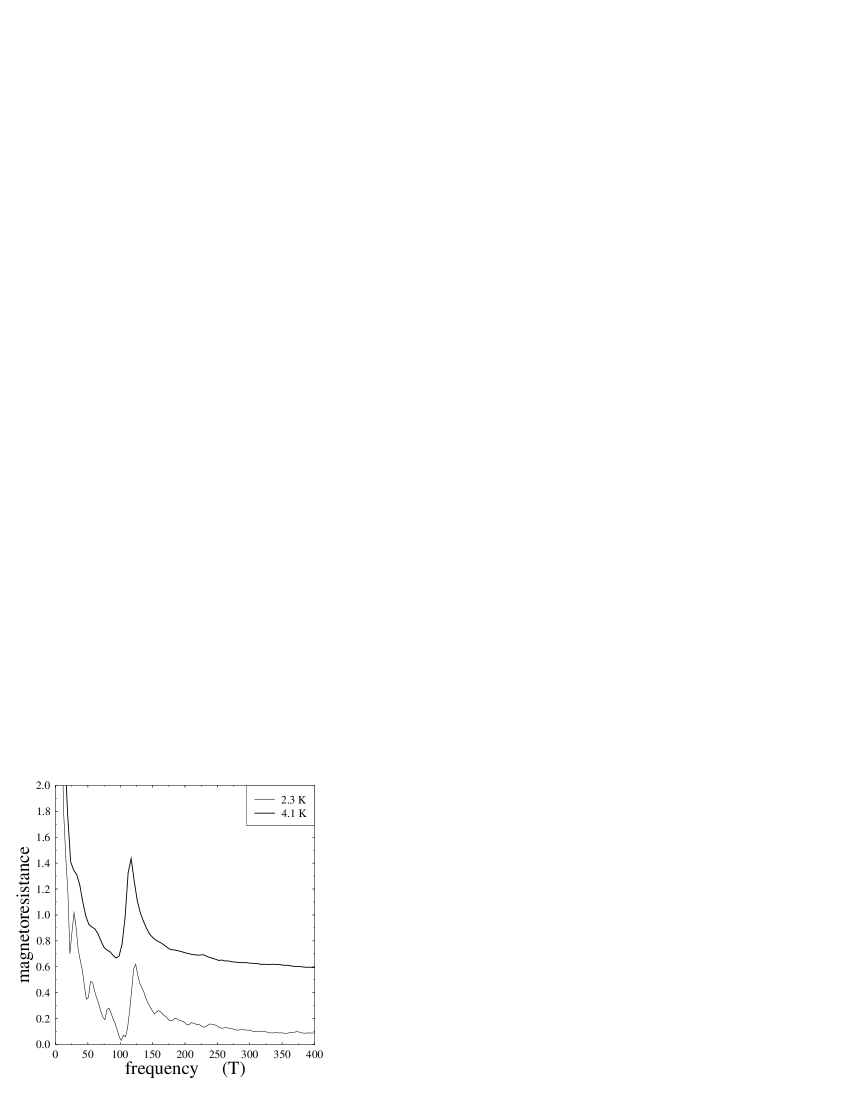
Both series of oscillations are periodical functions of the inverse magnetic field and their frequencies are linear functions of concentrations of carriers in the individual subbands. Examples of Fourier transforms of two curves, measured at 99 V and presented in figure 2, are shown in figure 3. The lines are offset for clarity. Peaks corresponding to two different frequencies are clearly seen. The first subband oscillations are almost sinusoidal and, therefore, described by a single peak which has somewhat lower amplitude for the curve measured at lower temperature. The second subband oscillations contains a large number of higher harmonics and the corresponding peaks are more visible at lower temperature curve. This can be understood having in mind a semi-elliptic form of oscillations. The smooth background is due to the smooth part of the negative magnetoresistance which was not removed before transforming the data.
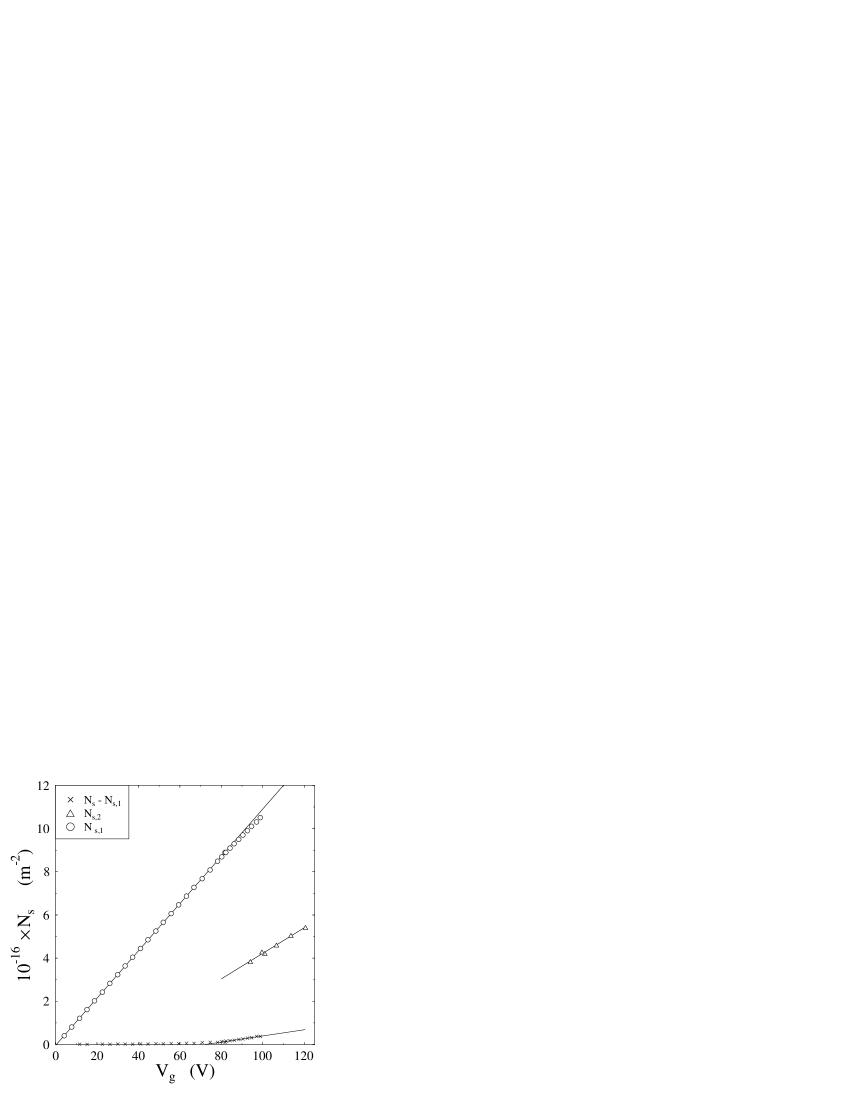
Both and determined from the periods of SdH oscillations are shown in figure 4. There are only a few points of dependence and, therefore, the linear extrapolation to lover gate voltage has only a limited meaning. Nevertheless, it indicates a lower threshold of occupation of the second subband than reported previously. The results also show that the ratio of two periods of oscillations is approximately 4.5 for all four investigated gate voltages, which means 2.25, if the fourfold degeneracy of the second subband is assumed. Traditionally, [3, 4, 5], the concentration of electrons in the second subband, , is deduced from the decrease of the period of the first subband oscillations at higher gate voltages, such as shown in figure 1. If the homogeneous distribution of electrons beneath the sample gate is assumed, is given by the difference . Our direct determination of and from the oscillation periods does not confirm results of this approach in the case of .
More series of SdH oscillations were already reported for inversion layers on surfaces slightly tilted from (100) [6] and for layers on (100) surfaces subject to either uniaxial [7] or biaxial stress [8]. In the first case, only the first subband electrons are involved and the reason for additional periods is lifting of the twofold valley degeneracy caused by the tilting and the inter-valley interaction. In the latter case, the crystal symmetry is lowered due to the stress and, consequently, the energy of levels shifted below the Fermi energy level.
We do not think that our second series oscillations can be satisfactory explained by the above mentioned mechanisms. The surface orientation is (100) with high accuracy and the only sources of stress are the different thermal expansion coefficients of Si, and the gate material. On the other hand, we would like to turn attention to another possibility, not mentioned previously, why the bottom of the first subband of the ladder can be shifted below the Fermi energy only in a part of the sample area: the inhomogeneity of distribution of electrons beneath the sample gate.
In our samples, the area occupied by a two-dimensional electron gas is defined by the gate geometry rather then by fixed ionized donors, as it is the case in modulation doped heterostructures. The concentration of electrons is related to by where is a dielectric constant of the oxide and is its thickness. The charged gate and the 2D electron system act as a parallel plate capacitor; the plates containing the free charge keep the constant potentials through their areas, rather then the constant concentration of carriers. Therefore, the free charge density can fluctuate inside the sample, e.g. due to the surface roughness and/or an inhomogeneous distribution of charged impurities in the depletion layer. Moreover, the free charge should accumulate near the plate edges, to compensate the Coulomb repulsion of carriers from the sample interior. The electrostatic corrections to the finite dimension of a capacitor [9] predict that the extra charge is localized in narrow strips near the edges, with the width proportional to , and that the excess concentration, , diverges when , the distance measured from the edge, approaches zero. In real life the concentration will stay finite, nevertheless we can assume that it first rises near an edge, before it vanishes. Thus, we consider that the narrow channels near the edges concentrate a part of electrons from the second subband and contribute substantially to the sample conductivity.
The high sensitivity of the observed results to the measuring current density and to the temperature suggests that the electron-electron interaction can be involved. Firstly, the temperature-dependent screening of the second subband electron scattering can play a role, as described in [5]. Secondly, the properties of the second subband electrons should be strongly influenced by quantization into the Landau levels for . Note that the onset of the negative-dependent magnetoresistance occurs just when the above condition is satisfied.
The Landau levels of a single subband never cross and their shape more or less copies a shape of a smooth confining potential and exhibits a characteristic step-like structure near abrupt potential steps. The Landau levels of electrons from two different subbands, 0 and 0’, can cross, as they will see the shape of a sample potential in a different way. Firstly, due to a large difference between the number of Landau levels near the Fermi energy and, secondly, due to the difference in the effective masses. The points of crossing can represent the ‘hot’ points of an intensive intersubband scattering which can substantially contribute to the observed effects and can be suppressed at low temperatures and high magnetic fields.
The increase of the mobility of the second subband electrons causes the redistribution of the current density and more current is conducted by them. As a consequence, the amplitudes of second series oscillations growth to detriment of amplitudes of the first series oscillations. The extension of present measurements down to the milikelvin temperatures region, which is now in progress, can probably shed more light to the nature of this new interesting effects.
We thank to V. Borzenets, L. Skrbek and J. Šebek for stimulating discussions and their help with cryogenic measurements. We are also grateful to Z. Výborný for his help with sample preparation. This work was in part supported by International Science Foundation through the Grant RHD 000, by the Grant Agency of the Czech Republic under Grant No 202/93/0027 and by the Academy of Science of the Czech Republic under Contract No. 110 423.
REFERENCES
-
[1]
Permanent address: Institute for Metrological
Service,
2 Andreevskaya nab. 117 334, Moscow, Russia - [2] T. Ando, A. B. Fowler, and F. Stern, Rev. of Mod. Physics 54, 437 (1982).
- [3] D. C. Tsui and G. Kaminsky, Phys. Rev. Lett. 35, 1468 (1975).
- [4] W. E. Howard and F. F. Fang, Phys. Rev. B 13, 2519 (1976).
- [5] G. H. Kruithof and T. M. Klapwijk, Phys. Rev. B 42, 11 412 (1990).
- [6] T. G. Matheson and R. J. Higgins, Phys. Rev. B 25, 2 633 (1982).
- [7] G. Abstreiter, P. Stallhofer, and J. P. Kotthaus, Surface Sci. 98, 413 (1980).
- [8] F. F. Fang, Surface Sci. 98, 416 (1980).
- [9] J. C. Maxwell, in A Treatise on Electricity and Magnetism, (MacMillan and Co., London, 1873) p. 246.