Ab initio study on the effects of transition metal doping of Mg2NiH4
Abstract
is a promising hydrogen storage material with fast (de)hydrogenation kinetics. Its hydrogen desorption enthalpy, however, is too large for practical applications. In this paper we study the effects of transition metal doping by first-principles density functional theory calculations. We show that the hydrogen desorption enthalpy can be reduced by eV/H2 if one in eight Ni atoms is replaced by Cu or Fe. Replacing Ni by Co atoms, however, increases the hydrogen desorption enthalpy. We study the thermodynamic stability of the dopants in the hydrogenated and dehydrogenated phases. Doping with Co or Cu leads to marginally stable compounds, whereas doping with Fe leads to an unstable compound. The optical response of is also substantially affected by doping. The optical gap in is eV. Doping with Co, Fe or Cu leads to impurity bands that reduce the optical gap by up to 0.5 eV.
pacs:
71.20.-b,71.15.Nc,61.72.Bb,74.62.DhI Introduction
The large scale application of hydrogen as a fuel depends on the development of materials that can store hydrogen in a dense form.Zuttel (2004) Magnesium based hydrides are interesting candidate materials for hydrogen storage, because magnesium has a low weight. The simplest hydride, MgH2, has a hydrogen storage capacity of 7.67 wt.%. It has, however, a high hydrogen desorption enthalpy, 0.77 eV per H2, and hence an equilibrium plateau pressure ( bar) at room temperature that is too low for practical applications.Stampfer et al. (1960) Moreover, the hydrogen desorption/absorption reactions of MgH2/Mg suffer from kinetic barriers, which requires operating temperatures in excess of 570 K. Various magnesium alloys have been studied to improve the thermodynamics and kinetics of the hydrogen desorption/absorption reaction.Bogdanovic and Spliethoff (1987); Bortz et al. (1998); Liang et al. (1999); Bouaricha et al. (2000); Liang et al. (2000); Leng et al. (2004) , which can store 3.6 wt.% of hydrogen, has been suggested as a candidate material, primarily because of its reasonably fast hydrogen desorpion/absorption kinetics.Reilly and Wiswall (1968); Yvon et al. (1981); Noreus and Werner (1981); Soubeyroux et al. (1984); Zolliker et al. (1986a); Post and Murray (1987); Zeng et al. (1999) Several theoretical studies have been dedicated to .Liao and Zhang (1997); Garcia et al. (1999, 2002); Haussermann et al. (2002); Myers et al. (2002) However, its measured hydrogen desorption enthalpy of 0.70 eV per H2,Post and Murray (1987) is barely lower than that of MgH2. It leads to an equilibrium hydrogen pressure of 1 bar at 510 K.Zeng et al. (1999) This temperature is far too high for applications using PEM fuel cells, for instance. Apart from its possible role in hydrogen storage, Mg2Ni is also interesting because it can act switchable mirror.Richardson et al. (2001); Lohstroh et al. (2004a, b); Isidorsson et al. (2002) is a metal, whereas is a semiconductor with a band gap of 1.7-2.0 eV.Lupu et al. (1993); Selvam et al. (1988); Lupu et al. (1987) This leads to a remarkable change in the optical properties of the material upon hydrogenation and dehydrogenation. Especially if is applied in thin films, the optical switching can be fast, reversible and robust.Lohstroh et al. (2007) The high optical contrast opens up possibilities for as a hydrogen sensing material.Vece et al. (2005); Westerwaal et al. (2006); Pasturel et al. (2006)
For both applications the reaction enthalpy of the hydrogen desorption/absorption at typical operating conditions is too high. Preferable would be an equilibrium hydrogen pressure of 1 bar at room temperature. To reach this condition a hydrogen desorption enthalpy of 0.40 eV per H2 is required. A substantial amount of experimental work has been dedicated to study the effects of doping of in order to reduce its hydrogen desorption enthalpy.Darnaudery et al. (1983); Lei et al. (1994); Sun et al. (1995); Ikeda et al. (1998); Liang et al. (1998); Bobet et al. (2000, 2002); Sato et al. (2003); Li et al. (2004); Simicic et al. (2006); Lohstroh et al. (2007) In this context “doping” means substituting a fairly large amount of Ni (or Mg) by other metals.
In this paper we report a study on the effects of doping with transition metals by first principles density functional theory (DFT) calculations. We restrict ourselves to the LT phase of , since the HT phase is stable only at elevated temperatures (i.e. K) and therefore less relevant for applications.Post and Murray (1987) We consider substitution of nickel by cobalt, iron, or copper in a concentration of 12.5%, which means substituting one in eight nickel atoms. This concentration is close to that used in recent experiments.loh Our first aim is to monitor the change in hydrogen desorption enthalpy and, in particular, to establish which dopants (if any) lead to a reduction of the enthalpy. We show that zero point energies (ZPEs) associated with the hydrogen phonon modes considerably influence the enthalpies. Our second objective is to study the change in optical properties that results from doping. In particular we show that dopants in this concentration markedly alter the dielectric function.
II Computational methods
First principles DFT calculations are carried out using a plane wave basis set and the projector augmented wave (PAW) method,Kresse and Joubert (1999); Blöchl (1994) as incorporated in the Vienna Ab initio Simulation Package (VASP),Kresse and Furthmüller (1996a, b); Kresse and Hafner (1993). We use the PW91 generalized gradient approximation (GGA) for the exchange correlation functional.Perdew et al. (1992) The cell parameters are kept at the experimental values and the atomic positions are relaxed using a conjugate gradient algorithm. Non-linear core corrections are applied.Louie et al. (1982)
To calculate accurate reaction enthalpies for reactions involving light elements such as hydrogen, it is essential to take into account the ZPE contribution. To calculate ZPEs we need the phonon frequencies of the materials involved. Phonon frequencies are calculated using a direct method,Kresse et al. (1995) i.e. the dynamical matrix is constructed from the force constants that are obtained from finite differences. Two opposite displacements of 0.05 Å are used for each atomic degree of freedom. In general one needs to carry out such calculations on a super cell containing several primitive unit cells, as the force constants do not go to zero within a distance corresponding to a single unit cell. However, the unit cells of the materials studied in this paper turn out to be sufficiently large, except for bulk magnesium, for which a super cell is used. An advantage of large unit cells is that the phonon dispersion is small. It is therefore sufficient to calculate ZPEs from the phonon frequencies obtained at .
The dielectric functions are calculated in the or independent particle random phase approximation taking into account direct transitions from occupied to unoccupied Kohn-Sham orbitals only. We neglect excitonic, local field and quasi-particle effects. The imaginary part of the macroscopic dielectric function then has the form
where gives the direction of ; and label single particle states that are occupied, unoccupied in the ground state, respectively; , are the single particle energies and the translationally invariant parts of the wave functions, respectively; is the volume of the unit cell. Further details can be found in Ref. Gajdos et al., 2006.
Almost all experimental optical data on hydrides are obtained from micro- or nano-crystalline samples whose crystallites have a significant spread in orientation. The most relevant quantity then is the directionally averaged dielectric function, i.e., averaged over . In this paper we only report directionally averaged dielectric functions.
The Brillouin zone integrations are performed using a modified tetrahedron method.Blöchl et al. (1994) All calculations on the hydrides use a Monkhorst-Pack -point mesh for sampling the Brillouin zone, and the calculations on the metals use a Monkhorst-Pack -point mesh.Monkhorst and Pack (1976) We use bands to calculate the dielectric function. This number of bands includes all transitions up to eV. For the materials containing copper a plane wave kinetic energy cutoff of eV is used, and for the other materials a cutoff of eV. To obtain accurate formation and reaction enthalpies, the total energies of all final structures are calculated using a plane wave kinetic energy cutoff of eV.
III structure and stability of undoped materials: , , , and elemental metals
In order to assess the stability of doped we first need the total energies of the undoped hydrides and of all elemental metals involved. The optimized structures of , , are given in Table 1. They are in good agreement with the experimental structures.Zolliker et al. (1986b); Zolliker et al. (1985); Didisheim et al. (1984) The metal atoms in LT form a distorted CaF2-type structure. Four hydrogen atoms are arranged around each nickel atom in a tetrahedron. In and the Mg and Fe/Co atoms form an undistorted CaF2-type structure. In the hydrogen atoms form regular octaeders around the iron atoms. In the hydrogen atoms occupy five corners of a slightly distorted octahedron around each cobalt atom.
The experimental structure of can be found in Ref. Soubeyroux et al., 1984. The unit cell contains 12 Mg and 6 Ni atoms, which are basically hexagonally closed packed. The optimized structure given in Table 1 is in good agreement with experiment. For we use a previously calculated structure.van Setten et al. (2005) For the elemental metals and we use the experimental lattice parameters, i.e., Å, Å, Å, Å Å and Å for Mg, Fe, Co, Ni, Cu and , respectively.Weast and Astle (1982) The magnetic elements iron, cobalt and nickel are treated by spin-polarized calculations. The calculated pressures are small, indicating that it is unnecessary to explicitly optimize the lattice parameters. We explicitly tested the latter for iron, since there the external pressure was largest, and obtained an energy gain of less than 0.01 eV.
| Space group | ||||||
| Compound | unit cell | x | y | z | ||
| C2/c (15) | Mg | 0.2646 | 0.4863 | 0.0833 | ||
| = 113.52∘ | Mg | 0 | 0.0252 | 0.2500 | ||
| a = 14.343 Å | Mg | 0 | 0.5264 | 0.2500 | ||
| b = 6.4038 Å | Ni | 0.1199 | 0.2294 | 0.0801 | ||
| c = 6.4830 Å | H | 0.2088 | 0.3048 | 0.3041 | ||
| H | 0.1390 | 0.3192 | 0.8760 | |||
| H | 0.0096 | 0.2908 | 0.0527 | |||
| H | 0.1243 | 0.9866 | 0.0727 | |||
| P4/nmm (129) | Mg | 3/4 | 1/4 | 0 | ||
| a = 4.463 Å | Mg | 3/4 | 1/4 | 1/2 | ||
| c = 6.593 Å | Co | 1/4 | 1/4 | 0.2567 | ||
| H | 1/4 | 1/4 | 0.4947 | |||
| H | 0.4914 | 0.4914 | 0.2268 | |||
| Fm3m (225) | Mg | 1/4 | 1/4 | 1/4 | ||
| a = 6.437 Å | Fe | 0 | 0 | 0 | ||
| H | 0.2425 | 0 | 0 | |||
| P6222 (180) | Mg | 0.1639 | 0.3278 | 0 | ||
| = | Mg | 1/2 | 0 | 0.1165 | ||
| a = 5.205 Å | Ni | 0 | 0 | 1/2 | ||
| c = 13.236 Å | Ni | 1/2 | 0 | 1/2 |
In order to obtain accurate enthalpies for reactions involving materials that contain hydrogen, one has to take ZPEs into account. All calculated total energies and ZPEs are given in Table 2. We neglect the ZPEs of the elemental metals. The ZPE for magnesium is only 0.001 eV/atom. The ZPEs iron, cobalt, nickel and copper will be even smaller, since the atomic weight of those elements is more than twice that of Mg. We did not calculate the ZPEs for and , since we use these compounds only to study the stability of doped with respect to phase segregation, where the ZPE corrections are rather small.
To calculate hydrogen desorption enthalpies we also need the total energy of the hydrogen molecule. It is calculated using a cubic cell with sides of 13 Å. We find an equilibrium distance of 0.7486 Å, a vibrational frequency of 4350 cm-1 and a dissociation energy of 4.57 eV, which compare reasonably well with the experimental values of 0.7461 Å, 4401 cm-1 and 4.48 eV, respectively.Weast and Astle (1982); Huber and Herzberg (1979) The 0.1 eV deviation in the dissociation energy of H2 is relatively large in view of the accuracy required for calculating hydrogen desorption enthalpies. This 0.1 eV may be considered as a correction to the reaction enthalpies discussed below.
We calculate the ZPE for the hydrogen molecule from the energy levels of a Morse potential,
| (2) |
where is the vibration frequency and is the dissociation energy. The result is given in Table 2.
| E (eV) | ZPE (eV) | E (eV) | ZPE (eV) | ||
|---|---|---|---|---|---|
| H2 | 6.803 | 0.266 | 8.983 | ||
| Mg | 1.524 | 0.001 | 9.133 | 0.102 | |
| Fe | 8.150 | 34.511 | |||
| Co | 6.841 | 29.355 | |||
| Ni | 5.459 | 24.053 | 0.852 | ||
| Cu | 3.725 | 9.45 |
IV Doped and
IV.1 Structure
The unit cell of the LT phase of contains eight formula units. To simulate doping we replace one of the Ni atoms by a Fe, Co, or Cu atom, thus achieving a 7:1 ratio between Ni and dopant atoms. In simple terms one can think of undoped as being constructed from Mg2+ and (NiH4)4- ions. The latter involve 18 valence electrons and are closed shell ions. Upon doping it is likely that in the fully hydrogenated phase the closed shell character is maintained. This means that (NiH4)4- is replaced by (FeH6)4-, (CoH5)4-, or (CuH3)4-. Thus for a Fe atom we add two extra hydrogen atoms, for a Co atom one and for a Cu atom we remove one hydrogen atom. For all doped systems we fix the unit cell to that of undoped and we optimize the atomic positions. The external pressures on the doped systems are small, which indicates that the gain in energy when relaxing the cell volumes will not be significant.
The geometry of the hydrogens around the Fe and Co dopant atoms resembles the geometry in and respectively. In each Fe atom is in the center of a perfect octahedron of hydrogen atoms with a Fe–H distance of 1.56 Å. In Fe doped the octahedron is distorted. The H–Fe–H angles range from 80 to 100∘ and the Fe–H distances range from 1.55 to 1.58 Å in case a H atom is only bonded to a Fe atom. However, four of the hydrogen atoms surrounding a Fe atom also bond to Ni atoms, in which case the Fe–H distance is enlarged to 1.64–1.76 Å. The hydrogen tetrahedra around such Ni atoms are distorted with Ni–H distances from 1.51 to 1.80 Å, whereas in undoped they are between 1.56 and 1.58 Å.
In the case of Co doping the distortions are much smaller. In the hydrogen atoms surrounding each Co atom form a four-sided pyramid with the Co atom just above the basal plane of the pyramid. To describe the geometry we denoting the basal plane hydrogens by Hb and the top hydrogen by Ht. The Hb–Co–Hb angle is 89∘, the Co–Hb distance is 1.52 Å, the Hb–Co–Ht angle is 97.6∘ and the Co–Ht distance is 1.59 Å. The Co-Mg distances range from 2.75 to 2.80 Å. The hydrogens surrounding the Co atom in doped form a slightly distorted pyramid, with Hb–Co–Hb angles ranging from 83.1∘ to 94.1∘ and Co–Hb distances ranging from 1.53 to 1.56Å. The Hb–Co–Ht angle is 93.4∘ to 105.1∘ and the Co–Ht distance is 1.57Å. The Co–Mg distances vary from 2.69 to 2.80 Å. The Ni–H bond lengths are not affected by Co doping.
We cannot compare the geometry of the hydrogens in Cu doped to Mg2CuH3, since the latter compound is not stable with respect to decomposition into and .Darnaudery et al. (1983) The Ni–H distances in Cu doped are similar to those in undoped . The hydrogen atoms surrounding the Cu atom are located at three corners of a tetrahedron with the Cu atom in the center. The Cu–H distances, 1.62 to 1.64 Å, are slightly larger then the Ni–H distances, 1.56 to 1.59 Å.
IV.2 Reaction enthalpies
In order to calculate the hydrogen desorption enthalpy of doped we also need the total energy of doped . The unit cell of contains six formula units per cell. If we replace one of the Ni atoms in this cell by a dopant atom, this gives a 5:1 Ni:dopant ratio, instead of the required 7:1 ratio. We approximate the total energy of the 7:1 ratio by the average energy of three 5:1 doped unit cells and one undoped cell. All calculated total energies and ZPEs of the doped hydrides and metals are given in Table 3.
From the data in Table 3 we calculate the desorption enthalpy per H2 molecule
| (3) | |||||
where (M) is the total energy of compound M and is the number of hydrogen atoms in the hydride. The latter depends upon the dopant atom, as discussed in the previous section. The values of are given in Table 3.
| TM | E (eV) | ZPE (eV) | (#H) |
|---|---|---|---|
| Fe | 24.952 | 0.914 | 4.250 |
| Co | 24.677 | 0.876 | 4.125 |
| Ni | 24.053 | 0.852 | 4.000 |
| Cu | 23.207 | 0.826 | 3.875 |
| Fe | 9.278 | 0.100 | |
| Co | 9.233 | 0.100 | |
| Ni | 9.133 | 0.102 | |
| Cu | 8.890 | 0.102 |
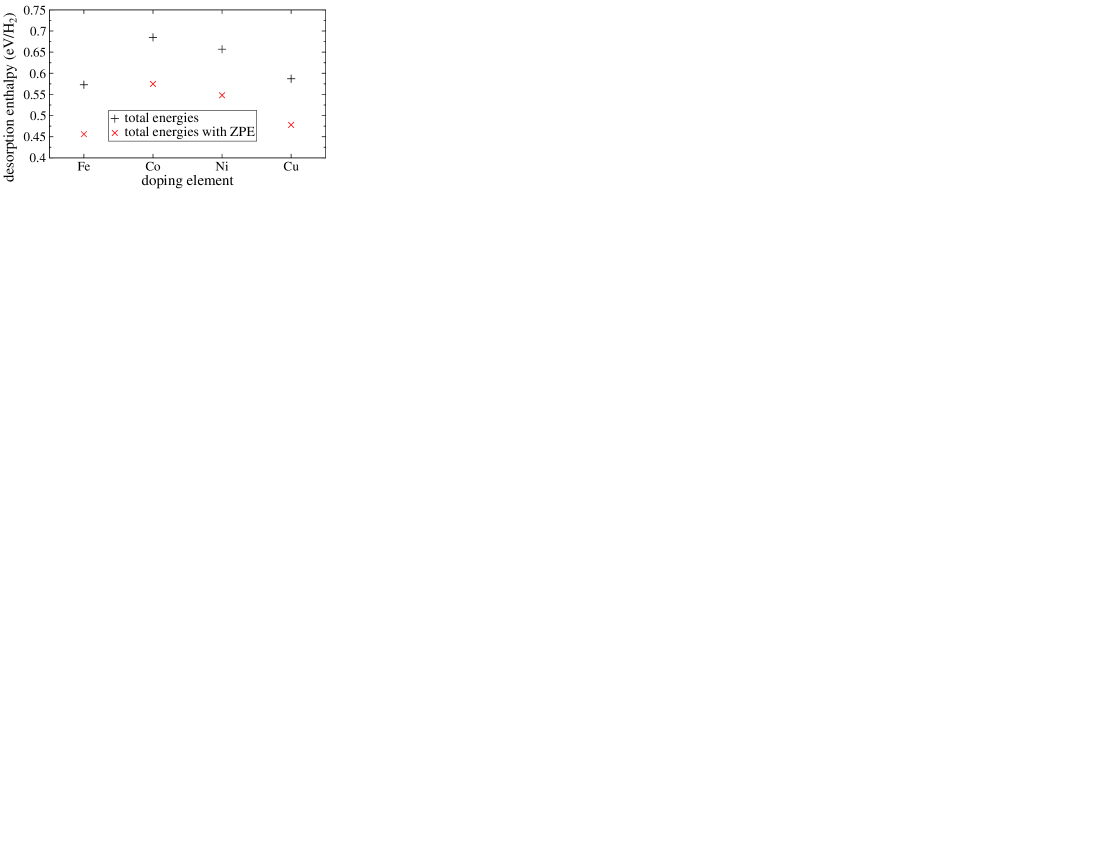
The calculated desorption enthalpy of undoped is 0.66 eV/H2 without ZPE and 0.55 eV/H2 with ZPE. The corresponding experimental value is 0.70 eV/H2.Post and Murray (1987) The agreement is fair, if we correct for the overestimation of the H2 dissociation energy, mentioned in Sec. III. Since the H2 dissociation energy is overestimated by 0.1 eV, it is reasonable to assume that the desorption enthalpy is overestimated by the same amount. This gives an desorption enthalpy with ZPE of 0.65 eV per H2, which is close to the experimental value. The correction is a constant shift and in the following we give the uncorrected results only.
The results for of doped are given in Fig. 1. These results clearly demonstrate that the desorption enthalpy can be tuned by an appropriate doping. The desorption enthalpy decreases considerably both for Fe and for Cu doping, i.e. by 84 and 71 meV per H2, respectively. However, Co doping increases the desorption enthalpy by 28 meV per H2. The trends for Cu and Fe doping are in qualitative agreement with experimental data.Darnaudery et al. (1983); Bobet et al. (2002); Simicic et al. (2006)
Fig. 1 also shows the calculated desorption enthalpies corrected with ZPEs. The ZPEs of all the metals are almost identical, see Table 3, and the ZPEs of the hydrides scale linearly with amount of hydrogen atoms. This means that the ZPE per hydrogen atom is almost constant and independent of the dopant atom. Therefore, the ZPE correction to the desorption enthalpy per H2 is 0.1 eV for all compounds studied.
IV.3 Stability
Doped is stable in thin films.loh In order to assess whether kinetics plays an important role in stabilizing these compounds, we study the thermodynamic stability of the doped materials with respect to phase segregation. For the dehydrogenated doped metal we consider decomposition into , bulk magnesium and bulk doping metal.
| (4) |
where TM Fe, Co, or Cu. Fully hydrogenated undoped is compared to bulk nickel and . For the hydrogenated doped we consider decomposition into phase segregated and or .
| (5) |
with as in Table 3, and for Co, Fe, respectively. Since Mg2CuH3 is unstable with respect to decomposition into and , we consider for the hydrogenated Cu doped the possible decomposition reaction
| (6) |
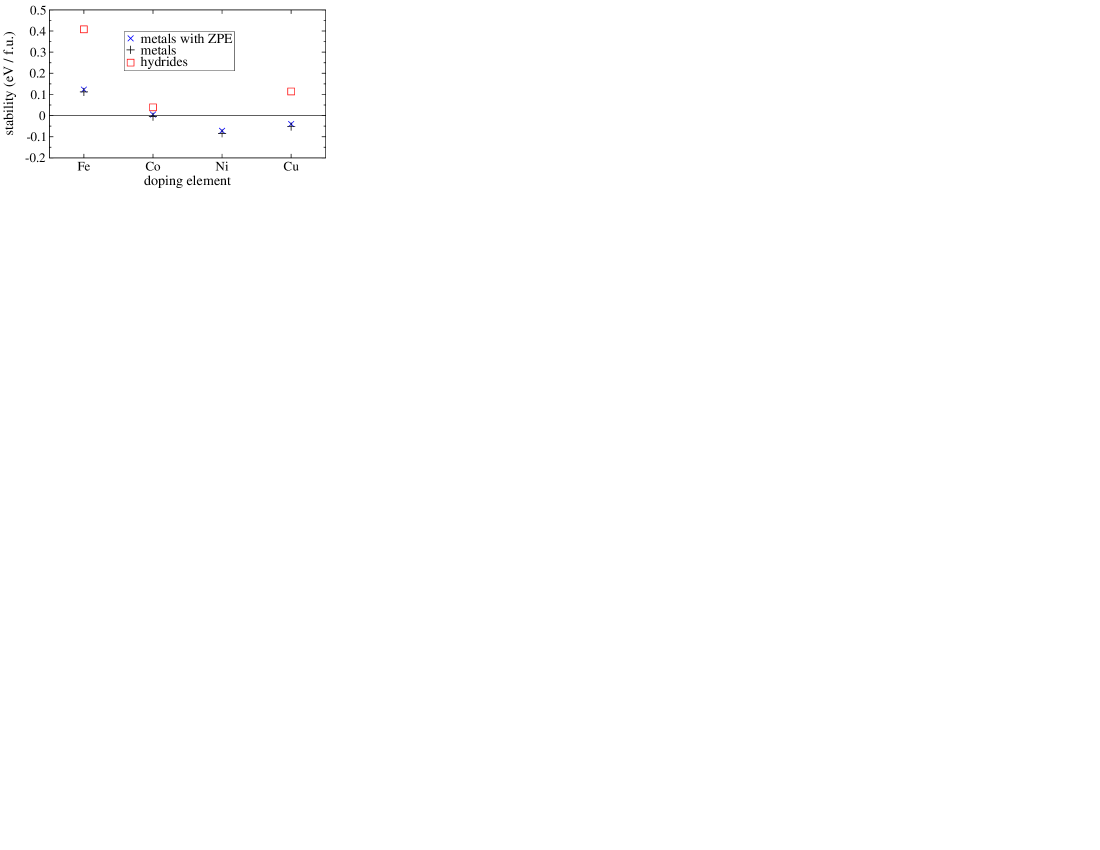
The results are shown in Fig. 2.
Fe doped is thermodynamically unstable with respect to phase segregation into bulk Mg and bulk Fe. Co doped is a marginally unstable material in which segregation is favored by only eV per formula unit. Fe, Co doped are thermodynamically unstable with respect to segregation into and , , respectively. Doping of with Cu leads to a stable material. Experimental work proved the stability of Mg2Ni1-xCux solid solutions;Darnaudery et al. (1983); Li et al. (2004) for these compounds are iso-structural with . Experiment indicates that the hydrogenated phase decomposes into , and .Darnaudery et al. (1983) This is confirmed by our calculations, see Fig. 2.
In conclusion, many of the doped phases are thermodynamically unstable. This does not need to hamper their usefulness, however, since kinetics plays an important role in stabilizing the doped compounds. The hydrogen desorption temperature lies far below the temperatures that is used to anneal these materials.loh The Cu doped metal is thermodynamically stable, and hydrogenating this material can lead to a useful metastable compound.
.
V Optical properties
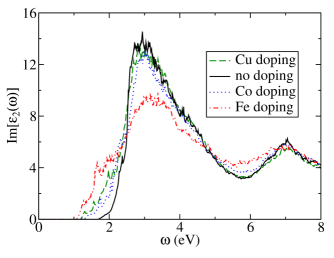
The imaginary part of the dielectric function and the electronic density of states (DOS) of undoped are shown in Figs. 3 and 4, respectively. They are in good agreement with the results of previous calculations.Myers et al. (2002); Haussermann et al. (2002). We find an indirect band gap of 1.6 eV and an optical gap of 1.7 eV. This is in good agreement with the experimental optical gap of 1.7 to 2.0 eV.Lupu et al. (1993); Selvam et al. (1988); Lupu et al. (1987) The agreement is in fact remarkable since DFT usually underestimates the band gap by -%. The dielectric function of has two peaks, which can be directly related to the two peaks in the DOS of the valence bands.
The dielectric functions of doped are also shown in Fig. 3. Doping alters the dielectric function and, remarkably, the size of the change correlates with the change in hydrogen desorption enthalpy caused by the dopants, see Fig. 1. This can be explained by noticing that both changes have a common cause. The changes in desorption enthalpy are due to changes in metal–hydrogen bond lengths and bond energies. Changes in bond energies shift the energy levels and hence can be detected in the optical spectrum. Such changes are largest in Fe doped . An Fe dopant atom includes two extra hydrogen atoms. It gives the largest perturbation in the lattice, with almost half of the metal–hydrogen bond lengths being changed with respect to the undoped case.
The DOS of doped is given in Figure 4. To facilitate an internal comparison the DOS of all compounds is aligned at the bottom of the valence band. Besides the fundamental gap between the valence and conduction bands, we can identify a clear gap in the valence bands, between 2.4 and 3.6 eV below the Fermi level in undoped . The states above this valence gap have a strong metal character, whereas the lower valence states have a dominant hydrogen character. Cu and Fe doping introduces states in the valence gap, whereas all dopants introduce states in the fundamental gap. In the case of Cu doping these appear near the top of the valence band, whereas for Co and Fe doping gap states appear near the bottom of the conduction band. Since we have adjusted the amount of hydrogen upon doping, all doped materials are semiconducting.
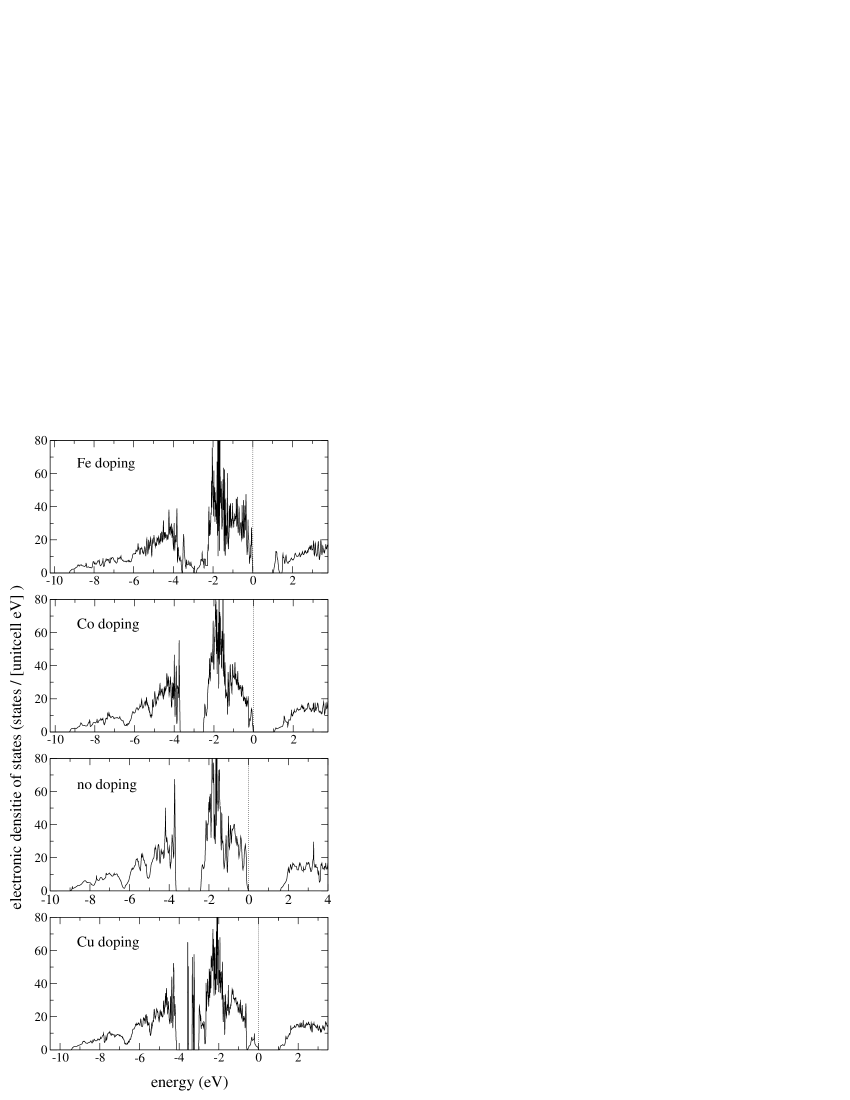
The DOS can be used to interpret the dielectric functions. The decrease in the fundamental gap in the DOS upon doping gives a decrease in the optical gaps. The largest changes in the dielectric function are observed upon Fe doping. The highest peak decreases as compared to the undoped case and the valley between the two peaks is less deep. In addition, a distinct shoulder appears at low energy. Fe doping gives a clear peak in the DOS at the bottom of the conduction band, which yields the distinct shoulder in the dielectric function. The two main peaks in the dielectric functions are not shifted upon doping. This indicates that the dopants mainly give rise to additional features via the introduction of gap states, as can be observed in the DOS. Similar conclusions hold for the Cu and Co doped cases, but the perturbation of the DOS caused by doping is smaller than for the Fe doped case.
VI Conclusions
is a promising hydrogen storage material with fast (de)hydrogenation kinetics. Its hydrogen desorption enthalpy, however, is too large for practical applications. In this paper we study the effects of transition metal doping by first-principles density functional theory calculations. We show that the hydrogen desorption enthalpy can be reduced by 0.1 eV/H2 if one in eight Ni atoms is replaced by Cu or Fe. Replacing Ni by Co atoms, however, increases the hydrogen desorption enthalpy. We study the thermodynamic stability of the dopants in the hydrogenated and dehydrogenated phases. Doping with Co or Cu leads to marginally stable compounds, whereas doping with Fe leads to an unstable compound. The optical response of is also substantially affected by doping. The optical gap in is eV. Doping with Co, Fe or Cu leads to impurity bands that reduce the optical gap by up to 0.5 eV.
We study the effects of transition metal doping on the hydrogen desorption enthalpy and the optical properties of by first-principles DFT calculations. The desorption enthalpy is reduced by 84 meV per H2, if one in eight Ni atoms is replaced by an Fe atom. Replacing one in eight Ni atoms by a Cu atom reduces the desorption enthalpy by 71 meV/H2, but replacement by a Co atom increases it by 28 meV/H2. Including energy corrections due to the zero point motions of the atoms changes the absolute values of the desorption energies by 0.1 eV/H2. Since however the zero point energies per hydrogen atom are almost independent of the compound studied, the relative values of the desorption energies are not affected.
The thermodynamic stabilities of the doped dehydrogenated and the fully hydrogenated compounds are studied by considering possible decomposition reactions. The results show that Cu doped is stable, Co doped is marginally stable, and Fe doped is unstable with respect to phase separation into , bulk Mg and the bulk transition metal dopant. The doped hydrogenated compounds are either marginally unstable in the case of Co or Cu doping, or, in the case of Fe doping, clearly unstable. Kinetic barriers could be be sufficiently high to stabilize metastable doped compounds since the hydrogen desorption temperatures are smaller than the temperatures used to anneal these materials. Nevertheless, thermodynamics indicates that Cu is the most promising candidate to lower the hydrogen desorption enthalpy of .
By calculating the dielectric function within the random phase approximation we study the effects of doping on the optical properties of . The changes in the dielectric function can be interpreted in terms of the electronic densities of states of the corresponding compounds. The dopant atoms introduce states in the fundamental gap, as well as below the valence Ni -band. These states cause a shift in the onset of absorption to lower energy by up to 0.5 eV and they decrease the relative heights of the peaks in the absorption spectrum. The sizes of these changes correlate with the change in the hydrogen desorption enthalpy caused by the dopants. Fe doping causes the largest disruption in the lattice, and the largest change in the optical properties.
Acknowledgements.
The authors wish to thank R. A. de Groot (FOM) and R. Griessen (Vrije Universiteit Amsterdam) for helpful discussions and G. Kresse (University of Vienna) for use of the optical package. This work is part of the research programs of ‘Advanced Chemical Technologies for Sustainability (ACTS)’ and the ‘Stichting voor Fundamenteel Onderzoek der Materie (FOM)’, both financially supported by ‘Nederlandse Organisatie voor Wetenschappelijk Onderzoek (NWO)’.References
- Zuttel (2004) A. Zuttel, Naturwissenschaften 91, 157 (2004).
- Stampfer et al. (1960) J. F. Stampfer, C. E. Holley, and J. F. Suttle, J. Am. Chem. Soc. 82, 3504 (1960).
- Bogdanovic and Spliethoff (1987) B. Bogdanovic and B. Spliethoff, Int. J. Hydrog. Energy 12, 863 (1987).
- Bortz et al. (1998) M. Bortz, B. Bertheville, K. Yvon, E. A. Movlaev, V. N. Verbetsky, and F. Fauth, J. Alloy. Compd. 279, L8 (1998).
- Liang et al. (1999) G. Liang, J. Huot, S. Boily, A. V. Neste, and R. Schulz, J. Alloy. Compd. 291, 295 (1999).
- Bouaricha et al. (2000) S. Bouaricha, J. P. Dodelet, D. Guay, J. Huot, S. Boily, and R. Schulz, J. Alloy. Compd. 297, 282 (2000).
- Liang et al. (2000) G. Liang, J. Huot, S. Boily, A. V. Neste, and R. Schulz, J. Alloy. Compd. 297, 261 (2000).
- Leng et al. (2004) H. Y. Leng, T. Ichikawa, S. Hino, N. Hanada, S. Isobe, and H. Fujii, J. Phys. Chem. B 108, 8763 (2004).
- Reilly and Wiswall (1968) J. J. Reilly and R. H. Wiswall, Inorg. Chem. 7, 2254 (1968).
- Yvon et al. (1981) K. Yvon, J. Schefer, and F. Stucki, Inorg. Chem. 20, 2776 (1981).
- Noreus and Werner (1981) D. Noreus and P. E. Werner, Mater. Res. Bull. 16, 199 (1981).
- Soubeyroux et al. (1984) J. L. Soubeyroux, D. Fruchart, A. Mikou, M. Pezat, and B. Darriet, Mater. Res. Bull. 19, 1119 (1984).
- Zolliker et al. (1986a) P. Zolliker, K. Yvon, J. D. Jorgensen, and F. J. Rotella, Inorg. Chem. 25, 3590 (1986a).
- Post and Murray (1987) M. L. Post and J. J. Murray, J. Less-common. Metals. 134, 15 (1987).
- Zeng et al. (1999) K. J. Zeng, T. Klassen, W. Oelerich, and R. Bormann, J. Alloy. Compd. 283, 151 (1999).
- Liao and Zhang (1997) M. S. Liao and Q. E. Zhang, Inorg. Chem. 36, 396 (1997).
- Garcia et al. (1999) G. N. Garcia, J. P. Abriata, and J. O. Sofo, Phys. Rev. B 59, 11746 (1999).
- Garcia et al. (2002) G. N. Garcia, J. P. Abriata, and J. O. Sofo, Phys. Rev. B 65, 064306 (2002).
- Haussermann et al. (2002) U. Haussermann, H. Blomqvist, and D. Noreus, Inorg. Chem. 41, 3684 (2002).
- Myers et al. (2002) W. R. Myers, L. W. Wang, T. J. Richardson, and M. D. Rubin, J. Appl. Phys. 91, 4879 (2002).
- Richardson et al. (2001) T. J. Richardson, J. L. Slack, R. D. Armitage, R. Kostecki, B. Farangis, and M. D. Rubin, Appl. Phys. Lett. 78, 3047 (2001).
- Lohstroh et al. (2004a) W. Lohstroh, R. J. Westerwaal, B. Noheda, S. Enache, I. A. M. E. Giebels, B. Dam, and R. Griessen, Phys. Rev. Lett. 93, 197404 (2004a).
- Lohstroh et al. (2004b) W. Lohstroh, R. J. Westerwaal, J. L. M. van Mechelen, C. Chacon, E. Johansson, B. Dam, and R. Griessen, Phys. Rev. B 70, 165411 (2004b).
- Isidorsson et al. (2002) J. Isidorsson, I. A. M. E. Giebels, R. Griessen, and M. Di Vece, Appl. Phys. Lett. 80, 2305 (2002).
- Lupu et al. (1993) D. Lupu, R. Grecu, and S. I. Farcas, Z. Phys. Chemie-Int. J. Res. Phys. Chem. Chem. Phys. 181, 143 (1993).
- Selvam et al. (1988) P. Selvam, B. Viswanathan, and V. Srinivasan, J. Electron Spectrosc. Relat. Phenom. 46, 357 (1988).
- Lupu et al. (1987) D. Lupu, R. Sarbu, and A. Biris, Int. J. Hydrog. Energy 12, 425 (1987).
- Lohstroh et al. (2007) W. Lohstroh, R. Westerwaal, J. van Mechelen, H. Schreuders, B. Dam, and R. Griessen, J. Alloy. Compd. 430, 13 (2007).
- Vece et al. (2005) M. D. Vece, A. M. J. van der Eerden, D. Grandjean, R. J. Westerwaal, W. Lohstroh, S. G. Nikitenko, J. J. Kelly, and D. C. Koningsberger, Mater. Chem. Phys. 91, 1 (2005).
- Westerwaal et al. (2006) R. J. Westerwaal, M. Slaman, C. P. Broedersz, D. M. Borsa, B. Dam, R. Griessen, A. Borgschulte, W. Lohstroh, B. Kooi, G. ten Brink, et al., J. Appl. Phys. 100, 063518 (2006).
- Pasturel et al. (2006) M. Pasturel, M. Slaman, D. M. Borsa, H. Schreuders, B. Dam, R. Griessen, and W. Lohstroh, Appl. Phys. Lett. 89, 021913 (2006).
- Darnaudery et al. (1983) J. Darnaudery, M. Pezat, and B. Darriet, J. Less-Common Met 92, 199 (1983).
- Lei et al. (1994) Y. Q. Lei, Y. M. Wu, Q. M. Yang, J. Wu, and Q. D. Wang, Z. Phys. Chemie-Int. J. Res. Phys. Chem. Chem. Phys. 183, 379 (1994).
- Sun et al. (1995) D. L. Sun, Y. Q. Lei, W. H. Liu, J. J. Jiang, J. Wu, and Q. D. Wang, J. Alloy. Compd. 231, 621 (1995).
- Ikeda et al. (1998) K. Ikeda, S. Orimo, A. Zuttel, L. Schlapbach, and H. Fujii, J. Alloy. Compd. 280, 279 (1998).
- Liang et al. (1998) G. Liang, S. Boily, J. Huot, A. V. Neste, and R. Schulz, Mater. Sci. Forum. 269-2, 1049 (1998).
- Bobet et al. (2000) J. L. Bobet, E. Akiba, Y. Nakamura, and B. Darriet, Int. J. Hydrog. Energy 25, 987 (2000).
- Bobet et al. (2002) J. L. Bobet, E. Grigorova, M. Khrussanova, M. Khristov, D. Radev, and P. Peshev, J. Alloy. Compd. 345, 280 (2002).
- Sato et al. (2003) T. Sato, H. Blomqvist, and D. Noreus, J. Alloy. Compd. 356, 494 (2003).
- Li et al. (2004) L. Q. Li, I. Saita, K. Saito, and T. Akiyama, J. Alloy. Compd. 372, 218 (2004).
- Simicic et al. (2006) M. V. Simicic, M. Zdujic, R. Dimitrijevic, L. Nikolic-Bujanovic, and N. H. Popovic, J. Power Sources 158, 730 (2006).
- (42) W. Lohstroh private communication.
- Kresse and Joubert (1999) G. Kresse and D. Joubert, Phys. Rev. B 59, 1758 (1999).
- Blöchl (1994) P. E. Blöchl, Phys. Rev. B 50, 17953 (1994).
- Kresse and Furthmüller (1996a) G. Kresse and J. Furthmüller, Phys. Rev. B 54, 11169 (1996a).
- Kresse and Furthmüller (1996b) G. Kresse and J. Furthmüller, Comput. Mater. Sci. 6, 15 (1996b).
- Kresse and Hafner (1993) G. Kresse and J. Hafner, Phys. Rev. B 47, 558 (1993).
- Perdew et al. (1992) J. P. Perdew, J. A. Chevary, S. H. Vosko, K. A. Jackson, M. R. Pederson, D. J. Singh, and C. Fiolhais, Phys. Rev. B 46, 6671 (1992).
- Louie et al. (1982) S. G. Louie, S. Froyen, and M. L. Cohen, Phys. Rev. B 26, 1738 (1982).
- Kresse et al. (1995) G. Kresse, J. Furthmüller, and J. Hafner, Europhys. Lett. 32, 729 (1995).
- Gajdos et al. (2006) M. Gajdos, K. Hummer, G. Kresse, J. Furthmüller, and F. Bechstedt, Phys. Rev. B 73, 045112 (2006).
- Blöchl et al. (1994) P. E. Blöchl, O. Jepsen, and O. K. Andersen, Phys. Rev. B 49, 16223 (1994).
- Monkhorst and Pack (1976) H. J. Monkhorst and J. D. Pack, Phys. Rev. B 13, 5188 (1976).
- Zolliker et al. (1986b) P. Zolliker, K. Yvon, J. Jorgensen, and F. J. Rotella, Inorg. Chem. 25, 3590 (1986b).
- Zolliker et al. (1985) P. Zolliker, K. Yvon, P. Fischer, and J.Scheffer, Inorg. Chem. 24, 4177 (1985).
- Didisheim et al. (1984) J. Didisheim, P. Zolliker, K. Yvon, P. Fischer, J. Scheffer, M. Gubelmann, and A. Williams, Inorg. Chem. 23, 1953 (1984).
- van Setten et al. (2005) M. J. van Setten, G. A. de Wijs, V. A. Popa, and G. Brocks, Phys. Rev. B 72, 073107 (2005).
- Weast and Astle (1982) R. C. Weast and M. J. Astle, CRC Handbook of Chemistry and Physics (CRC press, New York, 1982), 62nd ed.
- Huber and Herzberg (1979) K. Huber and G. Herzberg, Molecular Spectra and Molecular Structure, vol. IV Constants and diatomic molecules (Van Nostrand Reinhold Company, 1979).