Present address: ]Unité de Recherche Biopolymères, Interactions, Assemblages, INRA, BP 71627, 44316 Nantes cedex 3, France
Structure and dynamics of l-Ge: Neutron scattering experiments and ab initio molecular dynamics simulations
Abstract
We report the first measurements of the dynamics of liquid germanium (l-Ge) by quasi-elastic neutron scattering on time-of-flight and triple-axis spectrometers. These results are compared with simulation data of the structure and dynamics of l-Ge which have been obtained with ab initio density functional theory methods. The simulations accurately reproduce previous results from elastic and inelastic scattering experiments, as well as the -dependence of the width of the quasi-elastic signal of the new experimental data. In order to understand some special features of the structure of the liquid we have also simulated amorphous Ge. Overall we find that the atomistic model represents accurately the average structure of real l-Ge as well as the time dependent structural fluctuations. The new quasi-elastic neutron scattering data allows us to investigate to what extent simple theoretical models can be used to describe diffusion in l-Ge.
pacs:
61.25.-f,61.12.Ex,61.20.Ja,61.20.LcI Introduction
The investigation of the structure of the condensed phases of germanium is of importance for fundamental science since this material exhibits polymorphism in the solid state and pronounced changes in density and bonding upon melting. Research in this field is also relevant to several applied physics problems and semiconductor technology.
In its solid phase germanium shows a large degree of polymorphism. In its stable crystalline phase at ambient pressure, the crystal has a diamond structure in which each Ge atom is surrounded by four covalently bonded first neighbors in a tetrahedral formation. This phase of Ge has a very low density with respect to a close-packed structure and is semiconducting. Upon application of pressure, the tetrahedrally bonded network is disrupted and the number of neighbors and the density increase. Around 100 kbar, a phase transition to the metallic -tin (or white-tin) structure occurs and at even higher pressures an hexagonal phase and a close-packed phase are foundVorha1986 .
At standard pressure the melting temperature of crystalline Ge is = 1210.4 K. At the melting transition the tetrahedral network is disrupted and the average coordination number increases from 4 to about 7, which is still low compared to other liquid metals which typically have coordination number between 9 and 12. Liquid germanium is metallic Glazov1969 . Germanium can also be produced in an amorphous phase in which distorted tetrahedra are connected in a continuous random network with defects. Amorphous germanium is semiconducting.
Experimental investigations of the density and bonding changes in different phases of germanium are numerous, using both X-ray Isherwood1972 ; Waseda1975 ; Filipponi1995 and neutron diffraction Gabathuler1979 ; Davidovic1983 ; Bellissent-Funel1984 ; Salmon1988 ; Kawakita2002 techniques. The static structure factor shows features that differ from those found in simple liquids: The first diffraction maximum is unusually low and has a shoulder on its high momentum transfer side. Thus a hard-sphere model does not seem to be appropriate for describing the arrangement of atoms in l-Ge and several models have been proposed based on the short-range order found in white-tin (also called tin) Isherwood1972 , on the coexistence of randomly distributed, molten metal-like atomic arrangement and covalent crystal-like atomic arrangement Waseda1975 , on a mixture of fourfold and highly coordinated metallic arrangements Gabathuler1979 or on a quasicrystalline model of l-Ge Bellissent-Funel1984 . However none of these accounts for all of the structural features of l-Ge.
In order to investigate the dynamics of l-Ge, Hosokawa and co-workers Hosokawa2001 used inelastic X-ray scattering to measure the spectra for momentum transfers from 0.2 to 2.8 Å-1. The phonon dispersion curve extracted from the low spectra matches the hydrodynamic sound velocity Yoshimoto1996 . The study of the relationship between and , the half width of at half maximum, shows that at higher the measured spectral width cannot be described by the relationship given by de Gennes for simple dense fluids Gennes1959 nor the expression for spectra of dense hard-sphere fluids given by Cohen and co-workers Cohen1987 . According to Hosokawa et al. Hosokawa2001 , this discrepancy supports the view that neither the structure nor the dynamics of l-Ge can be described using a single pair interaction. However, Ashcroft Ashcroft1990 proposed a cluster model with transient covalent structures in the liquid which seems to be consistent with the experimental results. In this model, the first maximum in reflects the inter-cluster correlation while the shoulder on the high side and the remaining oscillations are associated with the atom-atom contributions. Regarding the experimental results on the dynamics, Hosokawa et al. put forward the idea that the narrowing of the quasi-elastic line at the position of the maximum in , followed by an increase of at values that correspond to the location of the shoulder in , indicates that the covalent structures are diffusing slowly while individual atoms are subject to rapid translational motion.
Also on the theoretical side, much effort has been devoted to modeling and reproducing both structural and dynamic features of l-Ge. In 1985, Stillinger and Weber proposed a model potential function comprising both two- and three-atom contributions to describe the interactions in solid and liquid states of Si Stillinger1985 . Molecular dynamics simulations of l-Si using this potential give structural properties in good agreement with the measurements. Subsequently this potential was also used for simulating amorphous germanium Ding1986 . Later on the potential devised for l-Si was used with a different set of parameters which were obtained by fitting crystalline as well as liquid Ge phases Yu1996 , the corresponding static structure factors and pair correlation functions therefore being in good agreement with the experimental results. However, it was found that the computed diffusion coefficient is larger than the experimental values by a factor of 2.
There have also been a number of ab initio molecular dynamics (AIMD) simulations of l-Ge, starting in 1993 with the work of Kresse and Hafner who found a quite good agreement between simulated and experimental pair correlation functions and electronic densities of states Kresse1993 . Subsequently they extended their study to the liquid metal-amorphous semiconductor transition Kresse1994 . Their results for the pair correlation function and the static structure factor are in good agreement with experimental measurements for the amorphous phase. According to these authors, the results for the liquid indicate a broad homogeneous distribution of local bonding configurations and show that both classes of models proposed earlier (mixture of fourfold coordinated and highly coordinated metallic arrangements Gabathuler1979 and both sixfold coordinated and metallic arrangements Isherwood1972 ) are unrealistic. The simulation of supercooled and amorphous Ge shows the increase of the local tetrahedral order with decreasing temperature. The self-diffusion coefficient extracted from the simulated trajectory close to the melting point, = 1.0 cm2/s, is in good agreement with the measured value. Similar results about the structure and diffusion of l-Ge were found by Takeuchi and Garzón Takeuchi1994 using the ab initio Car-Parrinello molecular-dynamics scheme Car1985 . A further study was performed by Godlevsky et al. Godlevsky1995 which yielded similar results for both the structure factor and the pair correlation function. Kulkarni and collaborators performed similar simulations and studied the influence of the temperature between 1250 K and 2000 K on the structural properties of the liquid Kulkarni1997 . These simulations show that liquid Ge is a good metal but has some special short-range order arising from residual covalent bonding. Only at the highest temperatures, l-Ge seems to evolve toward a more conventional close-packed liquid metal. Calculations of the dynamic structure factor from an ab initio MD simulation were performed by Chai and co-workers Chai2003 . They show good agreement with the experimental data, although the statistical noise due to the small number of atoms (64) is rather large and has to be convoluted with a Gaussian of width 2.5 meV representing the experimental resolution function.
As can be seen from these experimental and theoretical studies, experimental investigations of l-Ge are presently not able to determine the microscopic, atomic arrangements in the liquid, but the experiments provide the data which is needed to validate theoretical models and simulations. In this paper, we present a new study of liquid germanium using both quasi-elastic neutron scattering (QENS) experiments and AIMD simulations. The QENS technique provides much clearer insight into diffusive dynamics than inelastic X-ray scattering in an intermediate range due to the higher resolution and approximately Gaussian lineshape of the spectrometer resolution function. The QENS signal is typically most prominent at the -range around the first sharp diffraction peak. QENS data therefore relates directly to local structural fluctuations on a length scale which is most relevant to the on-going discussion about the structure of l-Ge. Section II presents details and results of the QENS measurements. Section III is dedicated to the ab initio simulations of the structure and dynamics of l-Ge and to the comparison with new and existing experimental results and in Section IV we summarize and conclude the present work.
II Neutron scattering study of l-Ge
QENS measurements on l-Ge were performed on cold neutron, time-of-flight (Focus at the Swiss spallation neutron source SINQ, PSI, Switzerland focus_web ; Janssen1997 ; Janssen2000 ) and triple-axis (4F1 at Laboratoire Léon Brillouin, France 4F1_web ) spectrometers. Note that due to the high sound velocity, = 2682 m/s Yoshimoto1996 , the acoustic phonon of l-Ge could not be measured.
II.1 Sample preparation and environment
Solid Ge samples were obtained either as a powder (obtained commercially with a purity of 99.99% in weight) or as pure solid pieces (less sensitive to oxidation and higher packing factor). Solid Ge was inserted into a cylindrical cell (6 mm in diameter) made of vitreous silica which was then sealed under vacuum. Sample preparation was performed either under nitrogen atmosphere or vacuum, in order to avoid contamination of dioxygen (which would lead to formation of GeO or GeO2 at high temperatures). The silica cell was suspended from the end of the sample stick in a niobium envelope. The melting temperature of l-Ge is = 1210.4 K. During the neutron scattering experiments, Ge was heated in standard furnaces. After melting, the height of the sample was between 2 and 5 cm, depending on the initial solid form of Ge.
II.2 Experimental setup and data analysis
In both experiments, the sample temperature was comprised between 1260 K and 1400 K, with a sample of 6 mm in diameter.
On Focus, the measurements were performed at incident wavelengths of 3 Å and 4 Å. Momentum transfer ranges from 0.35 to 3.8 Å-1 at = 3 Å. Background measurements with comparable statistics were performed at both wavelengths for the furnace, empty sample cell and niobium envelope. The instrument resolution function was determined using a cylindrical vanadium sample of diameter 10 mm. The elastic energy resolution at incident wavelength of 3 Å and 4 Å was of the order of 500 eV and 200 eV, respectively. The data were processed with standard software at the instrument (NATHAN).
On 4F1 constant scans were performed between = 0.3 Å-1 and = 3.9 Å-1, although the QENS signal could only be measured unambiguously for 1.5 Å-1. The data were processed with the standard 4F1 program.
II.3 Experimental results
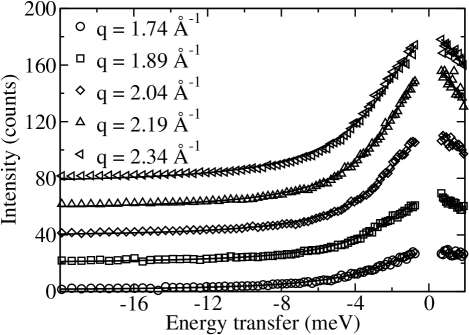
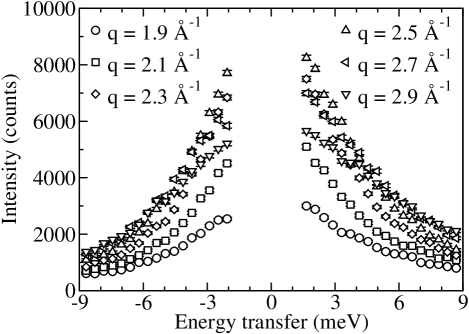
The background signal was almost as strong as the signal from l-Ge. A slight misalignment between the sample and empty cell measurements meant that the data around the elastic peak had to be discarded. The difference spectra were fitted using a single Lorentzian for each (see Fig. 1 for Focus results). The QENS intensity increases and the width decreases as approaches 2.5 Å-1. The triple-axis measurements give similar results (see Fig. 2). The evolution of the QENS signal with will be discussed below with the results from the simulation.
III Ab initio simulation study of l-Ge
III.1 Simulation procedure
All calculations were performed with the Vienna Ab initio Simulation Package (VASP) Kresse1996 ; Kresse1996a , which is based on density functional theory. We carried out most simulations of l-Ge for an ensemble of 64 atoms in a cubic supercell with periodic boundary conditions. The simulated density was , which corresponds to a box of length 11.175 Å.
The atomic dynamics was described in the microcanonical (,,) ensemble. Ultrasoft Vanderbilt pseudopotentials Vanderbilt1990 and the generalized gradient approximation (GGA) with the functional PW91 for the exchange-correlation energy were used. The Brillouin zone was sampled by a Monkhorst-Pack mesh of -points Monkhorst1976 . The wave functions were expanded in a basis of more than 32000 plane waves, corresponding to an energy cut-off of 139.2 eV. One MD run was performed in a cell containing 200 atoms for which the -point grid contained only the gamma point.
The starting configurations for the ab initio simulations were generated from classical MD simulations using the Stillinger and Weber potential Stillinger1985 . For this purpose, systems of 64 Ge atoms were equilibrated at the desired temperatures (three independent samples were extracted from a 50 ps run at high temperature (1700 K); these samples were then equilibrated at the desired temperature by velocity scaling during 10 ps).
After switching to the ab initio (,,) MD, and an equilibration time of 5 ps, three runs of 30 ps using a time step of 3 fs were performed at three different temperatures corresponding to the liquid (1390 K, 1080 K) and supercooled (680 K) states, all at the same density. A similar simulation scheme was used to perform a liquid MD run at 1390 K for the cell containing 200 atoms, the NVE trajectory spanning 15 ps. Three independent configurations of the trajectory at 680 K were quenched at a cooling rate of 68 K/ps in order to obtain three amorphous configurations of the system.
III.2 Numerical results
The mean-squared displacement (MSD) of atoms is one of the dynamic quantities that allows to check whether the system is a liquid or not. The MSD is computed from the relation
| (1) |
and allows the diffusion constant to be determined via the Einstein relation :
| (2) |
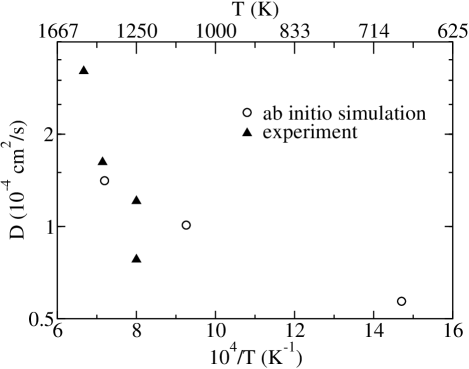
In Fig. 3 we compare the values for as obtained from the simulations with experimental data from Pavlov and Dobrokhotov Pavlov1970 . For around 1400 K, very similar values of are obtained from experiment and ab initio MD, while according to Ref. Yu1996, classical MD overestimates by a factor of 2, which indicates that from this point of view the ab initio calculation is indeed more accurate than simulations with classical force fields. Having performed liquid simulations at 3 temperatures, we are able to observe an Arrhenius behavior of the diffusion constant with an activation energy around 0.72 eV. This quantity corresponds to the average energy needed by a Ge atom to escape from its local environment and undergo diffusion and it is characteristic of a strong liquid.
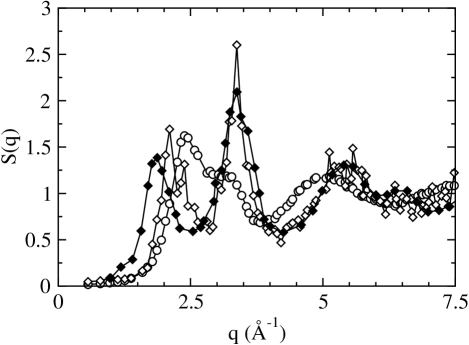
The structure of the liquid can be characterized by the static structure factor which is defined as Hansen2006 :
| (3) |
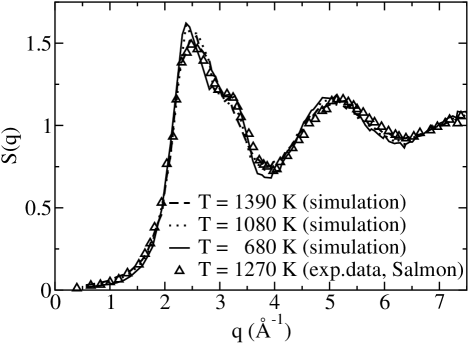
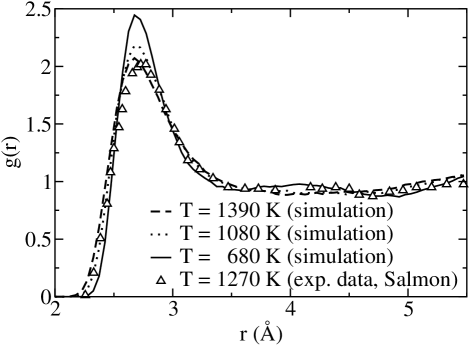
It was computed using, at each temperature, 10000 atomistic configurations. The average is also performed over all vectors of the same magnitude. The results are shown in Fig. 4 together with the experimental result by Salmon Salmon1988 .
At = 1390 K the main sharp peak occurs at = 2.53 Å-1 which is very close to the experimental values ( 2.50 Å-1) Bellissent-Funel1984 ; Salmon1988 ; Waseda1975 . At lower temperatures, the peak is shifted to slightly lower values, which is consistent with measurements in the temperature range from 1270 K to 1820 K Kawakita2002 . The characteristic feature of l-Ge shown by neutron diffraction studies Kawakita2002 , the distinct shoulder at = 3.27 Å-1, i.e. on the high- side of the first sharp peak, is reproduced well by the simulation. As decreases, the height of the main peak increases and the shoulder becomes more distinct. These two features were described at higher temperatures in the simulation work by Kulkarni et al. who found that at = 2000 K the shoulder disappears Kulkarni1997 . The second peak of the static structure factor occurs at 5 Å-1 which is slightly shifted from the experimental value reported by Salmon Salmon1988 who found Å-1 (see also Waseda Waseda1975 ), although the experimental value seems to have an uncertainty of 0.1 Å-1 Isherwood1972 ; Orton1973 .
The pair correlation function , defined as Hansen2006
| (4) |
allows the structure of the system in real space to be characterised. A comparison of simulated and experimental is given in Fig. 5. In particular we see that hardly shows a second peak at distances beyond the first peak, in marked contrast to the situation found in simple liquids such as hard spheres. The structure of l-Ge is significantly different from that of simple liquids. In addition the height of the main peak increases with decreasing temperature but the structure at larger distances remains basically unchanged. Indeed both and show that structural changes over a wide range of temperatures from 680 to 1390 K are generally rather small.
Structural changes become more significant if the liquid phase is quenched to produce an amorphous phase. This can be seen in Fig. 6 in which we show for the supercooled liquid at 680 K and the amorphous state. The amorphous phase was obtained by cooling down, over 10 ps and at constant volume, three independent configurations of the supercooled state at 680 K to K. Thus for this state was calculated by averaging over only three configurations, which is the reason for the substantial noise in the simulation data. In , the first peak is shifted to higher reflecting the high, liquid density that we have imposed on the amorphous structure. At higher , the agreement between experiment and simulation is much better. Looking at snapshots of the system in the amorphous state, one clearly sees a tetrahedral structure in which a Ge atom occupies the center of a tetrahedron. The calculated for the amorphous state (not shown here) shows a main peak shifted to lower interatomic distances (as compared to the liquid state) while the intermediate peak near 4 Å becomes much more pronounced, in agreement with experimental findings Etherington1982 . The main peak in corresponds to the interatomic distance between the center and a vertex of the tetrahedron while the higher interatomic distance at 4 Å is associated with the distance between two vertices of the tetrahedron (see also Fig. 7). Despite imposing the higher liquid density on our amorphous structures, the shortest Ge-Ge distances are overestimated by several 0.1 Å.
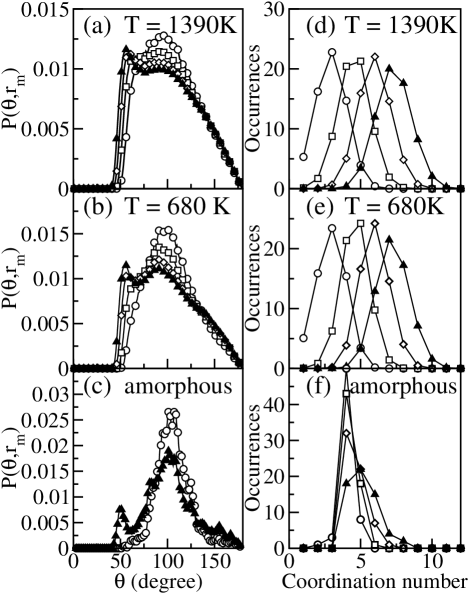
Given the nature of the many-body interactions in germanium and the resulting open structure, it is interesting to compute the angular distribution of atoms. For this we define as the normalized distribution of angles defined by vectors going from a reference atom to two neighbors of which are within a radius of the reference atom. In Fig. 8 we show for several values of around the minimum in . In the liquid this minimum is not very pronounced, see Fig. 5, leading to an uncertainty regarding the definition of the nearest neighbor shell. In contrast, in the amorphous state, the first minimum in (calculated, not shown here) is clearly defined allowing an unambiguous definition of nearest neighbors. We note that any bond angle distribution plot will tend to have a maximum close to 90˚and that changes in the distribution as a function of radius and temperature are therefore particularly meaningful.
For liquid and supercooled systems, we observe a broad peak around = 98˚if = 2.8 Å. With increasing , this peak tends to shift to smaller angles, around = 90˚. For the amorphous phase, the corresponding peak is observed at slightly larger angles, around 105˚for = 2.8 Å, indicative of a slightly more regular tetrahedral environment in the amorphous phase, even at higher pressure as imposed by the liquid density. With increasing , a new peak appears for angles between 55˚and 60˚in the liquid and supercooled phases. At = 680 K, this feature is more pronounced than at higher temperatures. In the amorphous phase, this peak appears at smaller angles, about 50˚. A bond angle of 60˚is characteristic of metallic bonding, since this value represents the locally most closely packed structure of the system. The broad peak around 100˚is typical of flattened tetrahedra, the symmetric tetrahedral angle being 109.5˚, see also Fig. 7.
Regarding the coordination number, most atoms have either 4 or 5 nearest neighbors in the amorphous phase (see right panels of Fig. 8). On the other hand, in the liquid and supercooled phases, for typical values of the first minimum in , 3.4 Å, the coordination number is between 6 and 7.
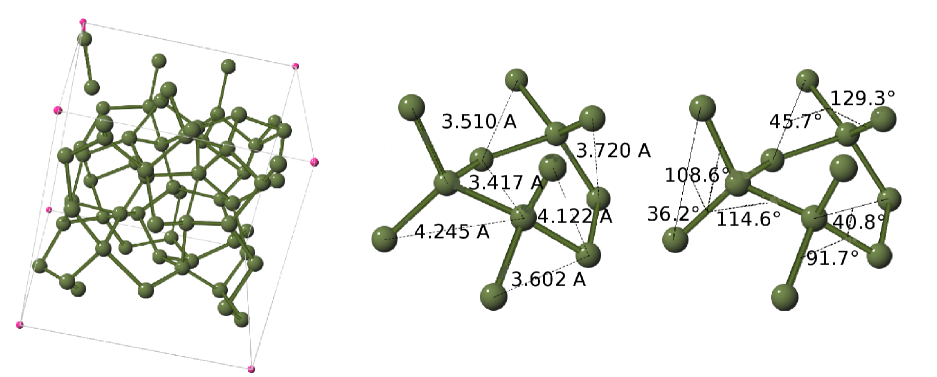
We note that obviously the coordination number increases with increasing radius of the coordination sphere for both liquid and supercooled systems, which is consistent with the so-called -tin hypothesis Isherwood1972 . This hypothesis states that in l-Ge, each atom has four nearest neighbors on a flattened tetrahedron and two other neighbors slightly further away on the normal to the plane of the flattened tetrahedron (see Fig. 9 for a schematic representation of the local environment of tin). Denoting by the main interatomic distance reported from , i.e. Å, the -tin configuration would lead to interatomic distances of the order of (between the center and a vertex of the tetrahedron), Å (between two adjacent vertices of the tetrahedron), and Å (between two opposite vertices of the tetrahedron) together with distances slightly higher than associated with the two further neighbors.

Snapshots of the simulated structure of amorphous Ge are shown in Fig. 7. On the left, the 64 atoms are represented together with the corners of the simulation box. The bonds between atoms correspond to two covalent radii (1.22 Å for Ge) plus a bond tolerance of 0.4 Å so a bond is drawn for interatomic distances smaller than 2.84 Å. The two other plots show a zoom into this structure. Three “tetrahedra” are represented together with some interatomic distances and bond angles. The covalent bond length of Ge corresponds to the main peak in around 2.5 Å. On the other hand, the distance between two neighboring vertices of a tetrahedron ranges from 3.5 Å to 4.5 Å, which accounts for the broad peak around 4 Å in (calculated, not shown here). Looking at the bond angles, their values are mainly distributed between 85˚and 130˚with an average value of 105˚, close to the tetrahedral value (see Fig. 8). At higher interatomic distances (see distribution for = 3.4 Å in Fig. 8), another peak appears around 50˚. This one is due to the angles formed by the two following vectors: The first one goes from a vertex to the center of the tetrahedron while the second one goes from the same initial vertex to another vertex of the same tetrahedron. This is also shown in Fig. 7.
Having established that the liquid simulations do indeed describe well the corresponding experimental system and having studied the structural aspects, we now investigate the dynamic features of the system. For this we start with the intermediate scattering function which is defined as Hansen2006
| (5) |
Since the system is isotropic, we have performed an average over the different orientations of .
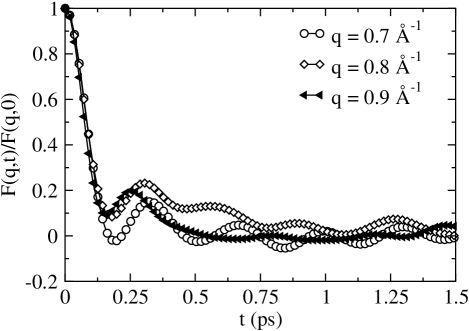
Figure 10 shows the (normalized) of l-Ge at 1390 K and for low values from the large simulation cell. The oscillations are associated with the presence of the acoustic mode at these wave-vectors. The period of these oscillations decreases with increasing and also they become more damped, which is directly associated with the shape of the dispersion and damping of the acoustic phonon as a function of , as will be discussed in more detail below.
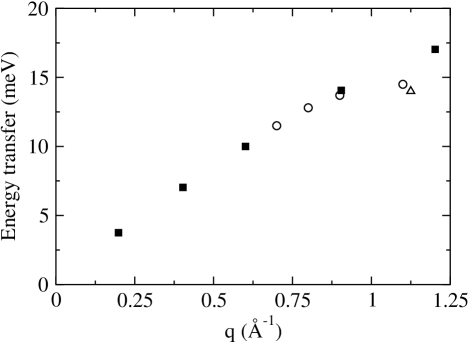
The dynamic structure factor was computed by a Fourier transform in time of Hansen2006 . In a periodic system of cell side only the reciprocal lattice points are accessible. The first q-point corresponds to a spatial correlation over a distance , which is not meaningful in a cell of side . -points bigger than correspond to correlations over distances shorter than , which are uniquely defined. In the intermediate range there is a progressive increase in meaningful correlations which correspond to distances between atoms close to the centre and those close to the apexes of the cell. The lowest unambiguous -values, calculated in 0.1 Å-1 -strips, for the 200 atom cell start at 0.7 Å-1 and at 1.1 Å-1 for the 64 atom cell. At smaller , Å-1, shows a well defined acoustic mode, the position of which can be compared directly with the corresponding experimental results from the inelastic X-ray scattering of Ref. Hosokawa2001, . Such a comparison is made in Fig. 11 and it shows a very good agreement between experiment and simulations. The width of the acoustic phonons increases with frequency, both in the experiment and in our simulations. At 1.2 Å-1 the phonons are hardly visible in the experimental spectrum and in the simulations, the width is of the same order as the frequency. Accordingly we estimate the error in the frequency to be a few meV. We also mention that the dispersion of the acoustic mode does not show any significant variation with in the temperature range investigated.
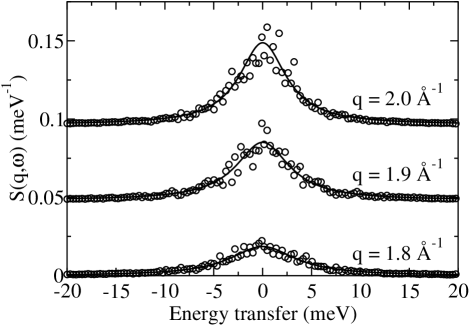
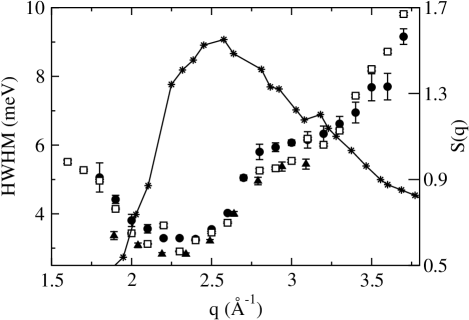
At higher values, Å-1, the QENS signal dominates (see Fig. 12). Fitting the quasi-elastic line of with a Lorentzian allows to determine its half-width at half maximum (HWHM), the -dependence of which is shown in Fig. 13 together with the corresponding structure factor. Unconstrained fits of the Focus data lead to an underestimation of the spectral width at low ( 1.8 Å-1), where the QENS intensity is weak, and also at higher ( 3.2 Å-1), where only the negative energy transfer part of the spectrum is present, and therefore we show the Focus data only for 1.8 Å-1 3.2 Å-1. The simulated widths are obtained from the simulation at 1390 K by fitting with a Lorentzian. From Fig. 13 we recognize that the data from the simulation agrees very well with the one from the experiment. In particular we see that in the simulation as well as in the experiments a narrowing of the quasi-elastic peak is observed for = 2.4 Å-1 and between = 2.8 Å-1 and 3.2 Å-1, which corresponds to the main peak and the shoulder in the static structure factor, respectively (see line in Fig. 13). This behavior can be interpreted as de Gennes narrowing Gennes1959 , i.e. the fact that if one considers the dynamics on length-scales that are close to the one of the local structure of the liquid, the structure is basically preserved and thus there is only a relatively small loss of memory and consequently a small broadening of the dynamic structure factor.
The -dependence of the width of the quasi-elastic peak can be compared with theoretical predictions based on different models. The simplest expression for the HWHM for a dense monoatomic liquid is that the half-width is the square root of the normalized second frequency moment Hansen2006 :
| (6) |
In a somewhat refined approach, Cohen et al. Cohen1987 predicted for a dense hard-sphere fluid the half-width to be given by
| (7) |
where
| (8) |
Here is the self-diffusion coefficient of the hard-sphere fluid within the Enskog theory, is the diameter of the hard spheres, and and are the zeroth- and second-order spherical Bessel functions, respectively. Note that equation (7) is only valid for intermediate values of , , where with the mean free path of a particle which, since we are considering a dense system, is much smaller than . Approximating the Ge liquid by a system of hard spheres, we have calculated the quantity by using the static structure factor from the AIMD simulations at 680 K and 1390 K. For the size of the hard spheres, the location of the first peak in the pair correlation function gives, see Fig. 5, = 2.8 Å at = 1390 K and = 2.7 Å for = 680 K. For , we used the value of the self-diffusion constant calculated from the simulation (its dependence on the mass and the density can be expected to be very similar to that of the self-diffusion constant of the Enskog theory).
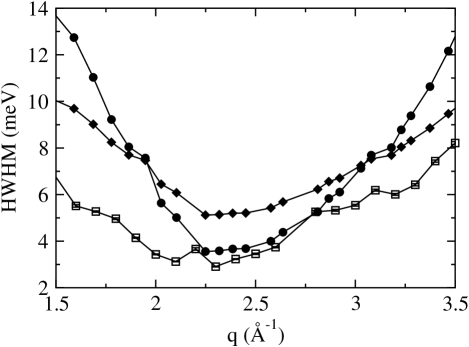
These models are compared with the width of the quasi-elastic signal obtained from AIMD in Fig. 14. Both models show de Gennes narrowing at 2.3 Å-1. For the dense monoatomic fluid model, the -dependence of is reasonably good but the value of is generally overestimated by a factor of 2. Such a systematic discrepancy has also been found for a variety of simple liquids (Ar, Kr, Lennard-Jones) Cohen1987 and thus it is not surprising that in the present system, which has a much more complex structure, we find a similar deviation. In contrast to this the width predicted by the hard sphere model is in better agreement close to Å-1 but the increase in width away from this -value is over-estimated. Also this result is in qualitative agreement with the ones reported by Cohen et al. for simple liquids Cohen1987 which thus gives evidence that Eq. 7 is not valid for simple liquids and for network forming systems.
IV Discussion and Conclusion
Liquid Ge is a system of fundamental interest for its structure and fluctuations. Accordingly a number of models have been proposed to describe the local structure of this liquid. Due to the complexity of the system, models can only be validated by comparison with experimental data but it is found that static structure measurements presently available are not sufficient to distinguish between various plausible models. Since the local structure of a liquid is time dependent, a more stringent requirement of any model is that the structural fluctuations should also be correctly reproduced. In this context, we have presented new QENS measurements of the diffusive dynamics of Ge on the length scale of 3 Å, which is most pertinent to the structural issues on the scale of the nearest neighbor distance.
To understand this new QENS data, we have also performed ab initio simulations of liquid and amorphous Ge, the latter highlighting features of the liquid phase. These simulations not only reproduce accurately the quasi-elastic broadening but also IXS data of acoustic phonons at small , which concerns the structure on a length scale 6 Å. In addition, we have found very good agreement for the static structure factor, the pair correlation function and the diffusion constant, the latter enabling an activation energy of 0.7 eV to be determined for diffusion processes, which is characteristic of a strong liquid.
The success of AIMD is in contrast to classical MD simulations that use two and three body potentials that, although they reproduce reasonably well the average structural properties, do not give an accurate description of the dynamics Ding1986 ; Hugouvieux2004a . The QENS data and simulations also allow theoretical models, which relate the spectral line width to the static structure factor, to be tested. We have found that the second frequency moment given by Eq. (6) does not give a good description of the line width in the whole -range whereas expression (7) describes this width well around the main peak in the static structure factor.
Simulations also allow models to be investigated at the atomic level. Analysing the AIMD trajectories shows an average coordination number of 6-7 for the liquid and a broad range of bond angles with an average value of 100 degrees. In contrast to this, for amorphous Ge, the coordination number is close to 4 and the average bond angle is closer to the value for a symmetric tetrahedron, even when the liquid density is imposed. In terms of simple models of the structure, the AIMD simulation is approximately consistent with the -tin hypothesis Isherwood1972 .
In conclusion, QENS data constitutes experimental evidence that can differentiate between different theoretical and numerical models. The ab initio model presented here is in very good agreement with all new and existing, structural and dynamic experimental data. Further details of the liquid structure are most likely to be obtained from more in-depth investigation of the MD trajectories.
Acknowledgements.
The authors thank R. Bellissent (CEA, Grenoble) for useful discussions in designing the sample cell and preparing the experiments and P. Martin (ILL) for his help in preparing the niobium cell. Some of the calculations were performed on the CCRT/CEA clusters. Part of this work was supported by the European Community’s Human Potential Program under contract HPRN-CT-2002-00307, DYGLAGEMEM.References
- (1) Y.K. Vohra, K.E. Brister, S. Desgreniers, A.L. Ruoff, K.J. Chang and M.L. Cohen, Phys. Rev. Lett. 56, 1944 (1986).
- (2) P.M. Glazov, S.N. Chizhevskaya and N.N. Glagoleva, Liquid Semiconductors (Plenum, New York, 1969), Chap. 3.
- (3) A. Filipponi and A. Di Cicco, Phys. Rev. B 51, 12322 (1995).
- (4) S.P. Isherwood, B.R. Orton and R. Mănăilă, J. Non-Cryst. Solids 8-10, 691 (1972).
- (5) Y. Waseda and K. Suzuki, Zeit. Phys. B 20, 339 (1975).
- (6) M.-C. Bellissent-Funel and R. Bellissent, J. Non-Cryst. Solids 65, 383 (1984).
- (7) M. Davidović, M. Stojić and D. Jović, J. Phys. C: Solid State Phys. 16, 2053 (1983).
- (8) J.P. Gabathuler and S. Steeb, Z. Naturforsch. 34a, 1314 (1979).
- (9) Y. Kawakita, S. Takeda, T. Enosaki, K. Oshima, H. Aoki, T. Masaki and T. Itami, J. Phys. Soc. Jpn 71, 12 (2002).
- (10) P.S. Salmon, J. Phys. F: Met. Physics 18, 2345 (1988).
- (11) S. Hosokawa, Y. Kawakita, W.C. Pilgrim and H. Sinn, Phys. Rev. B 63, 134205 (2001).
- (12) N. Yoshimoto, H. Shibata, M. Yoshizawa, K. Suzuki, K. Shigematsu and S. Kimura, Jpn. J. Appl. Phys. 35, 2754 (1996).
- (13) P.G. de Gennes, Physica 25, 825 (1959).
- (14) E. G. D. Cohen, P. Westerhuijs and I.M. de Schepper, Phys. Rev. Lett. 59, 2872 (1987).
- (15) N.W. Ashcroft, Nuovo Cimento D 12, 597 (1990).
- (16) F.H. Stillinger and T.A. Weber, Phys. Rev. B 31, 5262 (1985).
- (17) K. Ding and H.C. Andersen, Phys. Rev. B 34, 6987 (1986).
- (18) W. Yu, Z.Q. Wang and D. Stroud, Phys. Rev. B 54, 13946 (1996).
- (19) G. Kresse and J. Hafner, Phys. Rev. B 47, 558 (1993).
- (20) G. Kresse and J. Hafner, Phys. Rev. B 49, 14251 (1994).
- (21) N. Takeuchi and I.L. Garzon, Phys. Rev. B 50, 8342 (1994).
- (22) R. Car and M. Parrinello, Phys. Rev. Lett. 55, 2471 (1985).
- (23) V. Godlevsky, J.R. Chelikowsky and N. Troullier, Phys. Rev. B 52, 13281 (1995).
- (24) R.V. Kulkarni, W.G. Aulbur and D. Stroud, Phys. Rev. B 55, 6896 (1997).
- (25) J.D. Chai, D. Stroud, J. Hafner and G. Kresse, Phys. Rev. B 67, 104205 (2003).
- (26) S. Janssen, J. Mesot, L. Holitzner, A. Furrer and R. Hempelmann, Physica B 234, 1174 (1997).
- (27) S. Janssen, D. Rubio-Temprano and A. Furrer, Physica B 283, 355 (2000).
- (28) http://sinq.web.psi.ch/sinq/instr/focus/focus.html
- (29) http://www-llb.cea.fr/spectros/pdf/4f1-llb.pdf
- (30) G. Kresse and J. Furthmüller, Phys. Rev. B 54, 11169 (1996).
- (31) G. Kresse and J. Furthmüller, Comput. Mater. Sci. 6, 15 (1996).
- (32) D. Vanderbilt, Phys. Rev. B 41, 7892 (1990).
- (33) H.J. Monkhorst and J.D. Pack, Phys. Rev. B 13, 5188 (1976).
- (34) P.V. Pavlov and E.V. Dobrokhotov, Sov. Phys. Solid State 12, 225 (1970).
- (35) J.-P. Hansen and I.R. McDonald, Theory of simple liquids (Academic Press, 2006).
- (36) B.R. Orton and S.P. Woodisse, J. Phys. F: Met. Physics 3, 1141 (1973).
- (37) G. Etherington, A.C. Wright, J.T. Wenzel, J.C. Dore, J.H. Clarke and R.N. Sinclair, J. Non-Cryst. Solids 48, 265 (1982).
- (38) V. Hugouvieux, A complete simulation of neutron scattering experiments: From model systems to liquid germanium (PhD Thesis, Université Montpellier II, 2004).