Mean-field potential calculations of high-pressure equation of state for shock-compressed BeO
Abstract
A systematic study of the Hugoniot equation of state, phase transition, and the other thermodynamic properties including the Hugoniot temperature, the electronic and ionic heat capacities, and the Grüneisen parameter for shock-compressed BeO, is presented by calculating the total free energy. The method of calculations combines first-principles treatment for 0-K and finite-T electronic contribution and the mean-field-potential approach for the vibrational contribution of the lattice ion to the total energy. Our calculated Hugoniot shows good agreement with the experimental data.
pacs:
64.30.+t,64.70.Kb,71.15.NcAs one member of the series of alkaline-earth oxide, Beryllium oxide (BeO) has many unique properties. First, it is the only one alkaline-earth oxide to crystallize in the wurtzite (WZ) rather than the rock-salt (RS) structure. Further, not only is BeO harder than the other alkaline-earth oxides but also it is among the hardest materials known. It is a good insulator like other alkaline-earth oxide, but its heat conductivity is an order of magnitude higher, which makes it a technically promising ceramicVidal . Also, BeO has a high melting point. These interesting physical properties are related to characteristic features of interatomic bonding in BeO: for example, Compton scattering measurements revealed a significant component of the primarily ionic bonding in BeOJoshi .
An important issue for BeO is its pressure induced phase transition sequence, which has been investigated by a few experimentalHazen ; Jeph and theoretical studiesChang1 ; Chang2 ; Lich1 ; Lich2 ; Boe . This is motivated by the well-known dielectric theory of Phillips and Van VechtenPhillips that the structural phase stabilities of the compounds can be related to their ambient spectroscopic ionicities (). According to this theory, binary compounds with crystallize in a sixfold coordinated structure such as RS, while those with crystallize in a fourfold structure such as zincblende (ZB) or wurtzite (WZ). BeO has a Phillips ionicityPhillips of 0.602 and crystallize in the WZ structure under ambient conditions, in accord with the dielectric theory. Under pressure, the dielectric theoryPhillips predicts that the tetragonal compounds with first transform to an ionic sixfold structure and then to some metallic phase, while those with transforms to the metallic phase directly. Given this understanding, however, the pressure induced phase sequence for BeO is not yet fully understood. The early two ab initio calculations support this general prediction that a WZRS transition occurs at 22 GPa Chang1 (40 GPa from Ref.Jeph ). On the other side, the latter calculations predicted the WZ first transformed into zinc blende (ZB) and then into RS. Herein, the work of Camp and Doren using soft nonlocal pseudopotential predicted the WZ-ZB-RS transitions at 74 and 137GPaCamp , while Park et al.Park , who used a first-principles soft nonlocal pseudopotential method within the generalized-gradient approximation (GGA), predicted the transition pressure to be 91 (WZZB) and 147 GPa (ZBRS) respectively. This unusual transition sequence is attributed to the large charge asymmetry and the small bond length of BeOPark . By use of full-potential linear muffin-tin orbital (FPLMTO) method, Boettger and WillsBoe have also predicted a WZZBRS phase transition sequence with the final transition at about 95 GPa. They also predicted a theoretical Hugoniot, consistent with shock wave data up to 100 GPa. More recently, Cai et al.Cai , by systematically calculating the enthalpy barrier of the phase transition, have shown that only the WZRS transition will occur with increasing pressure.
Experimentally, Raman spectra showed no evidence for a phase transition up to 55 GPa in BeOJeph and Hugoniot data did not reveal any volume change for stresses up to 100 GPaJeph . The most recent static high pressure x-ray diffraction experimentYoshi also showed no phase transition up to 126 GPa, but a new phase was found at 137 GPa. With increasing pressure, the WZ phase disappeared at 175 GPa.Yoshi
In this paper we theoretically study the phase transformation and Hugonoit of BeO under shock-wave dynamic compression, which is one of the most efficient ways to explore the thermodynamic properties of a material at ultrahigh pressures and temperatures. From its derived Hugoniot state one can deduce much useful information such as equation of state (EOS) at feasible temperature range. The theoretical methodology we employed in this paper is a combined ab initio electronic structure calculation and classical mean-field potential (MFP) thermodynamic treatmentWangYi . Recent efforts have applied the MFP approach to a number of prototype metalsWangYi , indicating that both the calculated Hugoniot equation of state (at pressures up to 1000 GPa and temperatures up to 70 000 K) and room temperature isotherms are well described within the experimental uncertainties. We calculate the 0K enthalpy of WZ, ZB, and RS BeO as a function of pressure. The results show that the enthalpy of WZ BeO is equal to that of ZB BeO at 84 GPa. When pressure is increased to be 105 GPa, the enthalpy for WZ and RS BeO approach to cross. Based on our first-principles total energy data, we give a MFP analysis of the phase transition, Hugoniot EOS and the other thermodynamic properties for shock-compressed BeO. Our calculated Gibbs free energies show that the WZRS trnasition pressure is 103.8 GPa. Furthermore, our calculated Hugoniot is in good agreement with the experimental data.
For a system with a given averaged atomic volume and temperature , the Helmholtz free-energy per atom can be written as
| (1) |
where represents the 0-K total energy which is obtained from ab initio electronic structure calculations, is the free energy due to the thermal excitation of electrons, and is the ionic vibrational free energy which is evaluated from the partition function . Here is the total number of lattice ions. In the mean-field approximation, the classical is given byWasserman
| (2) |
The essential of the MFP approach is that the mean-field potential is simply constructed in terms of as followsWangYi
| (3) |
where represents the distance that the lattice ion deviates from its equilibrium position . It should be mentioned that the well-known Dugdale-MacDonald expressionDug for the Grüneisen parameter can be derived by expanding to order . Then, can be formulated as
| (4) |
with
| (5) |
When the electron-phonon interaction and the magnetic contribution are neglected, the electronic contribution to the free energy is , where the bare electronic entropy takes the formJarlborg
| (6) |
where is the electronic density of states (DOS) and is the Fermi distribution. With respect to Eq. (6), the energy due to electron excitations can be expressed as
| (7) |
where is the Fermi energy. Given the Helmholtz free-energy , the other thermodynamic functions such as the entropy , the internal energy , the pressure , and the Gibbs free energy , can be readily calculated.
The first task is to calculate the 0-K total energy in a wide range of the volume. For this we employ the full-potential linearized-augmented-plane-wave (FPLAPW) methodBlaha within the generalized gradient approximation (GGA)Perdew . The total energy of BeO with WZ structure was calculated at 96 lattice constants ranging from 4.14 a.u. to 6.04 a.u. in steps of 0.02 a.u., while for the ZB structure 91 lattice constants ranging from 6.22 a.u. to 8.02 a.u. in steps of 0.02 a.u. were considered. Finally for RS BeO we sample 81 lattice constants ranging from 5.46 a.u. to 8.66 a.u. in steps of 0.04 a.u.. As a reference, we mention that the calculated zero-pressure lattice constants for the three BeO structures are a.u. (, WZ), a.u. (ZB), and a.u. (RS), respectively. In all of three structures of BeO and for all the atomic volumes considered, we use the constant value of the muffin-tin radii of 1.2 a.u. for Be atom and 1.0 a.u. for O atom respectively. The plane-wave cutoff is determined by . 4000 -points in the full Brillouin zone are used for reciprocal-space integerations.
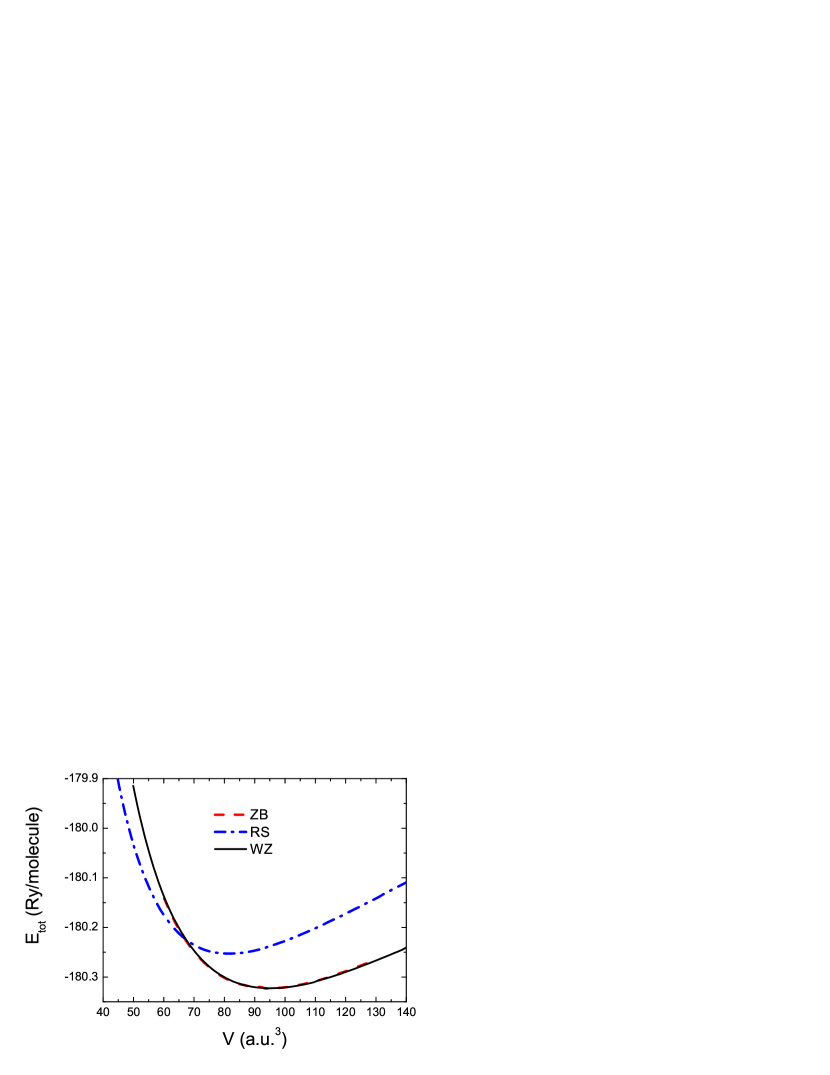
Figure 1 shows the calculated 0-K total energies as a function of volume for WZ, ZB, and RS phases of BeO. The equilibrium volumes (per BeO molecule) corresponding to the minima in total energy are a.u. 3 (WZ), a.u. 3 (ZB), and a.u. 3 (RS), respectively. The equilibrium properties, including lattice parameters, bulk modulus from the fit with Murnaghan curveMur1 , and the equilibrium elastic constants for the three crystal structures of BeO, are listed in Table I. For comparison, the available experimental data are also given in Table I. The other available theoretical data have been collected in Ref.[2]. For WZ phase, the calculated equilibrium lattice constant and bulk modulus are 2.712 Åand 203 GPa, in good agreement with the experimental values of 2.698 Åand 212 GPaHazen . Also one can see that the calculated values of elastic constants for WZ structure agree as well with the measured data.
| Phase | ||||||||||
| WZ | 2.712 | 1.623 | 203 | 432 | 120 | 87 | 463 | 142 | 156 | |
| WZ (exp.a) | 2.698 | 1.622 | 212 | 460 | 125 | 82 | 490 | 145 | 167 | |
| ZB | 3.825 | - | 201 | 342 | 148 | - | - | 208 | - | |
| RS | 3.648 | - | 231 | 298 | 214 | - | - | 294 | - | |
| aReference 23. |

To obtain the most stable structure at finite pressure and temperature, the Gibbs free energy should be used. For the experimental data, the last term is assumed small and therefore usually neglected by the previous theoretical studiesChang1 ; Chang2 ; Lich1 ; Lich2 ; Boe . For comparison with those calculations, we also work with the enthalpy for each phase as a first step. The enthalpy of BeO with WZ, ZB, and RS structures are calculated, and the phase transition pressure is obtained from the enthalpy curve crossings. The difference in enthalpy between WZ and ZB type BeO as a function of pressure is plotted in Fig. 2, which shows that the two structures are energetically very close with the enthalpy difference typically of 5 meV in a wide range of pressure. This result is not surprising because of the high similarity between the two structures. The local environment of any atom in either ZB or WZ is exactly the same as far as the second neighbors. One can see from Fig. 2 that the enthalpy of WZ BeO is lower than that of ZB phase up to 84 GPa of pressure, while the enthalpy of ZB BeO begins to be lower for GPa. It thus seems that the zero temperature WZZB transition pressure is 84 GPa. This result is close to that (87 GPa) obtained by Cai et al.Cai based on pseudopotential method with generalized-gradient approximation (GGA). From the point of view of enthalpy barrier, however, Cai et al. noticed that the WZZB phase transition cannot happen up to 200 GPa. Here we adopt this point and will not consider the WZZB transition in the following Hugoniot calculations.
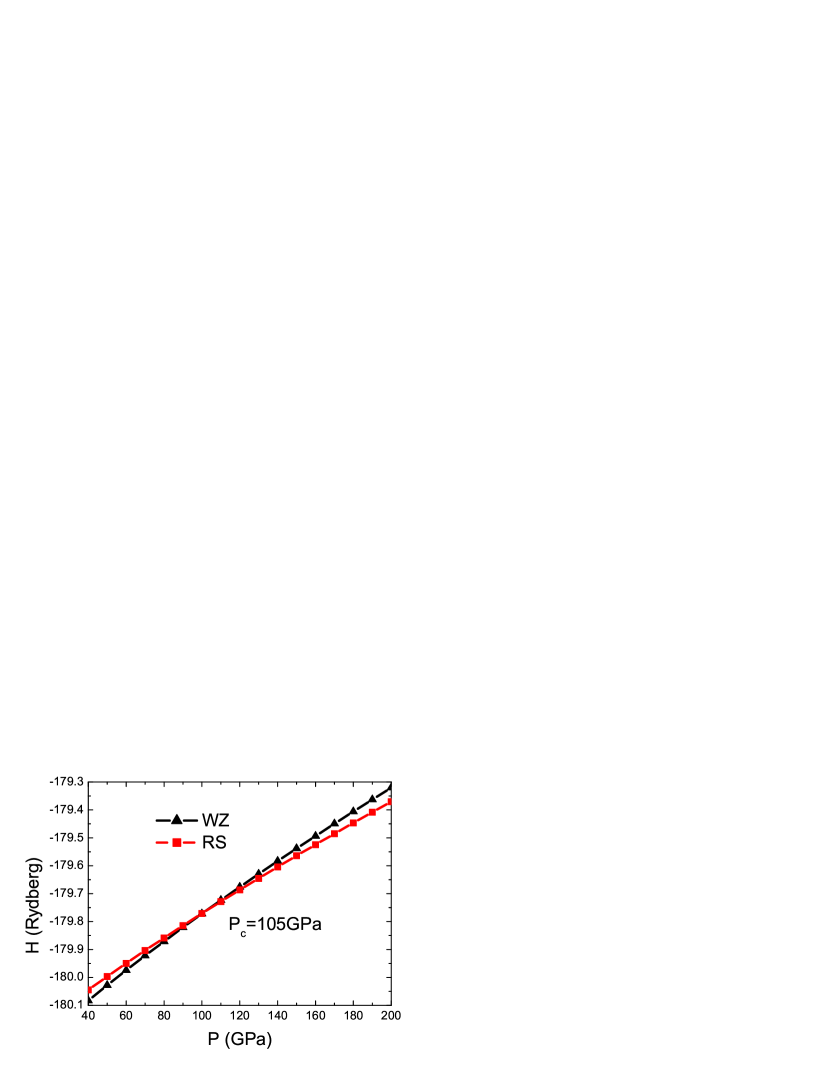
The enthalpy of BeO with WZ and RS structures are shown in Fig. 3 as a function of pressure. One can see that the enthalpy of the two structures increase almost linearly with increasing pressure. When the pressure is up to 105 GPa they become equal. With further increasing pressure the RS structure becomes more stable. Thus it is expected to undergo a WZRS phase transition around =105 GPa. This value is identical to that obtained in Ref.Cai but prominently differs from the calculated result of 147 GPa in Ref.Park . This difference seems to be mainly caused by the different methods for finding the transition pressure.
Next we investigate the phase transition properties of BeO under shock-wave compress. In this case, we fully take into account the temperature effect in MFP framework and calculate the Gibbs free energies of the Hugoniot states for the WZ and RS structures, respectively.
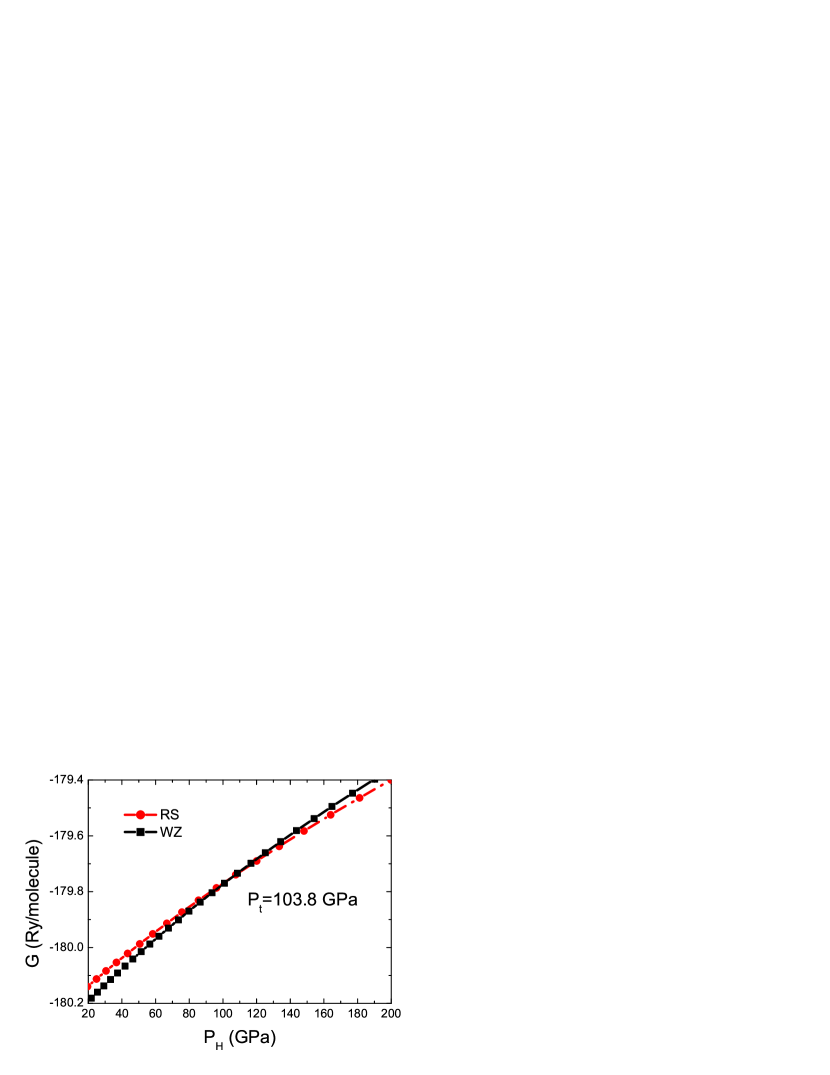
Fig. 4 shows the Gibbs free energies of these two structures as a function of the Hugoniot pressure. It can be seen that the overall slope and dependence of Gibbs free energy upon pressure for both two structures are essentially the same as zero-temperature case [Fig. 3]. The Hugoniot WZRS transition pressure is 103.8 GPa. Compared to zero-temperature result (105 GPa), one can see that the temperature effect (typically of 1000 K, see Fig. 7 below) is small for BeO WZRS phase transition. Thus we derive a conclusion that the enthalpy can be reasonably used to study the phase transition of BeO in experimentally relevant temperature region. This is not surprising considering the fact of high melting point of BeO.
Now we turn to study the Hugoniot for BeO. Hugoniot states, which are derived by the conventional shock-wave techniqueLos , are characterized by using measurements of shock velocity () and particle velocity () with and , where is the Hugoniot pressure, and is the initial density. By applying the Rankine-Hugoniot jump conditions, these data define a compression curve [volume () versus pressure ()] as a function of known Hugoniot energy ():
| (8) |
where and refer to the atomic volume and energy under ambient condition, respectively.
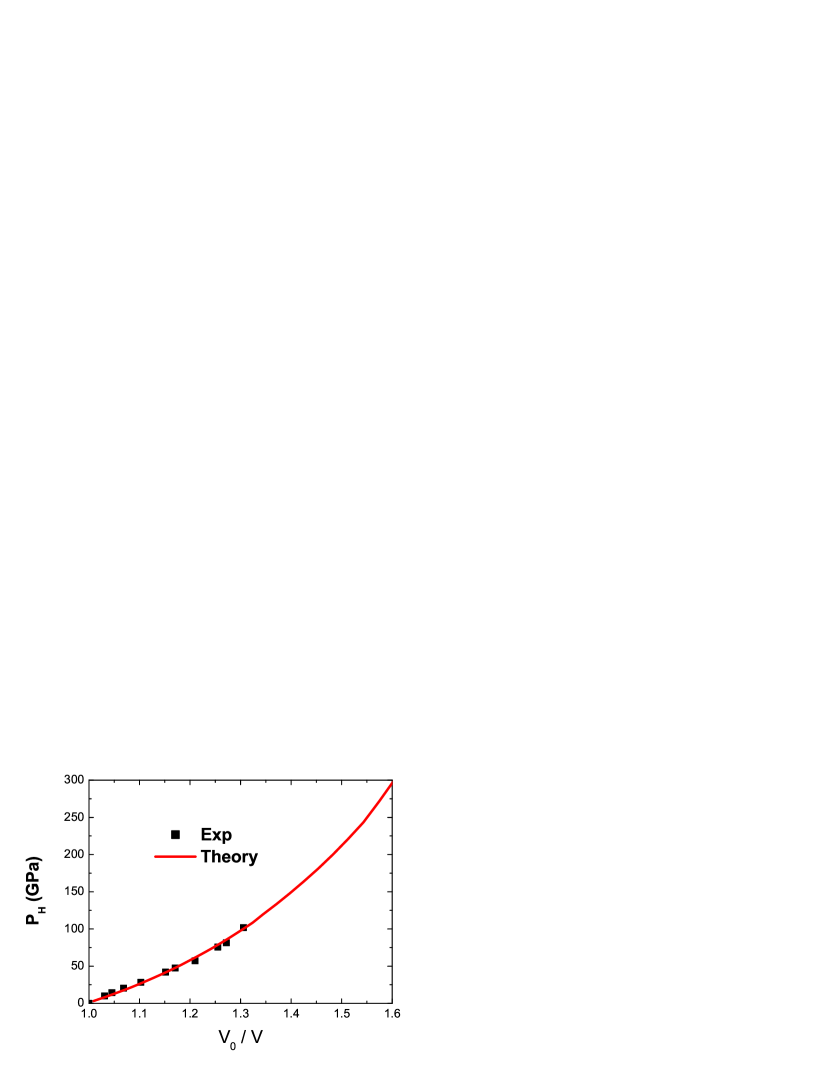
Unlike the static EOS, the temperature along the Hugoniot can undergo a range from room temperature to several tens of thousands of degrees, thus the calculations of the Hugoniot state could serve as a good check of a theoretical method for the thermodynamic calculation. Using the calculated and , we calculate the Hugoniot EOS for BeO at pressures up to 200 GPa. Due to the fact revealed in Fig. 4 that there occurs a WZRS phase transition at the Hugoniot pressure GPa, thus during calculation of Hugoniot EOS, we choose BeO structure to be WZ for the Hugoniot pressure , while for the RS phase of BeO is chosen. Correspondingly, the initial ambient volume () and energy () of WZ phase is used when , while for , the values of and refer to the RS phase. Our calculated Hugoniot EOS is shown in Fig. 5 (solid curve) in the form of a Hugoniot pressure () versus . Note that to reproduce the experimental densityHazen , in accord with the commonly used expedient, here the 0-K isotherm of WZ structure was uniformly adjusted by reducing 5.85 GPa to each pressure and the energies are subsequently modified in a consistent fashion. For comparison with our theoretical result, the experimental dataLos are also shown in the figure (squares). One can see that an overall agreement between our calculation and the experiment is fairly good up to the experimentally attainable Hugoniot pressure of 102 GPa, except for four points in the range of 0-30 GPa where the strength effects are large. At present, unfortunately, no experimental shock-wave data at further high compression ( GPa) exist. Therefore, to verify our theoretical Hugoniot for RS phase at GPa, more experimental data are needed. However, based on the good agreement between our calculations and the experiment for WZ phase BeO, and the coincidence between our calculated result of WZ-RS phase transition and the previous calculationCai , we expect that our calculated Hugoniot curve of versus can be adopted in the realistic application if the higher-pressure data are needed.
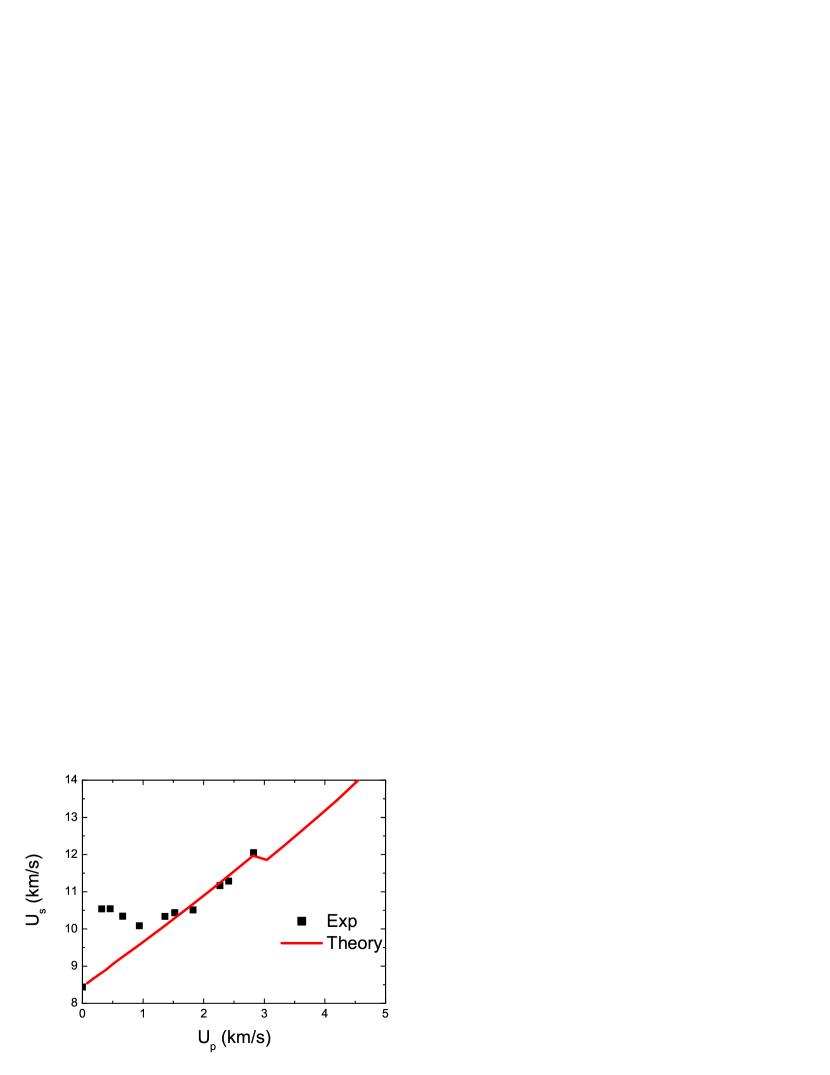
For further illustration, we have also transformed the calculated versus relation to that between shock velocity and particle velocity . The result is plotted in Fig. 6 (solid curve). The experimental dataHazen are also shown in this figure (squares) for comparison. One can see that at mediate particle velocities (2 km/s3 km/s), the calculation agrees well with the experiment. Whereas at low particle velocities the discrepancy becomes apparent although the calculated starting point () coincides exactly with the measurement (see Fig. 6). Boettger et al. have also noticed this discrepancy in their zero-temperature calculationBoe . This may be due to the experimental failure to correctly measure the particle velocity at low shock-pressure region by the presence of strength effect as mentioned above.

We also carried out the calculation of the temperature along the principal Hugoniot. Note that in the traditional reduction of the Hugoniot data, the temperature estimate remains less secure since it requires the accurate knowledge of specific heat and the Grüneisen parameter values that are not well known. Using the present MFP, however, all these quantities can be calculated straightforwardly (see below). The calculated Hgoniot emperature is shown in Fig. 7 as a function of pressure. During calculation, again, we choose BeO structure to be WZ at Hugoniot pressure , while for the RS phase of BeO is chosen. The turning segment in Fig. 7 around is due to this choice of different crystal phases in the two pressure regions separated by transition point . At present there is no experimental data of Hugonoit temperature available. Thus our calculated result needs to be verified in the future.
Since we have explicitly calculated the Hermholtz free energy as a function of and , all other thermodynamic parameters can be calculated. In particular, one can evaluate the thermodynamic Grüneisen parameter. Given the isothermal bulk modulus which is given by , the volume thermal-expansion coefficient , and the constant-volume heat capacity , the thermodynamic Grüneisen parameter can be obtained as follows:
| (9) |
Figure 8 plots our calculated as a function of Hugoniot pressure . Again two crystal structures, i.e., the wurtzite phase for and the rocksalt phase for , are used in the calculation. One can see that the conventional assumption =constant for the reductions of shock-wave data is not applicable on the whole for the present case of BeO.

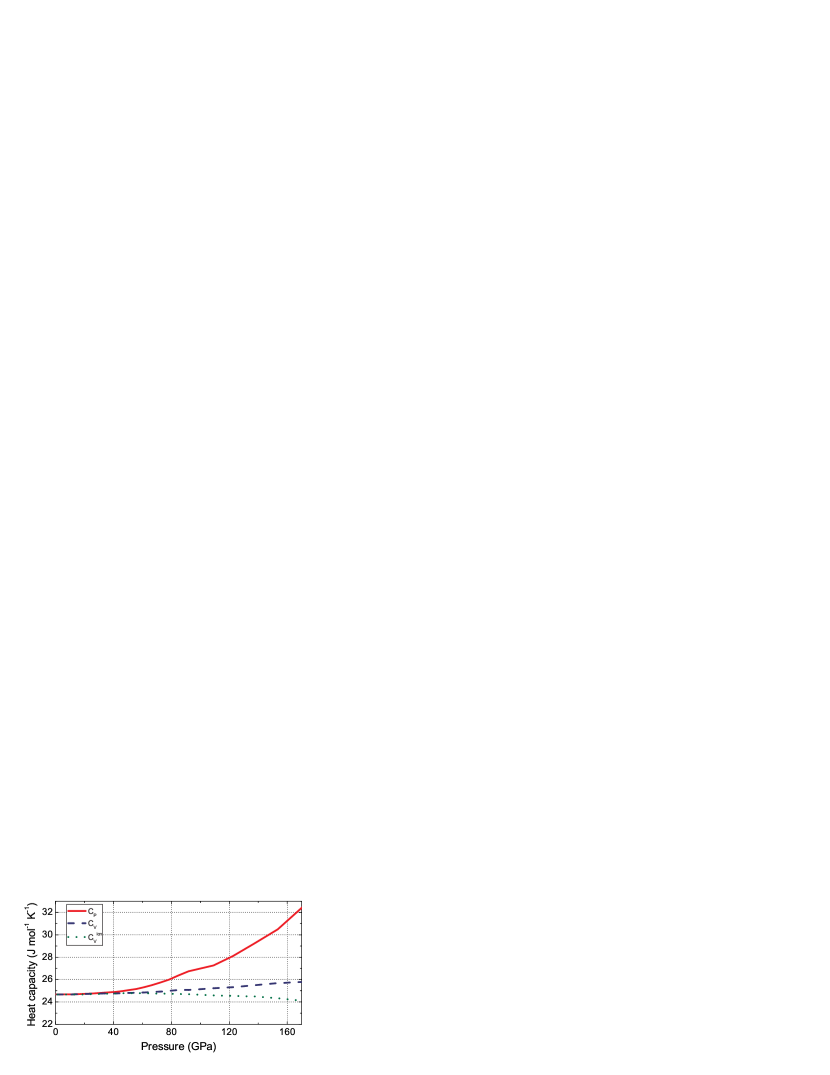
Figure 9 plots the constant-pressure heat capacity which is calculated by
| (10) |
For comparison, the constant-volume heat capacity and its ionic component are also shown in Fig. 9. One can see that the thermal electronic contribution (the difference between the dashed line and dotted line) to the heat capacity is negligibly small in a wide range of pressure. This is what one expects considering the insulator nature of BeO. For the metals, on the other side, the thermal electronic contribution to may be comparable with the lattice ion contribution at high compression due to the increasing electronic DOS at fermi level.
In summary, by using first-principles FPLAPW total-energy calculation method supplemented with MFP treatment to take into account the vibrational contribution of the lattice ions, we have systematically studied the Hugoniot EOS of shock-compressed BeO. Our calculated Hugoniot shows good agreement with the experimental data. The other thermodynamic properties, such as the Hugoniot temperature, the Grüneisen parameter, and the heat capacities including the ionic and electronic contributions, have also been calculated. In addition, the 0-K enthalpy and finite-temperature Gibbs free energies of BeO with WZ, ZB, and RS structures have also been calculated, which indicates that the WZRS transition pressure change by Hugoniot temperature is tiny. Therefore, the 0-K calculation is considerably reasonable in studying the solid-solid phase transition of BeO. We expect our present results shed some light on understanding the Hugoniot properties of oxides under shock-wave compression.
This work was partially supported by CNSF under grant number 10544004 and 10604010.
References
- (1) G. Vidal-Valat, J.P. Vidal, K. Kurki-Suonio, and R. Kurki-Suonio, Acta Crystallogr. A 43, 540 (1987).
- (2) K.B. Joshi, R. Jain, R.K. Pandya, B.L. Ahuja, and B.K. Sharma, J. Chem. Phys. 111, 163 (1999).
- (3) R. M. Hazen and L. W. Finger, J. Appl. Phys. 59, 3728 (1986); S. P. Marsh, High Pressures 5, 503 (1973); also see LASL Shock Hugoniot Data, edited by S. P. March (University of California, Berkeley, 1980), p. 241.
- (4) A.P. Jephcoat, R.J. Hemley, H.K. Mao, R.E. Cohen, and M.J. Mehl, Phys. Rev. B 37, 4727 (1988).
- (5) K.J. Chang, S. Froyen and M.L. Cohen, J. Phys. C: Solid State Phys. 16, 3475 (1983).
- (6) K.J. Chang and M.L. Cohen, Solid State Commun. 50, 487 (1984).
- (7) A. Lichanot, M. Caillet, C. Larrieu, R. Dovesi and C. Pisani, Chem. Phys. 164, 383 (1992).
- (8) A. Lichanot and M. Rerat, Chem. Phys. Lett. 211, 249 (1993).
- (9) J.C. Boettger and J.M. Wills, Phys. Rev. B 54, 8965 (1996).
- (10) J. C. Phillips, Bonds and Bands in Semiconductors (Academic, New York, 1973); J. C. Phillips, Rev. Mod. Phys. 42, 317 (1970).
- (11) P. E. Van Camp and V. E. Van Doren, J. Phys. : Condens. Matter 8 3385 (1996).
- (12) C.-J. Park, S.-G. Lee, Y.-J. Ko, and K. J. Chang, Phys. Rev. B 59, 13501 (1999).
- (13) Y. Cai, S. Wu, R. Xu, and J. Yu, Phys. Rev. B 73,184104 (2006).
- (14) Y. Mori, T. Ikai, and K. Takarabe, Photon Factory Activity Report 20(B), 215 (2003).
- (15) Y. Wang, Phys. Rev. B 61 R11 863 (2000); Y. Wang, D. Chen, and X. Zhang, Phys. Rev. Lett. 84, 3220 (2000); L. Li and Y. Wang, Phys. Rev. B 63, 245108 (2001); Y. Wang, R. Ahuja, and B. Johansson, J. Phys.: Condens. Matter 14, 10895 (2002).
- (16) E. Wasserman, L. Stixrude, and R.E. Cohen, Phys. Rev. B 53, 8296 (1996).
- (17) J. S. Dugdale and D. K. C. MacDonald, Phys. Rev. 89, 832 (1953).
- (18) Los Alamos Shock Hugoniot Data, edited by S. P. Marsh (University of California, Berkeley, 1980).
- (19) T. Jarlborg, E. G. Moroni, and G. Grimvall, Phys. Rev. B 55, 1288 (1997).
- (20) P. Blaha, K. Schwarz, G. Madsen, D. Kvasnicka, and J. Luitz, WIEN2K, http://www.wien2k.at/
- (21) P. Perdew, K. Burke, and M. Ernzerhof, Phys. Rev. Lett. 77, 3865 (1996).
- (22) F. D. Murnaghan, Proc. Natl. Acad. Sci. USA 50, 697 (1944).
- (23) N.N. Sirota, A.M. Kuzmina, and N.S. Orlova, Dokl. Akad. Nauk SSSR 314, 856 (1990).