Magnetic irreversibility and Verwey transition in nano-crystalline bacterial magnetite
Abstract
The magnetic properties of biologically-produced magnetite nanocrystals biomineralized by four different magnetotactic bacteria were compared to those of synthetic magnetite nanocrystals and large, high quality single crystals. The magnetic feature at the Verwey temperature, , was clearly seen in all nanocrystals, although its sharpness depended on the shape of individual nanoparticles and whether or not the particles were arranged in magnetosome chains. The transition was broader in the individual superparamagnetic nanoparticles for which , where is the superparamagnetic blocking temperature. For nanocrystals organized in chains, the effective blocking temperature and the Verwey transition is sharply defined. No correlation between particle size and was found. Furthermore, measurements of suggest that magnetosome chains behave as long magnetic dipoles where the local magnetic field is directed along the chain. This result confirms that time-logarithmic magnetic relaxation is due to the collective (dipolar) nature of the barrier for magnetic moment reorientation.
pacs:
PACS: 75.50.Tt,71.30.+h,75.30.Gw,75.50.GgI Introduction
Magnetite is one of the most studied ferrimagnetic compounds. A sudden change in its thermodynamic properties above K has been the point of interest for many years. In 1926, Parks and Kelley reported a significant heat absorption in magnetite at about K parks . They speculated that this is due to a change in the magnetic subsystem and not in the crystal structure. Thirteen years later, Verwey found that resistivity in magnetite increases about two orders of magnitude upon cooling below K, which he attributed to the order-disorder transition in the electronic subsystem verwey39 . Initially confirmed, later this model was questioned and massive experimental and theoretical effort was mounted to investigate the problem. The literature on the Verwey transition is vast and we refer the reader to several reviews review ; muxworthy ; garcia ; leonov .
Magnetite has an inverse spinel crystal structure, Fe3O4=O4, where sites are coordinated in tetrahedra and sites are coordinated in octahedra. Magnetic order at the and sites is antiparallel resulting in ferrimagnetism with an excess magnetic moment of about per formula. (For each formula unit there are two sites with spin and one site with ). There are eight formula units in the cubic cell (with cell constant 8.4 Å), so each cubic unit cell contributes . Above the Verwey temperature, K, the sites are charge - frustrated so electrons are significantly delocalized, which leads to moderate conductivity of about cm at room temperature. Below , resistivity increases two orders of magnitude, which Verwey explained in terms of charge ordering in the subsystem: Fe2+ ions along and Fe3+ along directions verwey41 (the ”Verwey model”).
In this paper, we discuss the magnetic signature of this transition that appears as a very sharp feature (in good single crystals wang90 ; kakol ) at the Verwey temperature, . Similar to the Verwey transition itself, the physics of this magnetic anomaly is still debatable. It is known that magnetic easy axis changes from the to direction (within 0.2o due to monoclinic distortion) below lima . anisotropy energy increases by an order of magnitude, but the amplitude of the magnetic moment does not change (see Fig. 3).
In recent years, much attention was drawn to nanoparticles of magnetite in an attempt to understand the Verwey transition and the behavior of ferromagnetic nanoparticles. Various, often contradictory results have been reported. Disappearance of the Verwey transition was suggested to occur in nanoparticles grown under a weak (0.25 T) magnetic field wang . Significant reduction of the Verwey transition temperature, , was reported in relatively large nanoparticles ( K in 50 nm nanoparticles) goya . No transition was observed in 7-10 nm nanoparticles and it was even suggested that monoclinic distortion does not develop in such particles goya ; arelaro . On the other hand, direct transport measurements suggest that the transition in resistivity exists above K both in stacked and individual nanoparticles with significant magneto-resistance peak above the gap in the curves markovich . Overall, the matter is complicated by various interpretations of the superparamagnetic regime, superparamagnetic blocking, magnetic relaxation and the difference between single-particle and collective behavior in ferromagnetic nanoparticles. In addition, magnetite, especially in form of nanoparticles, is very sensitive to oxidation by oxygen that might result in stoichiometric changes in the crystals and disturbance of the transition ozdemir .
In this paper, we compare biologically-produced magnetite nanocrystals, which have an almost perfect crystal structure and a well-defined shape and size, to large high-quality crystals wang90 ; kakol as well as to conventional, synthetic magnetite nanoparticles. The goal was to study the Verwey transition in a superparamagnetic system (without magnetic domains) and identify possible influences of particle size, shape and crystalline magnetic anisotropies as well as interparticle interactions on the magnetic signature of the Verwey transition. An additional influencing factor is that the bacterial magnetite crystals are enveloped by a phospholipid membrane that protects the particles from oxidation.
Magnetotaxis in bacteria was first reported in 1975 blakemore and magnetite crystals were identified in these bacteria in 1979 frankel75 . Since then, various properties of different magnetotactic bacteria have been extensively studied krueger ; moskowitz ; meldrum ; penninga ; bazylinski ; frankel ; weiss ; faivre ; pan ; polyakova ; simpson ; kobayashi ; weyland ; bazylinski07 . Most of the studies were performed on the bacteria extracted from natural aquatic habitats. Recently significant progress was achieved in vitro studying the synthesis of magnetite by various bacterial strains bazylinski . This allowed for the targeted modification of magnetic properties and various post-synthesis modifications. For reviews of magnetite formation in prokaryotes as well as on the general ecophysiology of magnetotactic bacteria, see bazylinski ; bazylinski07 . While the majority of prior studies have focused on various aspect of magnetic behavior of different bacterial nanoparticles in terms of the influence of dipolar interactions, size and shape effects, size distribution, orientation of magnetic moments with respect to the magnetosome chains and particles themselves etc., here we use bacterial magnetite to understand how the magnetic signature of the Verwey transition reveals itself in nanoparticles of various sizes and shapes as well as in those self-assembled in magnetosome chains and compare it to that of bulk single crystals. Off-axis electron holography suggests an almost perfect alignment of local magnetic induction along the magnetosome chain above the Verwey temperature, simpson . This direction is also the crystallographical direction of each nanocrystal in the chain. Below , the magnetic induction develops some undulation due to change of the magnetic easy axis to the direction. However, there is still magnetic coherence between the individual particles in the chain. Our results show that the Verwey temperature is not significantly affected in nanoparticles, but its signature is very sensitive to the magnetocrystalline and shape anisotropies that determine the magnetic blocking temperature.
II Experimental
II.1 Growth of magnetotactic bacterial strains
Four magnetotactic bacterial strains were investigated: strain MV-1 (referred to as wild-type (WT) MV-1), cells of which are vibrioid (curved)-to-helical in shape bazylinski88 ; strain MC-1, a marine coccus (roughly spherical) williams06 ; strain MMS-1, with cells that range in shape from vibrioid-to-helical bazylinski88 ; williams06 ; and Magnetospirillum magneticum strain AMB-1, a spirillum that is generally always helical matsunaga . Also examined was a non-magnetotactic mutant strain of MV-1, called MV-1nm-1 dubbels , identical in cellular morphology to (WT) MV-1 but devoid of intracellular magnetite chains.
II.1.1 Strain MV-1 (including mutant)
Cells of strain MV-1 were grown anaerobically in 1.2 liter of liquid media in 2 liter glass bottles. The medium consisted of an artificial sea water (ASW) base bazylinski to which was added (per liter) prior to autoclaving: 0.2 ml 0.2 aqueous resazurin; 5.0 ml modified Wolfe’s mineral elixir frankel ; wolin ; 0.5 g sodium succinate6H2O; 0.2 g sodium acetate3H2O; 0.5 g CasAmino Acids (Difco Laboratories, Detroit, Mich., USA); 0.25 g NH4Cl; and 100 l 0.2 (w/v) aqueous resazurin. The pH of the medium was adjusted to 7.0. Bottles were sealed, and the medium then bubbled with N2 gas for an hour, followed by N2O gas for one hour. (Flow rate of all gases and gas mixtures was approximately 100 ml/min.) The medium was then autoclaved. After autoclaving and cooling, the following solutions were injected into the medium bottles from anaerobic stocks (except for cysteine, which was made fresh and filter sterilized directly into the medium), in order: 1.8 ml of 0.5 M KHPO4 buffer, pH 7.0; 2.0 ml of neutralized 0.43 M cysteineHClH2O; and 2.9 ml of 0.8 M NaHCO3. The medium was allowed to chemically reduce (become colorless) after which 2.9 ml of 0.01 M FeSO4 (dissolved in 0.02 M HCl) and 0.6 ml of vitamin solution frankel ; wolin was added. The medium was inoculated and then incubated at 28 oC for approximately one week at which time cultures had reached the end of exponential growth.
II.1.2 Strains MC-1 and MMS-1
Strains MC-1 and MMS-1 were grown separately in identical liquid media. Cells were grown microaerobically in 850 ml of media in 2 liter glass bottles. The medium consisted of the same ASW base as described above, to which was added (per liter) prior to autoclaving: 5 ml modified Wolfe’s mineral elixir; 0.25 g NH4Cl; and 100 l 0.2 (w/v) aqueous resazurin. The pH of the medium was adjusted to 7.0, and 1.07 g NaHCO3 added. The bottles were then sealed and bubbled with 7.5 CO2 gas in N2 (flow rate about 100 ml/min) passed over heated copper wire to remove O2 for one hour. The bottles were sealed and autoclaved. After autoclaving and cooling, the following solutions were injected into the media bottles from anaerobic stocks (except for cysteine), in order: 1.5 ml of 0.5 M KHPO4 buffer pH 6.9, 1 ml of 0.23 M neutralized cysteineHClH2O; 10 ml of 25 (w/v) Na2S2O5H2O; and 0.4 ml of vitamin solution (as above). The medium was allowed to reduce after which 2.5 ml of 0.01 M FeSO4 (dissolved in 0.02 M HCl) was injected. The medium was inoculated, after which 6 ml of sterile O2 was injected (0.4 of the headspace), and the bottles carefully placed without shaking so as not to disturb the forming O2 gradient, at 25 oC. As soon as bacterial growth was evident (as a scum on the surface of the medium), sterile O2 was injected into the headspace at regular intervals to promote further growth of the cells.
II.1.3 Magnetospirillum magneticum strain AMB-1
Cells of M. magneticum strain AMB-1 were grown anaerobically in 1.2 liter of liquid medium in 2 liter glass bottles. The medium consisted of (per liter): 5 ml modified Wolfe’s mineral elixir; 10 ml Wolfe’s vitamin solution frankel ; 0.68 g KH2PO4; 0.85 g sodium succinate6H2O; 0.58 g sodium tartrate2H2O; 0.083 g sodium acetate3H2O; 225 0.2 (w/v) aqueous resazurin; 0.17 g NaNO3; 0.04 g ascorbic acid; 2 ml of 0.01 M ferric quinate blakemore79 (made by combining 0.19 g quinic acid and 0.27 g of FeCl6H2O in 100 ml distilled, deionized H2O). The pH of the medium was adjusted to 6.75. Bottles were sealed, then the medium sparged with N2 for one hour. The medium was then autoclaved. When cool, the medium was inoculated and the culture incubated at 28 oC.
II.1.4 Harvesting, lysis and drying of bacterial magnetite
Bacterial cells were harvested in the late exponential stage of growth by centrifuging cultures at 6000 rpm for 15 min at 4 oC. Cell suspensions were prepared by resuspending the centrifuged cells in ice-cold, sterile ASW buffered with 10 mM TrisHCl pH 7.0. Cells were lysed by passing cell suspensions twice through a French pressure cell at 124 MPa. For further processing, membranes were removed from magnetosomes by treating them with the strong surfactant, sodium dodecyl sulfate, and the residual magnetite powder was dried under N2 gas in a glovebox at the room temperature. Measurements on powders and powders re-suspended in water produced similar results. Moreover, we remeasured the magnetic properties of whole bacteria, lysed cells and dried cells left in gelatin capsules in a refrigerator for more than three months and did not observe changes in any of their magnetic properties. This served as an indication that particles did not undergo significant oxidation during the storage period.
II.2 Magnetite synthesis in agarose gel
In order to slow the diffusion rates of the reagents to presumably imitate the conditions under which magnetite nanocrystals are formed in magnetotactic bacteria, magnetite synthesis was carried out in agarose gels. All solutions were rendered anaerobic by degassing and sparging with argon prior to their use. FeClH2O (Aldrich) and FeClH2O (Aldrich) were transferred to a reaction flask and dissolved in water to form a solution with a 1:2 molar ratio of ferrous to ferric ions (i.e., M FeCl3 and M FeCl2 solutions, respectively). Synthesis of magnetite nanoparticles was carried out via co-precipitation of FeCl2 and FeCl3 from aqueous solutions. In a sealed 10 ml roundbottom flask, agarose (Fisher) was degassed for several minutes and mixed with one ml of degassed water to prepare a (w/w) solution. The solution was then heated to boiling under a continuous flow of argon. 100 l of the 0.66M FeCl3 and 0.33M FeCl2 solution was added to the flask and then a drop of 0.0016 M of HCl. The mixture was vigorously stirred and sparged with argon for 1 minute. The resulting bright yellow solution was then brought to room temperature, to allow for gelation. After gelation was completed, 1.5 ml of 0.1 M NaOH was added under under argon. A thin black band formed at the gel-NaOH interface indicated formation of magnetite. Nanoparticles of magnetite were allowed to precipitate and increase in size at room temperature in the sealed flask for 7 days. During this time period, the thin black band expanded. An aliquot of gel containing magnetite nanoparticles was taken for magnetic measurements and microscopic examination. The particles were found to be crystalline and powder x-ray diffraction confirmed that magnetite was the main crystalline phase.
II.3 Single crystals of Fe3O4
II.4 Samples and characterization techniques
The cellular morphology of bacterial strains, magnetosome magnetite particle size, and the number of magnetosomes per cell or chain were determined by electron microscopy using a JEOL 1200EX transmission electron microscope (TEM) at an accelerating voltage of 80 kV. To examine cells, a drop of a diluted dense bacterial cell suspension was placed on a carbon-coated holey copper grid. Cell solution was allowed to set for several minutes, after which time the grid was washed with a drop of water, carefully blotted, and dried at room temperature. No staining of the grids was performed.
Magnetization measurements were performed using a Quantum Design MPMS magnetometer. For bacterial cells, after centrifugation, a sample of the bacterial cell suspensions was injected into a waterproof polycarbonate capsule and immediately cooled below the freezing temperature of the liquid.
Physical characteristics of the samples used in our study are summarized in Table I. Here is the Verwey transition temperature determined by the high-temperature feature on the curves obtained on whole cells of bacteria as discussed below. Slope represents the slope of the transition from low- to high-temperature part of the zero-field cooled curve, , which gives an estimate of the sharpness of the magnetic signature at the Verwey transition.
| sample | volume | dimensions | slope | |
| (nm3) | (nm)3 | (K) | K-1 | |
| AMB-1 | cube, | 102 | 0.03 | |
| MC-1 | cube, | 102 | 0.01 | |
| MMS-1 | cube, | 101 | 0.01 | |
| MV-1 | parallelepiped, | 117 | 0.11 | |
| agarose | cube | 104 | n/a | |
| crystal | mm3 | 125 | 0.27 |
III Results
Various magnetic measurements were performed on ferromagnetic nanoparticles produced by different systems. In order to compare different samples, we chose our measurements based on previous studies with various iron oxide nanoparticles prozorov99 ; prozorov04 ; snezhko05 ; cao97 ; cao97a ; cao97b and report measurements of and dependencies as well as magnetic relaxation, , for a fixed set of parameters as described in detail in the following sections.
III.1 Temperature dependence of magnetization
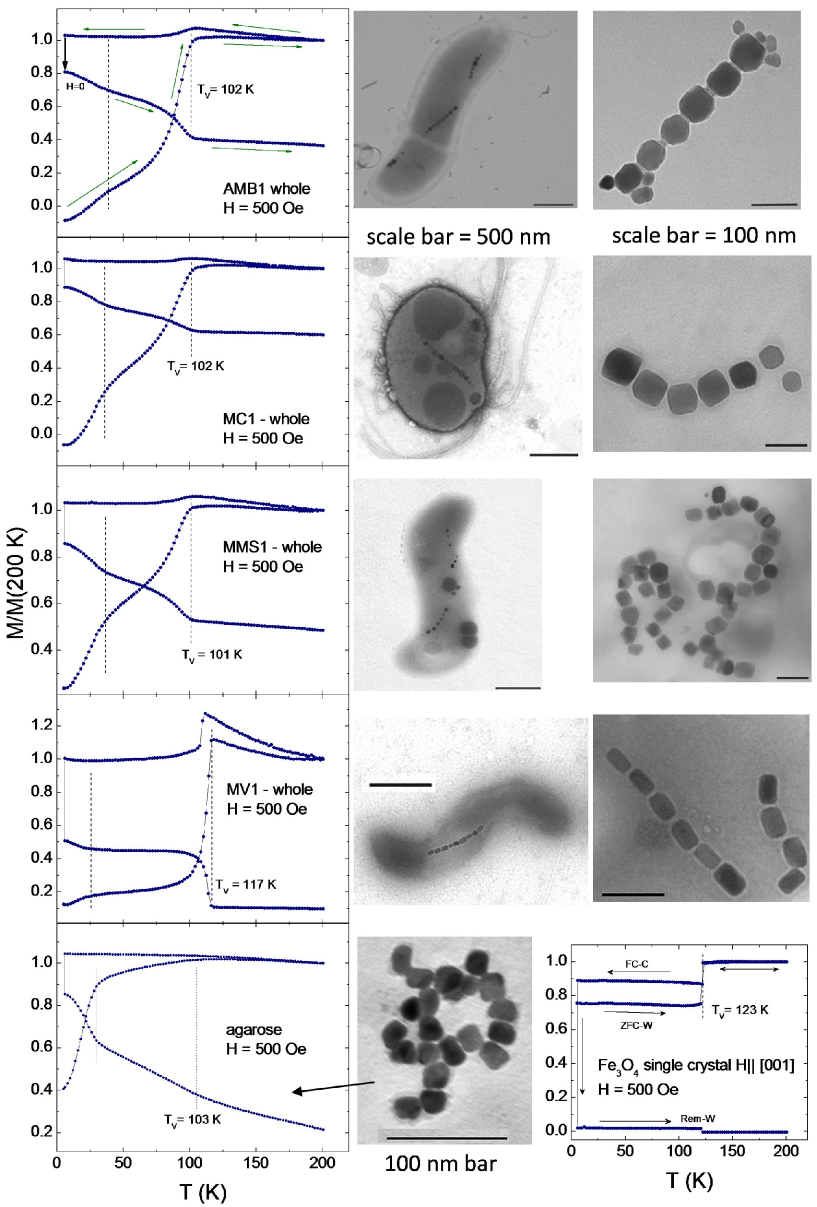
After samples were cooled in a zero magnetic field to K (zero-field cooling, ZFC), a magnetic field was applied and the temperature dependent magnetization was measured upon warming (ZFC-W process). Although we tested a range of field strengths, we report the data for Oe, which is not sufficient to saturate the samples, but is large enough to magnetize the nanoparticles and reveal the Verwey transition and blocking temperature. After reaching temperatures well above the Verwey transition ( K), but still below the melting point ( K in our experiments), the system was cooled down without tuning the magnetic field off (field cooling, FC-C process). Finally, after reaching K, the magnetic field was turned off and was measured again upon warming. This is annealing of the metastable remanent magnetization (Rem-W) and it provides important information about the barriers and anisotropy in the system. It should be noted that we also measured a variety of other magnetic parameters, including the induced orientation of particles by a magnetic field when samples were warmed above the melting point and refrozen in a magnetic field. The results were consistent with the conclusions of this paper.
Figure 1 shows ZFC-W, FC-C and Rem-W measurements in four samples containing nanoparticles of magnetite and in a high quality synthetic single magnetite crystal for comparison. The top four frames show data for biological magnetite nanoparticles in frozen magnetotactic bacterial cells of strains AMB-1, MC-1, MMS-1 and MV-1, respectively. The images on the right represent TEM images of the corresponding bacteria and magnetite particles in magnetosome chains that apparently remained stable after cell lysis. The lower left frame of Fig. 1 shows data for synthetic magnetite nanoparticles obtained by slow co-precipitation in agarose gel. Finally, the lower right image shows similar data measured in a large synthetic crystal of Fe3O4. Clearly, the magnetic signature of the Verwey transition is seen as a sharp change in the magnetic moment at in all bacterial samples as well as in the single crystal. Some broadening of the signal for MC-1 and MMS-1 could still be due to partial oxidation of magnetite ozdemir , but most likely is due to a reduced barrier for magnetic moment reorientation. Apparently, the difference between FC and ZFC below follows from large magnetic irreversibility below the transition due to larger magnetocrystalline anisotropy. In addition, larger remanence can be because of pinning of the magnetic easy axis in a low-temperature monoclinic phase along the direction closest to the applied field. The transition temperature itself is lower in magnetite from magnetotactic bacteria when compared to the single crystal, except for strain MV-1 where it is almost the same. On the other hand, volume of the magnetite nanocrystals in MV-1 is the smallest (see Table I), so this implies that size reduction itself does not cause a shift or broadening of the transition temperature as was reported for synthetic magnetite nanoparticles lima ; yang .
One of the best ways to reveal the magnetic signature of the Verwey transition is to anneal the metastable remanent state by cooling samples down in a magnetic field and turning it off at low temperature (5 K in our case). In this case, the thermal energy, , only competes with the dipolar collective barrier and magnetocrystalline anisotropy (no Zeeman term present). Therefore, a change in anisotropy at is well reflected in the measurements. This is known as (a variation of) the Moskowitz test moskowitz which has been used to determine whether magnetite particles from magnetotactic bacteria are present in sediments and water samples.
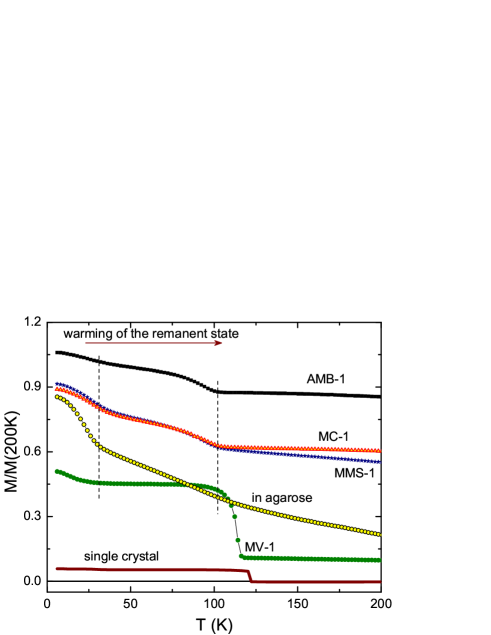
Figure 2 shows results of such measurements from four bacterial magnetite samples, synthetic nano-magnetite particles in agarose and in a large single magnetite crystal. Whereas the single crystal and nano-magnetite from strain MV-1 show very sharp transitions, the rest of the bacterial magnetite particles show somewhat broader transitions. Importantly, the transition is recognizable in the synthetic magnetite nanoparticles prepared in agarose gel. We interpret these data in terms of the competition between the magnetic easy axis and shape anisotropy. In strain MV-1, which has most elongated particles, reorientation and alignment of the magnetic moments of individual nanocrystals is greatly assisted by shape anisotropy. In addition, there are two characteristic regions notable in the plots shown in Fig. 2. The first is roughly up to K and the second is between K and (which varies between K and K for different samples). The low temperature part, which is absent in the single crystal, is most likely related to dipolar interparticle interactions that lead to enhancement of the collective barrier for magnetic moment reorientation prozorov99 ; prozorov04 .
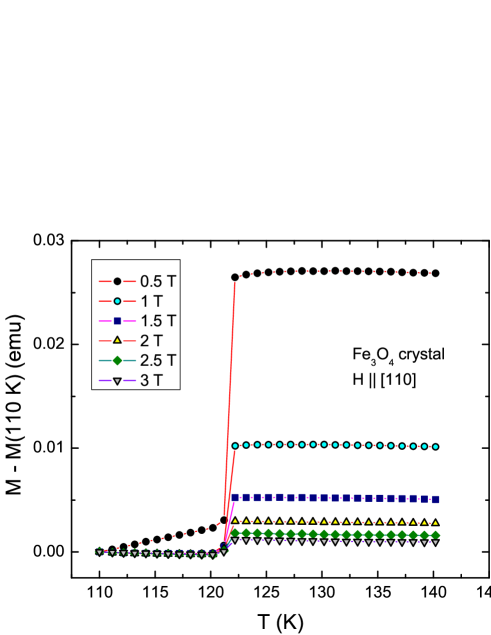
Another aspect of temperature-dependent magnetization is the absolute value of the magnetic moment across the Verwey transition. Figure 3 shows a set of transition curves in a single crystal measured in different fields. The difference between and appears to diminish at higher fields that saturate the magnetic moment. This means that the total magnetic moment per unit cell remains unchanged and all dramatic changes in magnetization at lower fields come either from re-orientation of the moments away from the field axis or a significant change in the magnetic domain structure.
III.1.1 Evolution of magnetization in MV-1 magnetite after different treatments.
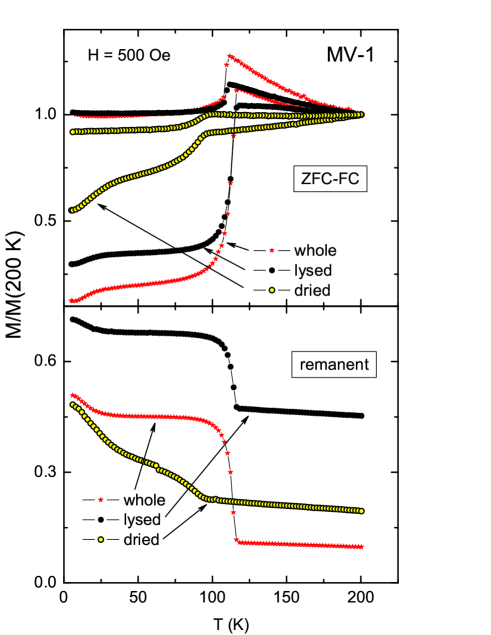
Now we discuss in detail the magnetic measurements obtained in MV-1 magnetite crystals. Magnetite crystals from MV-1 strain have the smallest volume but are the most elongated of those studied. As evident from Fig. 4, both whole and lysed bacterial cells show very pronounced step-like feature at . The top frame of Fig. 4, shows ZFC-W and FC-C measurements, whereas the lower frame shows REM-W data. Remanent magnetization is larger in lysed bacteria due to enhanced interchain interaction (chains are closer to each other). In contrast to the whole and lysed nanoparticles, dried powder that contains disassembled chains (but still preserved randomly-oriented nanocrystals) show significant smearing of the magnetic signature at the Verwey transition. Importantly, TEM imaging suggests that individual nanocrystals remain intact and undamaged after the chain has been disrupted. These results provide the strongest evidence for the importance of the collective long-range anisotropy in determining the magnetic response. The chain acts as a single dipole with a very large anisotropy with the effective blocking temperature much larger than the Verwey temperature. The anisotropy of individual nanoparticles in a disassembled chain is not sufficient to prevent thermal randomization and the magnetic feature at is significantly smeared.
III.2 Magnetization loops
An important difference between large single magnetite crystals and a collection of magnetite nanoparticles is revealed in the magnetization loops measured at low temperatures.
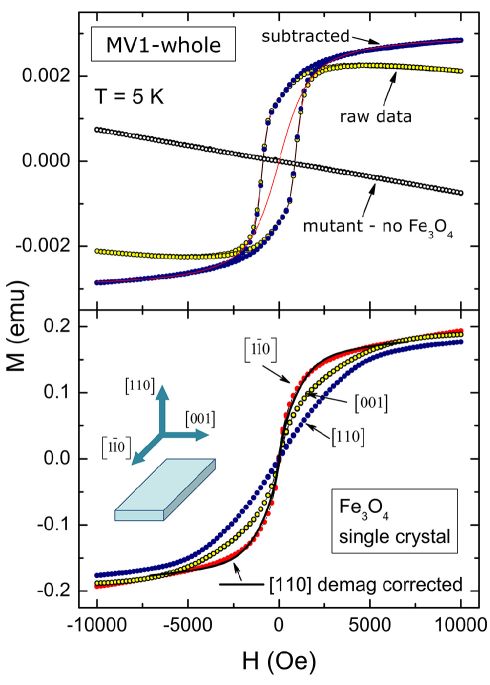
The top frame of Fig. 5 shows the curve obtained from a frozen cell suspension of strain MV-1 (see TEM image in Fig. 1). The diamagnetic background comes from the organic and other material that make up the bacterial cell (everything except the magnetite) which can be subtracted from measurement of the wild-type (normal) strain by subtracting the measurement from a non-magnetotactic mutant of MV-1 which does not produce magnetite dubbels . The subtraction results in a regular magnetization curve the reversible part of which is well-described by the Langevin function (solid curve, red color online) as expected for superparamagnetic material. The lower frame shows measurements from the large single magnetite crystal. The magnetization behaves exactly as expected for a soft ferromagnet aharoni - even simple correction for demagnetization, , works well as shown for the curves measured in two crystallographically identical orientations, and . Schematics of the measured crystal and its axes is shown in the inset. First, a striking difference between the single crystals and the nanoparticles is the total absence of magnetic hysteresis in all orientations. This can be understood in terms of pinning-free magnetic domains in the single crystal. With the domains, remagnetization occurs by motion of the domain walls. The domains are absent in (monodomain) nanoparticles and their remagnetization involves magnetic moment rotation over a significant energy barrier and this results in magnetic hysteresis.
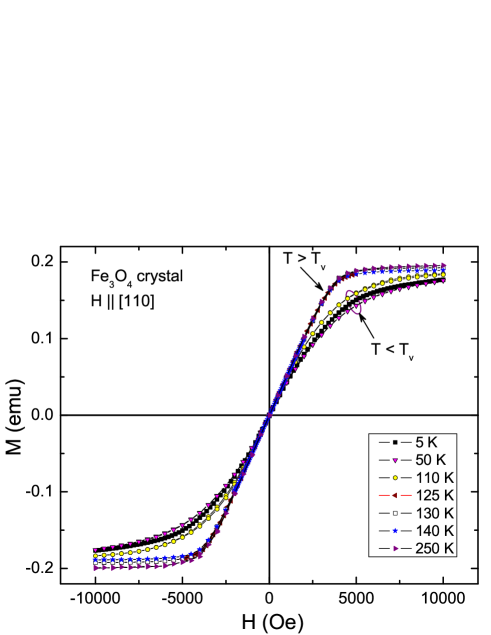
Another important observation is shown in Fig. 6 which shows three loops measured in a Fe3O4 single crystal. Clearly, there is no detectable magnetic hysteresis at all temperatures. Furthermore, there is a significant difference in the initial susceptibility, , below and above , but the saturation magnetization is not at all different. In addition, the initial magnetic susceptibility is larger at higher temperatures indicating that it is governed by the temperature-dependent magnetic anisotropy rather than the Brillouin variable, , which increases with a decrease in temperature. This means that the main magnetic effect at the Verwey transition is due to a significant increase of magnetic anisotropy upon cooling through and not due to a change in the magnetic moment per unit cell.
III.2.1 MV-1 - hysteresis loops
It is possible to gain further insight into the physics of nanophase magnetite by comparing measurements performed on the same strain of magnetotactic bacteria treated differently. For example, whole, intact bacterial cells can be directly compared to lysed cells whose cell membranes are destroyed and only magnetosome chains containing individual Fe3O4 nanocrystals remain. (Magnetosome membranes are still present even when cells are lysed and this keeps chains intact). Depending on how cells are lysed, chains may be disrupted and become shorter. The next step is to eliminate all organic material which would leave only individual magnetite nanocrystals.
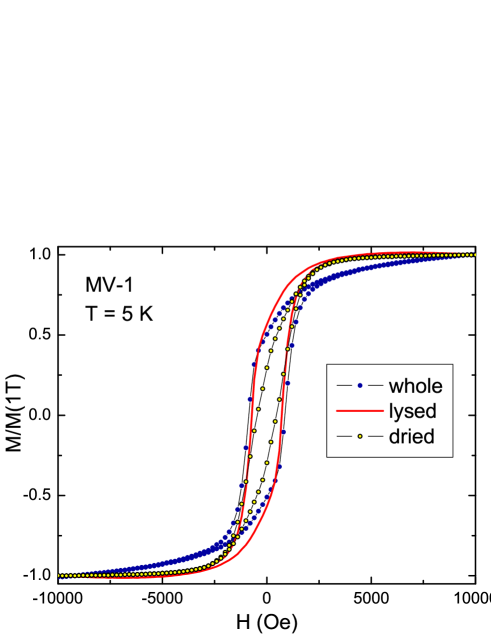
Figure 7 shows the result of this comparison. Clearly, there is a reduction of hysteresis in the freeze-dried cells. The saturation field, however, is similar in lysed and whole samples. This leads to the important conclusion that a significant part of the magnetic hysteresis is caused by long-range (dipolar) interchain interactions and the shape anisotropy contributions of the entire long chains and not by particle agglomeration or random dipolar interactions.
III.3 Magnetic relaxation
Significant magnetic relaxation is usually observed in assemblies of magnetic nanoparticles below the blocking temperature prozorov99 ; prozorov04 . It is believed that this relaxation is a result of Arrhenius thermal activation, where is the barrier for magnetic moment re-orientation. In a simple single-particle barrier, depends only on magnetocrystalline anisotropy and the strength of the applied field, so the relaxation should be time-exponential. However, in assemblies of nanoparticles, relaxation is always time-logarithmic, which we show is due to the collective nature of the barrier that now depends on the total magnetic moment, prozorov99 ; prozorov04 . Alternative theories invoke size (hence barrier) distributions that supposedly lead to stretched exponential relaxation. Magnetotactic bacterial nano-crystalline magnetite provides useful insight into the problem because their size distribution is very narrow and their crystal structure is perfect (that excludes barrier variations due to the amorphous nature of the synthetic nanoparticles).
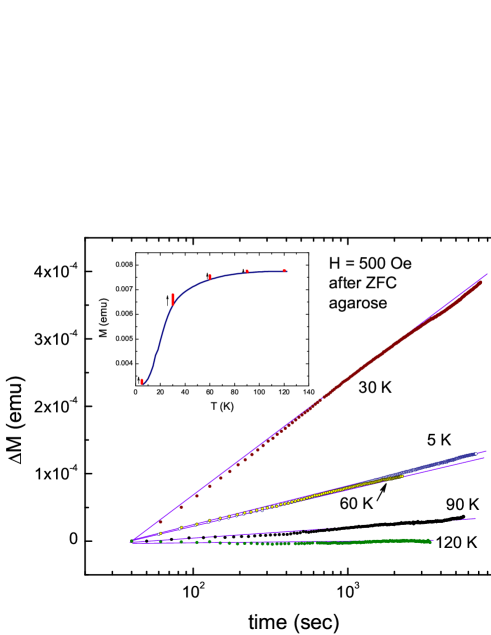
Figure 8 shows magnetic relaxation in synthetic magnetite nanoparticles in agarose gel. Each curve is obtained by measuring versus time after a magnetic field of Oe was applied after cooling in a zero field to and K. The inset shows the same relaxation curves plotted in coordinates. Arrows indicate the direction of the increase in time. Very similar relaxation curves are observed in frozen ferrofluids prozorov04 and dry powders prozorov99 . Our previous work has shown, both experimentally and theoretically, that obvious time-logarithmic dependence of magnetization is due to the collective barrier for magnetic relaxation. Single-particle barrier does not depend on the total magnetic moment (of the surroundings) and results in time-exponential relaxation. With dipolar interactions in the system, the barrier is determined within correlation volume that depends explicitly on the total magnetic moment. It can be quite generally shown that this is sufficient to produce time-logarithmic magnetic relaxation prozorov99 ; prozorov04 .
III.3.1 MV-1 - magnetic relaxation
If our interpretation of the and measurements (that there is a very large magnetic anisotropy in the magnetite nanoparticle chains) is correct, we should not observe significant magnetic dynamics. However, when chains are disrupted, we should observe significant magnetic relaxation similar to that shown in Fig. 8.
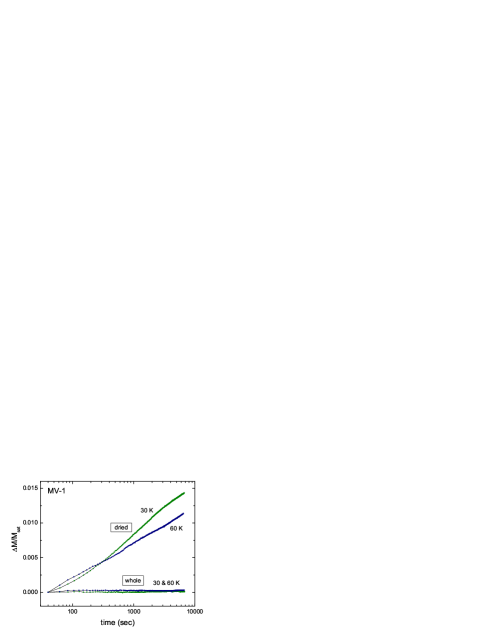
Figure 9 shows magnetic relaxation curves measured in magnetite nanocrystals produced by strain MV-1. The two lower lines are for whole frozen bacterial cells, whereas the upper lines are for freeze-dried bacteria cells where the chains are disrupted. Particle morphology was preserved as determined by TEM imaging. The curves were normalized by the saturation magnetization (in a Tesla field) at K. There is a clear difference between magnetic relaxation trends in these cases. It should be noted that we attempted to measure magnetic relaxation in all our specimens with the same result - no noticeable magnetic relaxation is observed in magnetic nanoparticles organized in magnetosome chains (in whole and lysed cells) and significant relaxation is seen in dried cells where chains were disrupted. This suggests that single-particle barrier or, as previously believed, a distribution of sizes (that would lead to so-called stretched exponential behavior), cannot explain the observed time logarithmic relaxation. Instead, random long-range dipolar interparticle interactions that lead to magnetic moment - dependent collective barrier explain the phenomena prozorov99 ; prozorov04 .
IV Discussion
Our results indicate that,
-
1.
A sharp magnetic signature at the Verwey transition is clearly present in magnetite nanocrystals organized in chains. However, it is significantly smeared in separated nanocrystals.
-
2.
Measurements of magnetic relaxation suggest that chains of magnetosomes behave as very large magnetic dipoles with the intra-chain magnetic induction aligned along their axis that corresponds to the direction.
-
3.
Randomly-arranged nanoparticles (not in chains) show a pronounced time-logarithmic magnetic relaxation as expected from the collective nature of the barrier for reorientation of the magnetic moment.
-
4.
Although the degree of crystallinity in magnetite nanoparticles certainly plays a role (no magnetic signature at was found in ferritin-templated amorphous nanoparticles tprozorov ), the Verwey transition remains smeared even in perfect, but uncorrelated nanoparticles.
-
5.
The magnetic signature of the Verwey transition does not correlate with the mean particle size (or volume) at least in the 30-50 nm size range. Instead, it seems to depend greatly on particle shape and chain anisotropy.
We explain these observations as follows. At the Verwey transition, the magnetic moment does not change in magnitude, but changes direction due to the switching of the magnetic easy axis. In bulk crystals, magnetocrystalline anisotropy is still much larger than thermal activation energy, , so when switching of the magnetic moment occurs, it appears as an abrupt change in the magnetization (always measured along some chosen axis, so it always reflects the rotation). In contrast, in individual nanoparticles, magnetic fluctuations are strong enough to overcome the Neél barrier, (where is magnetic anisotropy and is particle volume), and randomize the magnetic moment (spatially and temporally). In this case, reorientation cannot be considered because the magnetic moment is continually fluctuating. As a result, only a very small and diffuse change is observed due to the finite distribution of particle barriers and directions. Nanoparticles organized in chains act as long dipoles with enhanced effective anisotropy along the chain and thermal fluctuations are insufficient to overcome this barrier. Phenomenologically, it is to say that the Verwey temperature is larger than the blocking temperature of individual nanoparticles, , but less than the effective blocking temperature of the chains, . This is an important conclusion, because it implies that the mechanism of the Verwey transition does not depend on any particular orientation of the internal magnetic field with respect to the crystal structure (in addition, the direction is degenerate with respect to any of the principal cubic axes along which charge ordering may occur). On the other hand, it also implies that the Verwey transition occurs in nanoparticles at temperatures close to bulk values that rules out proposed long-range magneto-elastic coupling leading to the disappearance of monoclinic distortion and the Verwey transition altogether.
Acknowledgements.
We thank B. M. Moskowitz, R. B. Frankel and R. J. McQueeney for useful discussions and suggestions. We thank J. Honig for careful reading of the manuscript, discussions and providing high-quality Fe3O4 single crystals. R.P. thanks his cat Physya for support. Work at the Ames Laboratory was supported by the Department of Energy-Basic Energy Sciences under Contract No. DE-AC02-07CH11358. R. P. acknowledges support from the NSF grant number DMR-06-03841 and the Alfred P. Sloan Foundation. D.A.B. and T.J.W. acknowledge support from the NSF grant number EAR-0311950.References
- (1) G. S. Parks and K. K. Kelley, J. Phys. Chem. 30, 47 (1926).
- (2) E. J. W. Verwey, Nature (London, United Kingdom) 144, 327 (1939).
- (3) (special volume on the Verwey transition) Philos. Mag. B 42, 325 (1980).
- (4) A. R. Muxworthy and E. McClelland, Geophysical Journal International 140, 101 (2000).
- (5) J. García and G. Subías, Journal of Physics: Condensed Matter 16, R145 (2004).
- (6) I. Leonov and A. N. Yaresko, Journal of Physics: Condensed Matter 19, 021001 (2007).
- (7) E. J. Verwey, and P. W. Haayman, Physica 9, 979 (1941).
- (8) E. Lima, Jr., A. L. Brandl, A. D. Arelaro, and G. F. Goya, J. Appl. Phys. 99, 083908 (2006).
- (9) P. Wang, M. W. Wittenauer, D. J. Buttrey, R. W. Choi, P. Metcalf, Z. Kakol and J. M. Honig, J. Crystal Growth 104, 285 (1990).
- (10) Z. Kakol and J. M. Honig, Phys. Rev. B 40, 9090 (1989).
- (11) J. Wang, Q. Chen, X. Li, L. Shi, Z. Peng, and C. Zeng, Chemical Physics Letters 390, 55 (2004).
- (12) G. F. Goya, T. S. Berquo, F. C. Fonseca, and M. P. Morales, Journal of Applied Physics 94, 3520 (2003).
- (13) A. D. Arelaro, A. L. Brandl, E. Lima, Jr., L. F. Gamarra, G. E. S. Brito, W. M. Pontuschka, and G. F. Goya, Journal of Applied Physics 97, 10J316 (2005).
- (14) G. Markovich, T. Fried, P. Poddar, A. Sharoni, D. Katz, T. Wizansky, and O. Millo, MRS Symposium Proceedings 746, 151 (2003).
- (15) R. P. Blakemore, Science 190, 377 (1975).
- (16) R. B. Frankel, R. P. Blakemore, R. S. Wolfe, Science 203, 1355 (1979).
- (17) S. Krueger, G. J. Olson, J. J. Rhyne, R. P. Blakemore, Y. A. Gorby, and N. Blakemore, J. Mag. Mag. Mater. 82, 17 (1989).
- (18) B. M. Moskowitz, R. B. Frankel, D. A. Bazylinski, H. W. Jannasch, and D. R. Lovley, Geophys. Res. Lett. 16, 665 (1989).
- (19) F. C. Meldrum, S. Mann, B. R. Heywood, R. B. Frankel, and D. A. Bazylinski, Proceedings: Biological Sciences 251, 237 (1993).
- (20) I. Penninga, H. de Waard, B. M. Moskowitz, D. A. Bazylinski, and R. B. Frankel, J. Mag. Mag. Mater. 149, 279 (1995).
- (21) D. A. Bazylinski, and R. B. Frankel, Nature Reviews Microbiology 2, 217 (2004).
- (22) R. B. Frankel, D. A. Bazylinski, M. Johnson, and B. L. Taylor, Biophys. J. 73, 994 (1997).
- (23) E. A. Wolin, M. J. Wolin and R. S. Wolfe, J. Biol. Chem. 238, 2882 (1963).
- (24) B. P. Weiss, S. S. Kim, J. L. Kirschvink, R. E. Kopp, M. Sankaran, A. Kobayashi, and A. Komeili, Earth and Planetary Science Letters 224, 73 (2004).
- (25) D. Faivre, N. Menguy, F. Guyot, O. Lopez, and P. Zuddas, American Mineralogist 90, 1793 (2005).
- (26) Y. Pan, N. Petersen, M. Winklhofer, A. F. Davila, Q. Liu, T. Frederichs, M. Hanzlik, and R. Zhu, Earth and Planetary Science Letters 237, 311 (2005).
- (27) T. Polyakova, and V. Zablotskii, Journal of Magnetism and Magnetic Materials 293, 365 (2005).
- (28) E. T. Simpson, T. Kasama, M. Posfai, P. R. Buseck, R. J. Harrison, and R. E. Dunin-Borkowski, Journal of Physics: Conference Series 17, 108 (2005).
- (29) Ö. Özdemir, D.J. Dunlop, B. M. Moskowitz, Geophys. Res. Lett. 20, 1671 (1993).
- (30) A. Kobayashi, J. L. Kirschvink, C. Z. Nash, R. E. Kopp, D. A. Sauer, L. E. Bertani, W. F. Voorhout, and T. Taguchi, Earth and Planetary Science Letters 245, 538 (2006).
- (31) M. Weyland, T. J. V. Yates, R. E. Dunin-Borkowski, L. Laffont, and P. A. Midgley, Scripta Materialia 55, 29 (2006).
- (32) D. A. Bazylinski, and T. J. Williams in ”Magnetoreception and Magnetosomes in Bacteria”, edited by D. Schüler (Springer-Verlag, Berlin, Heidelberg, 2007), pp. 37-75.
- (33) D. A. Bazylinski, R. B. Frankel, and H. W. Jannasch, Nature 334, 518 (1988).
- (34) T. J. Williams, C. L. Zhang, J. H. Scott, and D. A. Bazylinski, Appl. Environ. Microbiol. 72, 1322 (2006).
- (35) T. Matsunaga, T. Sakaguchi, and F. Tadokoro, Appl. Microbiol. Biotechnol. 35, 651 (1991).
- (36) B. L. Dubbels, A. A. DiSpirito, J. D. Morton, J. D. Semrau, J. N. Neto, and D. A. Bazylinski, Microbiology 150, 2931 (2004).
- (37) R. P. Blakemore, D. Maratea and R. S. Wolfe, J Bacteriol 140, 720 (1979).
- (38) R. Prozorov, Y. Yeshurun, T. Prozorov, and A. Gedanken, Phys. Rev. B 59, 6956 (1999).
- (39) R. Prozorov and T. Prozorov, J. Mag. Mag. Mater. 281, 312 (2004).
- (40) A. Aharoni, ”Introduction to the Theory of Ferromagnetism” (Oxford University Press, 2001).
- (41) A. Snezhko, T. Prozorov, and R. Prozorov, Phys. Rev. B 71, 024527 (2005).
- (42) X. Cao, R. Prozorov, Y. Koltypin, G. Kataby, I. Felner, and A. Gedanken, J. Mater. Res. 12, 402 (1997).
- (43) X. Cao, Y. Koltypin, R. Prozorov, G. Kataby, and A. Gedanken, J. Mater. Chem. 7, 2447 (1997).
- (44) X. Cao, Y. Koltypin, G. Katabi, R. Prozorov, I. Felner, and A. Gedanken, J. Mater. Chem. 7, 1007 (1997).
- (45) J. B. Yang, X. D. Zhou, W. B. Yelon, W. J. James, Q. Cai, K. V. Gopalakrishnan, S. K. Malik, X. C. Sun, and D. E. Nikles, J. Appl. Phys. 95, 7540 (2004).
- (46) T. Prozorov, S. K. Mallapragada, B. Narasimhan, L. Wang, P. Palo, M. Nilsen-Hamilton, T. J. Williams, D. A. Bazylinski, R. Prozorov and P. C. Canfield, Adv. Funct. Mater. 17, 951 (2007).