Exact diagonalization study of Mott transition in the Hubbard model on an anisotropic triangular lattice
Abstract
We study Mott transition in the two-dimensional Hubbard model on an anisotropic triangular lattice. We use the Lanczos exact diagonalization of finite-size clusters up to eighteen sites, and calculate Drude weight, charge gap, double occupancy and spin structure factor. We average these physical quantities over twisted boundary conditions in order to reduce finite-size effects. We find a signature of the Mott transition in the dependence of the Drude weight and/or charge gap on the system size. We also examine the possibility of antiferromagnetic order from the spin structure factor. Combining these information, we propose a ground-state phase diagram which has a nonmagnetic insulating phase between a metallic phase and an insulating phase with antiferromagnetic order. Finally, we compare our results with those reported in the previous theoretical studies, and discuss the possibility of an unconventional insulating state.
1 Introduction
Mott transition is a metal-insulator phase transition driven by strong Coulomb repulsion[1] and has been a central theme in physics of strongly correlated electrons.[2] A Mott insulator is a featureless insulating state with an odd number of electrons per unit cell and can be distinguished from a band insulator which has an even number of electrons per unit cell. In most cases, however, would-be Mott insulators show some (translational) symmetry breaking at low temperatures, resulting in a change in the size of the unit cell. For example, the Hubbard model and its generalizations defined on a bipartite lattice show antiferromagnetic order in their insulating phase at half filling (one electron per site). In the narrow definition of a Mott insulator, such insulating states are not Mott insulators but rather band insulators, as the unit cell is doubled and contains two electrons. It is hard to find a true Mott insulator without any symmetry breaking in nature.
A promising route to a Mott insulator is to suppress symmetry breaking by introducing strong geometrical frustration into lattice structure. A series of layered organic conductors, -(ET)2X, have recently attracted much attention as materials that may realize this route.[3, 4] The electronic properties of these compounds are determined by conducting carriers moving on an anisotropic triangular lattice, which is geometrically frustrated; the degree of frustration is controlled by the choice of the anion X. Furthermore the strength of electron correlation can be easily tuned by applying pressure.
The -(ET)2X compounds show various intriguing properties. For example, -(ET)2Cu[N(CN)2]Cl shows a first-order Mott phase transition without any symmetry breaking at finite temperatures under pressure. In the vicinity of the critical end point of the first-order transition line, the conductivity was found to show an unconventional critical scaling behavior,[5] which is different from the Ising universality class expected to describe the Mott criticality in higher (than two) dimensions.[6, 7, 8] Another compound -(ET)2Cu2(CN)3, whose lattice structure is close to the isotropic triangular lattice, has an insulating phase at ambient pressure showing no magnetic order down to very low temperature, mK.[9, 10, 11] Some suspect that this insulating phase is a Mott insulator with a spin-liquid ground state. When pressure is applied, the Mott insulating state undergoes a phase transition to a superconducting state.
A minimal theoretical model that contains essential ingredients for describing the electronic properties of these organic compounds is a single-band Hubbard model on an anisotropic triangular lattice at half filling.[12] It is thus important to understand the Mott transition and the resulting Mott insulating state in this and related models. Indeed there have been several theoretical studies along this line. In particular, the dynamical mean field theory (DMFT) has been successfully applied to the study of the Mott transition in the Hubbard model at finite temperatures. Among other things it has predicted that the Mott transition at the critical end point should belong to the Ising universality class.[6] However, the DMFT is an approach which is justified only in large spatial dimensions, and it cannot be directly applied to the two-dimensional case. Some extensions of the DMFT to two dimensions, such as a cellular DMFT, have also been applied to this model and led to results suggesting the existence of a first- or second-order transition without symmetry breaking at finite temperatures.[13, 14, 15] However, it is not clear whether spatial correlations are properly taken into account in this type of approach. Other theoretical approaches to finite-temperature Mott transitions include a phenomenological effective theory[16] and a mean-field theory[17], which pointed out an important role played by a marginal quantum critical point in the unconventional critical behavior near the critical end point in -(ET)2Cu[N(CN)2]Cl.
The possibilities of the ground state being a non-magnetic insulating state and a superconducting state have been studied for the Hubbard model on an anisotropic triangular lattice using many different approaches such as the fluctuation exchange approximation,[18, 19] a U(1) gauge theory,[20] variational Monte Carlo (VMC) studies[21, 22] and the cellular DMFT.[23] Related models were also discussed, for example, in the variational study of the Heisenberg spin model with ring exchange coupling[24] and the resonating-valence-bond mean field theory for the Hubbard-Heisenberg model.[25, 26] These studies, however, often rely on some uncontrolled approximations whose validity is uncertain when both the strong correlation and the geometrical frustration are important.
For the half-filled Hubbard model with geometrical frustration, choices are quite limited of numerical approaches that can both treat correlations in real space and work at zero temperature (or low temperatures). For example, the DMFT and its cluster extensions do not fully treat the correlations in the real space, as we have mentioned. Monte Carlo simulations are susceptible to the infamous negative sign problem, and work only at high temperatures. At this stage, available numerical methods that satisfy the required conditions are the path integral renormalization group (PIRG) method[27, 28] and the exact diagonalization method.
Imada and his coworkers have developed the PIRG method and applied it to study the Hubbard model on two-dimensional frustrated lattices. In the ground-state phase diagram of the half-filled Hubbard model on an anisotropic triangular lattice, they found a narrow region of a non-magnetic insulating phase between a paramagnetic metal and an antiferromagnetic insulator, if the frustration is substantial.[29] In the non-magnetic insulating state, no obvious symmetry breaking pattern was observed, and energy spectrum has highly degenerate low-lying excitations as in the Fermi liquid, which could be attributed to the presence of a spinon Fermi surface.[24, 20] The transition from the metallic phase to the non-magnetic insulator appears to be first order although the discontinuity becomes weaker for strong frustration. In order to confirm and better understand these interesting behaviors, a complementary study using another unbiased technique is needed.
To this end, we use the exact diagonalization method to study the ground-state properties of the two-dimensional Hubbard model on the anisotropic triangular lattice at half filling. The method treats correlation effects in an unbiased way with high precision, although the calculation is limited to small systems. We examine dependence on boundary conditions (BCs) for finite-size clusters, and demonstrate that averaging over the twisted BCs is an efficient tool to reduce the finite-size effects. We calculate the Drude weight, which was not calculated in the previous works, to monitor the metal-insulator transition directly. We also compute the charge gap, the double occupancy and the spin structure factor to elucidate the phase diagram and the nature of the transitions. The results are discussed in comparison with those in the previous works.
This paper is organized as follows. In §2, we define the model and finite-size clusters to be studied numerically. The physical quantities signalling the Mott transition are also introduced. In §3, we discuss their dependences on BCs in the finite-size clusters, and demonstrate that averaging over the twisted BCs leads to substantial reduction of the finite-size effects. In §4, we present numerical results on the ground-state properties. The numerical results and their implications to the phase diagram are discussed in §5. We conclude with a brief summary in §6.
2 Model and Method
We study the ground-state properties of the Hubbard model on an anisotropic triangular lattice at half filling. Its Hamiltonian is given by
| (1) |
where is the annihilation (creation) operator for electrons of spin on the site , and is the number operator. The model is defined on the anisotropic triangular lattice with the hopping integrals as shown in Fig. 1. We take as the energy unit and fix the electron density at half filling, one electron per site on average.

We consider finite-size clusters on the triangular lattice shown in Fig. 2. To impose a twisted BC for each cluster, we have introduced the phase factor,
| (2) |
where is the vector connecting from the site to the site , and in terms of the reciprocal vectors and , which satisfy the orthonormal relations with the vectors and defining the cluster (Fig. 2). The “flux” dictates the BC along the direction parallel to the vectors and . For example, represents periodic BCs in both directions, and periodic BC in the direction and anti-periodic BC in the direction, respectively. Any nonvanishing flux leads to a twisted BC (, ).
We apply the exact diagonalization method based on the Lanczos technique to finite-size clusters up to 18 sites shown in Fig. 2. Since the model has translational symmetry, each energy eigenstate is classified according to its total momentum . For a given , we numerically obtain a ground-state wave function of a finite-size cluster for several values of and . To save the CPU time, for 16-site and 18-site clusters, lowest-energy states are computed at some relevant momenta only, such as , , and the momentum of the ground state at . These wave functions on finite-size clusters depend on . As we discuss in the next section, the -dependence can be used for reducing finite-size effects. Here let us assume for the moment that is fixed at a certain value.

To study the metal-insulator transition at zero temperature, we compute the Drude weight and the charge gap. The Drude weight is given by[30, 31, 32]
| (3) |
with , () and being the number of sites. Here, and are the energy eigenvalues of the ground state and of the -th excited state , respectively. We use the second equation in eq. (3) to calculate the Drude weight, i.e., the second derivative of the ground-state energy with respect to the flux . We define the dimensionless Drude weight .[33]
The charge gap is defined as a change in the chemical potential when electrons are added to or subtracted from the system,
| (4) |
where
| (5) | ||||
| (6) |
Here is the ground-state energy with electrons, and the number of electrons is changed by two to conserve the component of the total spin.
We also calculate the double occupancy,
| (7) |
which is believed to be related with the order parameter of the Mott transition. Here and henceforth is understood as the average value of the operator in the lowest-energy state for the given , .
To study the magnetic properties, we calculate the spin structure factor,
| (8) |
We note that , , , and are functions of .
3 Averaging over twisted boundary conditions
In order to extract intrinsic properties of a bulk system, we need to extrapolate numerical results of finite-size clusters to the thermodynamic limit . In practice, for small clusters that can be dealt with the exact diagonalization technique, the numerical results have large finite-size effects and strong dependence on the BC or . Understanding this -dependence is an essential step towards systematic analysis of finite-size effects and extrapolation to the thermodynamic limit.[34]
To illustrate the problem we are facing, we first show -dependence of the lowest energies of and at and for on the 16-site cluster in Fig. 3. We clearly see that at [Fig. 3(a)], the ground-state momentum changes from to and vice versa as varies. This implies that the states with different momenta become degenerate ground states in the thermodynamic limit, which is a typical feature of a Fermi liquid (metal). On the other hand, as shown in Fig. 3(b), there is no momentum change in the ground state at , indicating the insulating behavior in the thermodynamic limit where a ground state is singled out with opening of a gap.[35] A similar behavior is seen already in the smallest 8-site cluster.


Typically, there are three different ways to treat the BCs in the finite-size analysis: (i) fixing the BC,[36] i.e., fixing at a priori chosen value, for example, at ; (ii) optimizing for each cluster size and parameter set to minimize the ground-state energy,[37, 38] and; (iii) averaging over all the BCs computed physical quantities.[39, 40] The results obtained using these methods will, of course, converge to the same result in the thermodynamic limit, but can have quite different system-size dependences.
The first approach (i) has ambiguity in choosing an appropriate BC for analyzing the size dependence, as finite-size effects appear very differently with different BCs. For example, when is changed in the 16-site cluster, a level crossing (or first-order transition) occurs for , while no transition occurs for . Thus, there is no obvious choice for a fixed and optimum BC, and we do not take this approach.
The second approach (ii) also has a problem. For example, at the ground-state momentum changes at a finite value of that depends on the system size; see Fig. 4(a) below. Thus, it is difficult to obtain a smooth, systematic system-size dependence with this method.
Compared with these two, the approach (iii), averaging over the BCs, does not have such difficulties and shows a well-behaved system-size dependence as we demonstrate below. In this approach, average is taken over the BCs for each cluster size,[39, 40]
| (9) |
where , and is a physical quantity (such as the Drude weight ) introduced in the previous section. In the numerical calculations, the integral over the Brillouin zone is approximated by the summation over grid points. Error bars are estimated as , where is the standard deviation and is the number of grid points. We take sufficiently large for 8- and 10-site clusters. For 16-site cluster, we choose to obtain the precisions required. For 18-site cluster, we take .
Let us demonstrate the efficiency of the averaging procedure in comparison with the method (ii). Figure 4 shows dependence of the Drude weight at obtained by the two methods (ii) and (iii). In Fig. 4(a) [the method (ii)], the Drude weight of each cluster size shows a sudden change (kink) in the dependence, which corresponds to the change of the ground-state momentum. The kink appears at different values of for different system sizes, which complicates analysis of the system-size dependence in the method (ii). Furthermore, the results of finite show large deviations of about 10% from the Drude weight in the thermodynamic limit. By contrast, Fig. 4(b) shows that the Drude weight averaged over the BCs [the method (iii)] at finite is a smooth function of and is very close to that in the thermodynamic limit; The differences between the data points of and are less than 1%.
This good convergence, seen already at small , can be understood as follows. At the Drude weight can be written in the thermodynamic limit as
| (10) |
where is the Heaviside step function, the Fermi energy, and
| (11) |
The single-particle energy is given by
| (12) |
For a finite-size cluster the averaged Drude weight is calculated as
| (13) |
where the primed sum denotes summation over lowest-energy single-particle states of energy . We note that the number of single-particle states inside the Fermi surface determined by is not always equal to in finite-size clusters. Up to this finite-size effect eq. (13) is equal to eq. (10). This indicates that, in the non-interacting case, the thermodynamic limit can be reached by averaging over the BCs even in small clusters.[41] Note that the method (iii) can distinguish between a band metal and a band insulator.


Next, Fig. 5 compares dependences of the Drude weight at obtained with the two methods (ii) and (iii). This case corresponds to the Hubbard model on the square lattice, in which the metal-insulator transition is known to take place at because of the perfect nesting. As shown in Fig. 5, however, the Drude weight computed with BCs minimizing the energy [the method (ii)] remains finite even when . A similar behavior was observed in the one-dimensional case.[34] In contrast to this, the Drude weight averaged over all the BCs [the method (iii)] immediately vanishes for , reproducing the expected metal-insulator transition, except for where the averaged Drude weight will converge slowly to zero with .
The reason why the expected behavior is reproduced even with the small size clusters is understood as follows. Let us consider the clusters for simplicity. At the ground-state momentum is for any because of the perfect nesting. In the - plane the ground-state energy has cusp singularities along the lines, and , where the ground states are degenerate. As we discussed above, the Drude weight averaged over the BCs reproduces well the one in the limit, when the cusp singularities are avoided in the average summation. A small but finite lifts the degeneracy, and the cusp lines disappear. Then the ground-state energy becomes an analytic function of , and the average Drude weight vanishes by definition, for instance, This leads to the metal-insulator transition at expected for this case with the perfect nesting.

From the results shown above, we conclude that the averaging over the twisted BCs is most efficient among the three methods to calculate . We have applied this method to calculate the double occupancy and the spin structure factor, and confirmed its efficiency for these quantities as well. In the following section, we present numerical results of the Drude weight, the double occupancy and the spin structure factor, which are obtained with this method. (We will omit the brackets .)
It turned out, however, that the method (iii) is not suitable for calculating the charge gap. To illustrate its drawback, let us consider a band insulator at . In this case, the charge gap is nothing but a band gap. If we calculate the charge gap (4) from the chemical potentials averaged over BC, the gap is overestimated, since the averaged chemical potentials and correspond to the average energy at the bottom of a conduction band and that at the top of a valence band, respectively. To reproduce the band gap in the thermodynamic limit, we should instead search the minimum energy of the conduction band and the maximum energy of the valence band. From this consideration, we use the definition
| (14) |
where
| (15) | ||||
| (16) |
With this definition, finite-size effects are completely removed for the band gap. Furthermore we obtain at the noninteracting case as expected for a metallic state. These simple arguments suggest that the definition of eq. (14) should be most effective for extracting the charge gap in the thermodynamic limit. We employ this definition in §4.2.
4 Results
In this section, we present our numerical results for , , and computed for a wide parameter range of and with the method described in the previous sections.
4.1 Drude weight
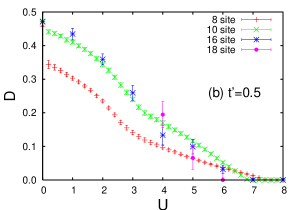
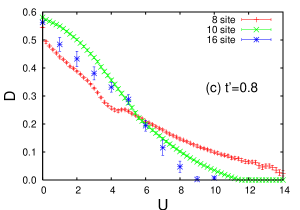
Figure 6 shows the Drude weight at , and . For each cluster size, the Drude weight decreases with increasing and eventually vanishes. We can thus define the critical value above which the Drude weight vanishes. The critical value is expected to represent the metal-insulator transition point. At and , the system-size dependence of is small, and it is reasonable to estimate for and for , respectively. However, at shows a substantial system-size dependence. Considering the fact that the Drude weight at is almost independent of the system size, we can roughly estimate .
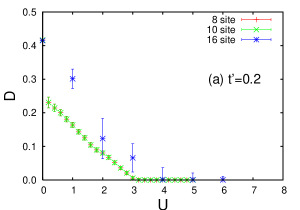
Let us remark on the discontinuity of the Drude weight at seen in the numerical results for small clusters. This discontinuity is an artifact of small system size and can be traced back to the cusp singularity at mentioned in §3. In small clusters the number of discrete momenta is small, and the region represented by is relatively large. Hence, the effect of the collapse of the cusp lines becomes pronounced and leads to the discontinuity of the Drude weight even at finite . In fact, the jump in the Drude weight is larger for smaller clusters and for smaller as shown in Fig. 6.
4.2 Charge gap
Figure 7 shows numerical results for the charge gap defined in eq. (14). A finite lifts the perfect nesting, and the charge gap opens up when is larger than some finite value. We thus define the second critical value above which we have a nonvanishing charge gap. Although it is difficult to see systematic size dependence, we can roughly estimate the critical value as , and for , and , respectively.
Note that the estimated values of are always slightly smaller than obtained from the Drude weight.


4.3 Double occupancy
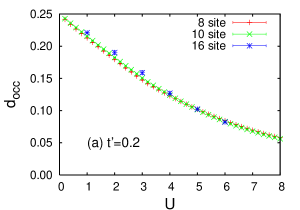
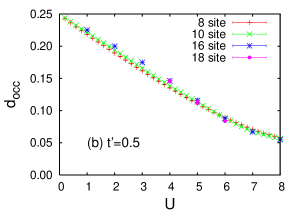
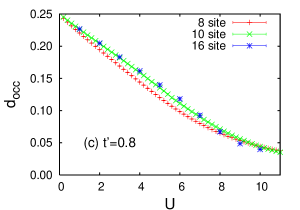
Figure 8 shows the double occupancy at , and . We find that the size dependence of the double occupancy changes at some finite . For example, at , the double occupancy increases with increasing for while it decreases for . Accordingly, in larger clusters (e.g., ), the dependence has an inflection point. We thus define the third critical value from the change in the size dependence. We estimate , and at , and , respectively.
The double occupancy is considered to be closely related with the order parameter of the Mott transition,[6] and has been calculated to determine the transition point in the previous theoretical studies. We note that the values of agree well with the critical values obtained from the Drude weight in §4.1. The relation among , and will be discussed in §5 in connection with the phase diagram.
4.4 Spin structure factor
In order to find possible magnetic phase transitions, we have calculated the spin structure factor, , defined in eq. (8). For the parameters that we studied, always shows a peak at , except when and for the 16-site cluster. Thus we here analyze the staggered component, , only.
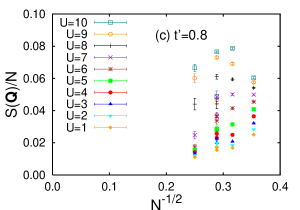
Figure 9 shows the size dependence of at , and . Here we have also plotted the results for the 12-site clusters. Although there are two 12-site clusters with different geometries as shown in Fig. 2, the two results agree well, except at . For and , systematic size scaling is observed, whose scaling form is consistent with that expected in the staggered ordered phase,
| (17) |
where . From the value of where becomes positive, we estimate the antiferromagnetic transition point to be at and for and , respectively. At , however, we cannot find any systematic size dependence, suggesting that the antiferromagnetic state is not stable in this range of .
We note that the size dependences of at are consistent with the results obtained with the PIRG method for larger clusters .[29] This again confirms that the averaging over the twisted BCs captures the asymptotic behavior in the limit of from the calculations for small clusters.


5 Discussion
In this section we discuss the numerical results presented in §4 and deduce the ground-state phase diagram.
5.1 Phase diagram
In the previous section we have shown our numerical results of the Drude weight, the charge gap, the double occupancy and the spin structure factor, which were obtained from exact diagonalization of finite-size clusters up to 18 sites. Among them the Drude weight and the charge gap are the quantities directly signalling the metal-insulator transition. The critical values of estimated from these two quantities, however, turned out to be slightly different, . On the other hand, estimated from the double occupancy was about the same as , i.e., . Naively, these results would imply that, in the parameter region , the charge gap opens but the Drude weight remains finite. It is, however, difficult to conceive a state with both a finite charge gap and a finite Drude weight, and we therefore expect that, in the thermodynamic limit, the Drude weight should vanish whenever the charge gap opens. As discussed in the following, we speculate that the seemingly conflicting result is due to non-trivial size dependence of which cannot be captured by our calculations up to 18 sites.
Here we propose two scenarios for the way in which our finite-size results approach the thermodynamic limit. The first scenario is obvious one: as the system size increases, the difference between and is reduced and eventually vanishes, and we are left with one metal-insulator transition besides the magnetic transition at a larger value . In the other scenario there remain two phase boundaries corresponding to and even in the thermodynamic limit, and system-size dependence appears mainly in the Drude weight (in the interval ) which decreases to zero, while the difference between and is kept finite.
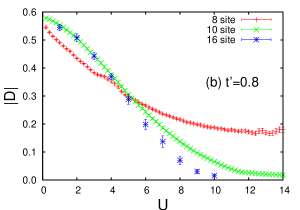
First, let us consider the former scenario and discuss the size dependence of the Drude weight and the charge gap. Concerning the Drude weight, as we mentioned in §4.1, the data at clearly show a system-size dependence for , where the Drude weight becomes smaller in larger systems. Even in the case of , if we look at the data in Fig. 6(b) carefully (by neglecting the results for the smallest 8-site cluster), we can see smaller but similar system-size dependence for , although the variation of the data for different system sizes are within the error bars. We now show that these system-size dependences can be seen more clearly in the quantity which we denote by , i.e., the average of the absolute value of the right-hand side of eq. (3) over the twisted BCs. The numerical results for are shown in Fig. 10. At , converges on a single curve for while it has systematic size dependence for . A similar size-dependent behavior is clearly seen for at . Although does not have a clear, direct physical meaning, these apparent system-size dependences of seen in Fig. 10 suggest that the Drude weight retain a size dependence in the same range of . In other words, the estimates of are considered as upper bounds for the metal-insulator boundary monitored by the Drude weight. Note that the values of where the size dependence of becomes evident roughly coincide with .

As we have mentioned in §4.2, the charge gap does not show systematic size dependence up to . Incidentally, the PIRG study has shown that the charge gap of a 16-site cluster already gives a good estimate of that in the thermodynamic limit.[42] If we assume that this is also the case in the present results, then we may regard obtained from up to 16-site clusters as a good estimate for the value in the thermodynamic limit.
These considerations on the system-size dependences of the Drude weight and the charge gap led us to the first scenario in which, as is increased beyond , decreases and finally coincides with which changes little with . In this case the Mott transition takes place at . The insulating state with larger than does not show the antiferromagnetic order until reaches which is substantially larger than . Although we do not have any further information on the magnetic properties of the insulating phase in the intermediate-coupling regime, one possibility is that the insulator is a featureless Mott insulating state without symmetry breaking, similar to the non-magnetic insulator found in the PIRG calculations.[29] Hence, in this scenario, we have three different phases in the plane of and : a paramagnetic metal for , a non-magnetic insulating state for , and an antiferromagnetic insulator for .
Next, we explain the second scenario in which the phase diagram has two distinct phase boundaries corresponding to and . In this case also, we assume that, in the thermodynamic limit, the system is insulating for because of the opening of the charge gap and because of possibly negligible size dependence of as discussed above. One might then wonder how a finite Drude weight observed in the region diminishes with increasing system size, while remains larger than . We speculate that this peculiar behavior of the Drude weight is a fingerprint of some unconventional nature of the intermediate phase. Let us suppose, for example, that we have a bunch of low-energy levels which are separated by a gap from higher-energy modes. These low-energy levels are distinguished by their total momenta . Let us further assume that, as the system size increases, the band widths of the low-energy modes get narrower, while their dispersion curves remain to overlap as in Fig. 3(a). In this case we should observe finite Drude weight which is decreasing with increasing system size. When , we thus expect to have an insulating phase with many low-energy modes, which is reminiscent of the non-magnetic Mott insulator found by the PIRG study.[29] Since the twisted BCs are not directly coupled to spin degrees of freedom, these low-energy modes involve some charge dynamics and would not be obtained by spin-only models like the Heisenberg model with multiple-spin exchange interactions. The remaining problem is what happens at the phase boundary as is increased. A possibility is that there occurs a phase transition to another insulating state with some conventional symmetry breaking, e.g., an insulator with a complicated pattern of magnetic order or with dimer order.[43, 44] In such an insulating state, the ground state may consist of a single dispersion as depicted in Fig. 3(b), and the Drude weight becomes zero even in the small size clusters. Hence, in this second scenario, we have four different phases: a paramagnetic metal for , a non-magnetic insulating state for , another insulating state for , and an antiferromagnetic insulator for .
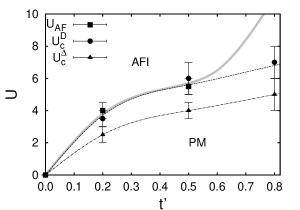
We summarize the possible phase diagram in Fig. 11 according to the two scenarios explained above. The grey curve represents the antiferromagnetic transition at . The dash-dotted curve corresponds to the opening of charge gap at . The broken curve denotes a possible phase transition from an unconventional, non-magnetic insulator to another insulating state at suggested in the second scenario.
With the numerical results at hand, we cannot conclude which scenario is more plausible. To answer this question requires further studies, such as calculations on larger clusters, a through examination of magnetic symmetry breaking beyond the simple antiferromagnetic order with and of other symmetry breakings (dimerization etc.).
5.2 Comparison with other theoretical studies
Here, we discuss the implications of our results in comparison with other previous theories, focusing on the nature of the Mott transition. Comparing the phase diagram in Fig. 11 with that obtained by the large-scale PIRG calculations,[29] we find that the Mott transition line in our phase diagram is in good agreement with the one determined by the PIRG method. However, there is an important discrepancy in the evolution of the double occupancy as a function of .
In our results, as shown in Fig. 8, the double occupancy is a smooth decreasing function of , showing no notable anomaly in the Mott transition at . On the contrary, in the PIRG results, it shows a jump at the transition, indicating the first-order nature of this metal-insulator transition. Moreover, in the metallic state in the vicinity of the transition, the double occupancy is not a decreasing function of ; it is almost flat in a certain range of and keeps a relatively large value of about 0.2. This flat regime as well as the jump is not reproduced in our calculation of the double occupancy.
On the other hand, in the insulating side just above , the double occupancy shows a good agreement between the two results. Our results indicate an opening of the charge gap expected there. Furthermore, as we discussed in §5.1, a finite Drude weight showing a small system-size dependence can be ascribed to some unconventional nature of the insulating state, as suggested in the PIRG study.[29] Hence we consider that our present scheme has a potential to describe the insulating side of the Mott transition.
Thus the most peculiar feature is seen in the metallic side of the Mott transition. There the PIRG results indicate that carriers have coherent nature even at a moderately large value of . In fact, the momentum distribution shows a large jump at the Fermi surface without significant reduction of the renormalization factor.[29] If we regard the PIRG results as standard results to be reproduced, then the discrepancy between our results and the PIRG results implies that the coherent nature of a carrier is not captured by our calculations for small size clusters, even though strong correlations are taken into account properly in our exact-diagonalization study. Moreover, the peculiar behavior of the double occupancy is not reproduced by both the VMC study[22] and the cellular DMFT study.[23] Considering the fact that the system size used in the VMC study is much larger than the one in our study, we suspect that the discrepancy between the VMC study and the PIRG is indicating that the many-body effects relevant to the peculiar coherency are not treated properly in the VMC which employs approximation of a single Slater determinant with a Gutzwiller projection. The disagreement between the results of the cellular DMFT and the PIRG might be ascribed to the problem shared by our study, i.e., lack of sufficient information on the spatial fluctuations in larger scale. Further study is highly desired to clarify the peculiar nature of the metallic state, and this will help us better understand the Mott transition.
6 Summary
We have studied the ground-state properties of the two-dimensional Hubbard model on the anisotropic triangular lattice by the exact diagonalization method. In order to reduce the finite-size effects, we have demonstrated efficiency of averaging over the twisted boundary conditions for reducing finite-size effects. Using this technique, we have calculated the Drude weight, the charge gap, the double occupancy and the spin structure factor, and determined the the phase boundaries of the metal-insulator transition and the antiferromagnetic transition. An unconventional aspect of the Mott transition of the present system is illuminated by comparing our results with other previous theoretical results.
We would like to thank M. Imada, T. Momoi, H. Nakano, T. Oka, H. Tsunetsugu, S. Watanabe, and Y. Yanase for useful discussions. This work was in part supported by Grant-in-Aid for Scientific Research (No. 16GS0219 and 17071003) and NAREGI from Ministry of Education, Culture, Sports, Science and Technology, Japan. Numerical calculations are partly performed on the Hitachi SR11000 of the Supercomputing Division, Information Technology Center, The University of Tokyo.
References
- [1] N. F. Mott: Proc. Phys. Soc. London, Ser. A 62 (1949) 416.
- [2] M. Imada, A. Fujimori and Y. Tokura: Rev. Mod. Phys. 70 (1998) 1039.
- [3] K. Kanoda: J. Phys. Soc. Jpn. 75 (2006) 051007, and references therein.
- [4] H. Seo, J. Merino, H. Yoshioka and M. Ogata: J. Phys. Soc. Jpn. 75 (2006) 051009, and references therein.
- [5] F. Kagawa, K. Miyagawa and K. Kanoda: Nature 436 (2005) 534.
- [6] G. Kotliar, E. Lange and M. J. Rozenberg: Phys. Rev. Lett. 84 (2000) 5180.
- [7] P. Limelette, A. Georges, D. Jérome, P. Wzietek, P. Metcalf and J. M. Honig: Science 302 (2003) 89.
- [8] See also C. Castellani, C. Di Castro, D. Feinberg and J. Ranninger: Phys. Rev. Lett. 43 (1979) 1957.
- [9] Y. Shimizu, K. Miyagawa, K. Kanoda, M. Maesato and G. Saito: Phys. Rev. Lett. 91 (2003) 107001.
- [10] Y. Kurosaki, Y. Shimizu, K. Miyagawa, K. Kanoda and G. Saito: Phys. Rev. Lett. 95 (2005) 177001.
- [11] Another type of organic compounds, whose magnetic properties are understood based on the spin-1/2 Heisenberg model on a triangular lattice, are the [Pd(dmit)2] salts; see, e.g., M. Tamura and R. Kato: J. Phys.: Condens. Matter 14 (2002) L729.
- [12] H. Kino and H. Fukuyama: J. Phys. Soc. Jpn. 65 (1996) 2158.
- [13] S. Onoda and M. Imada: Phys. Rev. B 67 (2003) 161102.
- [14] O. Parcollet, G. Biroli and G. Kotliar: Phys. Rev. Lett. 92 (2004) 226402.
- [15] An application of the cellular DMFT to the Hubbard model on the Kagomé lattice can be found in T. Ohashi, N. Kawakami and H. Tsunetsugu, Phys. Rev. Lett. 97 (2006) 066401.
- [16] M. Imada: Phys. Rev. B 72 (2005) 075113.
- [17] T. Misawa, Y. Yamaji and M. Imada: J. Phys. Soc. Jpn. 75 (2006) 083705.
- [18] H. Kino and H. Kontani: J. Phys. Soc. Jpn. 67 (1998) 3691.
- [19] H. Kondo and T. Moriya: J. Phys. Soc. Jpn. 68 (1999) 3170.
- [20] S.-S. Lee and P. A. Lee: Phys. Rev. Lett. 95 (2005) 036403.
- [21] J. Liu, J. Schmalian and N. Trivedi: Phys. Rev. Lett. 94 (2005) 127003.
- [22] T. Watanabe, H. Yokoyama, Y. Tanaka and J. Inoue: J. Phys. Soc. Jpn. 75 (2006) 074707.
- [23] B. Kyung and A.-M. S. Tremblay: Phys. Rev. Lett. 97 (2006) 046402.
- [24] O. I. Motrunich: Phys. Rev. B 72 (2005) 045105.
- [25] J. Y. Gan, Y. Chen, Z. B. Su and F. C. Zhang: Phys. Rev. Lett. 94 (2005) 067005.
- [26] B. J. Powell and R. H. McKenzie: Phys. Rev. Lett. 94 (2005) 047004.
- [27] M. Imada and T. Kashima: J. Phys. Soc. Jpn. 69 (2000) 2723.
- [28] T. Kashima and M. Imada: J. Phys. Soc. Jpn. 70 (2001) 2287.
- [29] H. Morita, S. Watanabe and M. Imada: J. Phys. Soc. Jpn. 71 (2002) 2109.
- [30] W. Kohn: Phys. Rev. 133 (1964) A171.
- [31] D. J. Scalapino, S. R. White and S. C. Zhang: Phys. Rev. Lett. 68 (1992) 2830.
- [32] D. J. Scalapino, S. R. White and S. C. Zhang: Phys. Rev. B 47 (1993) 7995.
- [33] We note that our definition of the Drude weight does not recover the triangular lattice symmetry at . The definition covers the square lattice symmetry and is suitable for our study, since we here focus on the anisotropic cases with including the square lattice at .
- [34] R. M. Fye, M. J. Martins, D. J. Scalapino, J. Wagner and W. Hanke: Phys. Rev. B 44 (1991) 6909.
- [35] The insulating BC dependence does not necessarily mean that the ground state is unique in the thermodynamic limit since we only consider the same BC for up and down spins, which cannot detect the degeneracy of states with different total spin. In order to study the degeneracy in total spin, which is expected, for example, in the antiferromagnetic state, we have to change BC of up and down spins separately, which is beyond the scope of this paper.
- [36] E. Dagotto, A. Moreo, F. Ortolani, D. Poilblanc, and J. Riera: Phys. Rev. B 45 (1992) 10741.
- [37] H. Nakano and M. Imada: J. Phys. Soc. Jpn. 68 (1999) 1458.
- [38] A variant of this method was recently used in H. Nakano, Y. Takahashi, and M. Imada: J. Phys. Soc. Jpn. 76 (2007) 034705.
- [39] D. Poilblanc: Phys. Rev. B 44 (1991) 9562.
- [40] C. Gros: Z. Phys. B 86 (1992) 359.
- [41] J. Bonča and P. Prelovšek: Phys. Rev. B 67 (2003) 085103.
- [42] S. Watanabe and M. Imada: J. Phys. Soc. Jpn. 73 (2004) 1251.
- [43] Z. Weihong, R. H. McKenzie and R. R. P. Singh: Phys. Rev. B 59 (1999) 14367.
- [44] T. Mizusaki and M. Imada: Phys. Rev. B 74 (2006) 014421.