Control of optical emission in doped GaAs/AlGaAs nanofabricated quantum dots
Abstract
Dilute arrays of GaAs/AlGaAs modulation-doped quantum dots (QDs) fabricated by electron-beam lithography and low impact reactive-ion etching exhibit highly homogeneous luminescence. Single quantum dots display spectral emission with peak energies and linewidths linked largely to the geometrical diameter of the dot and to the built-in electron population. Excitonic-like and biexcitonic-like emission intensities have activation energy of about 2 meV. These results highlight the potential of high quality nanofabricated QDs for applications in areas that require fine control of optical emission.
Semiconductor QDs are the materials basis for the realization of high-performance optoelectronic devices review ; finley . QDs have been also proposed as building blocks for spintronic devices and for the creation and manipulation of quantum bits at the nanoscale loss . In addition, they represent a unique laboratory where few-particle fundamental quantum effects can be studied garcia . A large part of the spectroscopic investigations of QDs was devoted to undoped self-assembled QDs that however offer limited control on their size and emission energies. Their macro-photoluminescence spectra exhibit large inhomogeneous broadening due to the size variation from dot to dot gurioli . In single-dot micro-photoluminescence (-PL) experiments, however, sharp homogeneous-broadened excitonic emission peaks were reported finley2 ; dekel . Single-dot luminescence was also carried out in undoped AlGaAs/GaAs QDs formed by well-width fluctuations or defined in cleaved-edge overgrowth samples weg . Nanofabricated modulation-doped GaAs/AlGaAs QDs populated by many electrons were also proposed and studied by inelastic light scattering strenz . Recently we demonstrated that arrays of nanofabricated GaAs/AlGaAs QDs doped with very few electrons can be fabricated and studied by inelastic light scattering spectroscopy garcia .
In this letter we address the interband optical properties of few-electron nanofabricated GaAs/AlGaAs QDs by micro-luminescence. We found that their emission energies can be tuned by changing the QD metallurgical diameter and that their emission lineshapes are identical in different individual QDs. By performing a power-dependent analysis of the spectra we have determined excitonic-like and biexcitonic-like recombinations, even in the presence of a built-in electron population. These excitonic peaks show remarkable wide line-widths close to 1 meV contrary to what is usually observed in single undoped QDs. Finally we derived an activation energy of about 2 meV from the analysis of the temperature dependence of the intensities of excitonic luminescence. The results highlight the robust and reproducible tunable optical recombination properties of the high quality nanofabricated structures. Access to such uniform QD systems also offer experimental platforms for the explorations of fundamental interactions in inter-band optical properties of QDs charged with electrons warburton ; wojs ,
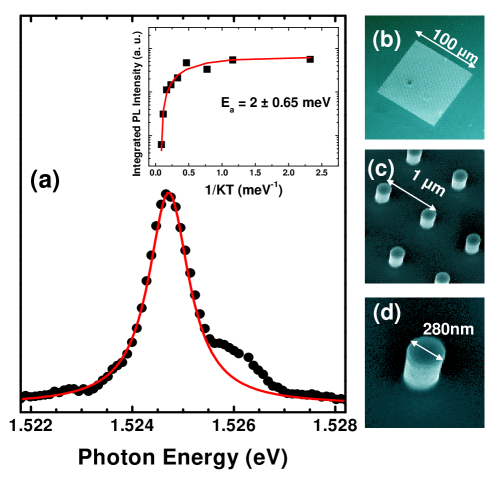
Arrays of QDs were fabricated by electron beam lithography and reactive ion etching using a single modulation-doped quantum well (QW) of 25nm garcia . Scanning Electron Microscope (SEM) pictures of one array as well as of individual dots are shown in Fig. 1 (b,c,d). Here we focus on QDs with diameter in the range 210-440 nm for which the electron occupation ranges from around 4-6 to few tens. We remark that in the case of GaAs QDs defined by dry etching, the number of confined electrons and the effective confinement are both determined by the large depletion region associated to Fermi level pinning due to GaAs surface states such as antisite defects spicer or other chemical defects introduced during the etching process. Due to the depletion effect, the effective sizes of the electronic confinement are much smaller than the geometrical diameters of the etched mesa structures particularly at low-electron densities martorell ; garcia .
For the -PL experiments, a dye laser at 600 nm pumped by the second harmonic of a Nd:YAG pulsed laser was used with pulse duration of 2 ps and repetition rate of 76 MHz. For the collection, a confocal configuration of two infinity corrected microscope objectives was used. The PL signal was then focused to a monomode optical fiber with a core diameter of 3.5 m assuring a lateral resolution of 0.7 m. A single grating spectrometer and a CCD camera were used for the detection. All -PL experiments were carried at 5.7K (except for the temperature-dependent spectra) in a low-vibrational cryostat. The presence of an electron population in the dots was confirmed separately by inelastic light scattering experiments displaying a rich spectrum of intershell electronic excitations in all arrays.
Figure 1(a) shows the -PL spectra of a single QD with =280 nm. The homogeneity of the optical emission of the QDs was inferred by performing spatially-resolved PL experiments along the arrays that revealed identical spectra from different excited QDs leading to a macro-PL very similar to the -PL spectrum. The peak at 1.525 eV is assigned to the QD PL and it is blue-shifted with respect to the QW peak as shown in Fig.2 where the -PL emission peak of the =330 nm QD is also reported. The QW emission presents the usual lineshape of modulation-doped QW luminescence determined by the recombination of electrons from the bottom of the subband up to the Fermi energy ( 2 meV). The single QD emissions are well described by Lorentzian lineshapes (shown as red lines in Figs.1(a), 2 and 3(a)) suggesting homogeneous broadening as expected for single-dot luminescence. In addition, the plot of the integrated intensity of the peak shown in Fig.1(a) with temperature changes yields an activation energy of meV, which is deduced from the simple equation = - exp (solid line in inset to Fig.1(a))pinczuk . This value, which is comparable to the QD inter-shell energy difference garcia , suggests that thermal activation of excited excitonic states can be responsible for the quenching of the PL signal. The inset to Fig. 2 summarizes the energy shift of the QD PL with respect to the QW PL peak (at 1.521 eV) for different dot diameters. The observed red-shift with increasing reflects the decrease of the effective three-dimensional confinement with confinement energies of the order of 1 meV already observed for = 440 nm due to the impact of the depletion region. Full widths at half maximum (FWHM) of the emission peaks are much larger than those usually observed in single-dot PL with values of 0.7 meV for the = 280 nm dot and 2.7 meV for the = 330 nm QD (2 meV for the = 440 nm QD). Finally we note that the small higher energy shoulder shown in Fig.1(a) is observed at the same energy position in other QD arrays with different diameters and it is assigned to recombination from the Si-doped AlGaAs layer, probably linked to deep donor-acceptor pairs nota .
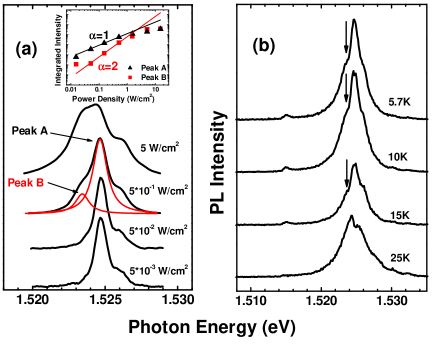
In order to identify the nature of the PL emission shown in Fig. 1(a) we report in Fig. 3(a) the power-dependence of the -PL. As the power density increases, an additional peak appears as a shoulder in the low-energy side of the main peak, and red-shifted by 1.5 meV. A fitting procedure using two Lorentzian lines reproduce very well the observed peaks as demonstrated in Fig. 3(a). The inset to Fig. 3(a) shows the integrated intensities of the main and the low-energy QD peaks as a function of power density. The main QD peak (peak A) has a linear dependence with power density, a typical excitonic-like behavior. On the contrary, the lower-energy peak (peak B) has a quadratic dependence with the power density, which is a typical signature of biexcitonic-like behavior senellart . The 1.5 meV energy shift between these two peaks can thus be interpreted as the binding energy of the biexcitonic excitation in the presence of the electron population. The temperature-dependent evolution of the spectra shown in Fig. 3(b) demonstrates that beyond 20K the biexciton disappears which is consistent with a binding energy of 1.5 meV.
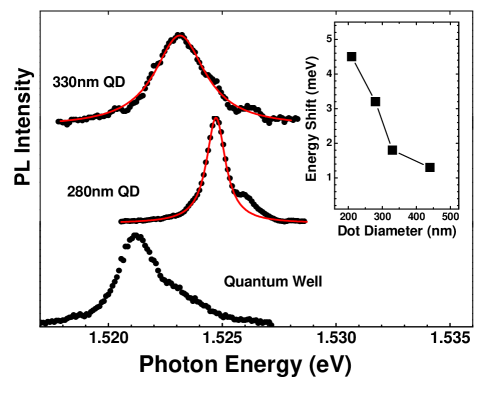
The evolution of the energy shifts of the QD peaks from the QW emission ranges from 1 meV for the =440 nm dot up to 4.6 meV for the =210 nm dot (see inset to Fig.2) and allows to give an estimate for the number of electrons in the dots. The QD emission energy can be written as wojs , where and are the in-plane confinement energies for the electrons and holes, respectively, is the QW transition energy and measures many-body corrections due to the QD confinement. is negative and determined by the excitonic attraction of the QD electron-hole pair and the interaction between the pair with the excess electrons in the QD.
For QDs with =210 nm, and ( is the electron population in the QD) were previously determined garcia . In the parabolic approximation we thus have where is the in-plane heavy-hole effective mass in the cylindrical approximation. The measured energy shift = 4.5 meV thus implies that . If we assume the same value of for the QDs with =280 nm we obtain that leads to reim . In the case of QDs with larger diameter, we expect a significant reduction of together with the deviation of the potential profile from the parabolic form, due to the increased number of electrons. It is therefore difficult to estimate precisely the number of electrons but we expect an electron occupation that approaches a few tens for the largest QDs with = 440 nm.
As mentioned before, the linewidth of the (Lorentzian) peaks in our spectra is remarkably large for single-dot spectroscopy. Spectral diffusion does not seem to be the responsible broadening mechanism since one would expect its impact to be reduced in larger dots (which is not the case). Instead the broadening could reflect the dynamical changes of the electron population induced by the interband electron-hole recombination. A similar process was considered in Ref. warburton to explain the increase of the -PL linewidth in doped InAs quantum rings at electron occupation beyond =4. Further investigations are needed to establish the correct broadening mechanism in these systems.
In conclusion, we studied the -photoluminescence of nanofabricated charged AlGaAs/GaAs single QDs. Excitonic and biexcitonic-like recombinations are observed, even in the presence of a built-in electron population with recombination energies linked to the QD lateral diameters. The nanofabricated GaAs/AlGaAs QDs with a limited and controlled number of electrons show promises for applications in quantum optics as well as for fundamental studies of electron correlations in nanoscale systems.
We are grateful to M. Rontani, G. Goldoni and E. Molinari for illuminating discussions. We acknowledge support from the Italian Ministry of Foreign Affairs, Italian Ministry of Research (FIRB-RBAU01ZEML), European Community’s Human Potential Program (HPRN-CT-2002-00291). AP is supported by the National Science Foundation (DMR-03-52738), the Department of Energy (DE-AIO2-04ER46133), the Nanoscale Science and Engineering Initiative of the National Science Foundation under NSF Award Number CHE-0117752, and the New York State Office of Science, Technology, and Academic Research (NYSTAR).
References
- (1) For a review, see Single Quantum Dots, Topics of Applied Physics edited by P. Michler (Springer Verlag, Heidelberg, 2003)
- (2) M. Kroutvar, Y. Ducommun, D. Heiss, M. Bichler, D. Schuh, G. Abstreiter and J. J. Finley, Nature. 432, 81 (2004)
- (3) D. Loss and D. P. DiVincenzo, Phys Rev. A 57, 120 (1998).
- (4) C. P. Garcia, V. Pellegrini, A. Pinczuk, M. Rontani, G. Goldoni, E. Molinari, B. S. Dennis, L. N. Pfeiffer and K. W. West, Phys. Rev. Lett. 95, 266806 (2005).
- (5) M. Gurioli, S. Sanguinetti, and M. Henini, Appl. Phys. Lett. 78, 931 (2001).
- (6) J. J. Finley, A. D. Ashmore, A. Lemaitre, D. J. Mowbray, M. S. Skolnick, I. E. Itskevich, P. A. Maksym, M. Hopkinson and T. F. Krauss, Phys. Rev. B. 63, 073307 (2001).
- (7) E. Dekel, D. Gershoni, E. Ehrenfreund, D. Spektor, J. M. Garcia and P. M. Petroff, Phys. Rev. Lett. 80, 4991 (1998).
- (8) W. Wegscheider, G. Schedelbeck, G. Abstreiter, M. Rother and M. Bichler, Phys. Rev. Lett. 79, 1917 (1997).
- (9) R. Strenz, U. Bockelmann, F. Hirler, G. Abstreiter, G. B hm, and G. Weimann, Phys. Rev. Lett. 73 3022 (1995).
- (10) R. J. Warburton, C. Sch flein, D. Haft, F. Bickel, A. Lorke, K. Karrai, J. M. Garcia, W. Schoenfeld and P. M. Petroff, Nature 405, 926 (2000).
- (11) A. Wojs and P. Hawrylak, Phys. Rev. B. 55, 13066 (1997).
- (12) W.E. Spicer, Z. Liliental-Weber, E. Weber, N. Newman, T. Kendelewicz, R. Cao, C. McCants, P. Mahowald, K. Miyano, and I. Lindau, J. Vac. Sci. Technol. B 6,, 1245 (1988).
- (13) J. Martorell, and D. W. L. Sprung, Phys. Rev. B 54, 11386 (1996).
- (14) Rui He, X. Chi, A. Pinczuk, D. V. Lang and A. P. Ramirez, Appl. Phys. Lett. 87, 211117 (2005).
- (15) M. Bayer, T. Gutbrod, A. Forchel, V. D. Kulakovskii, A. Gorbunov, M. Michel, R. Steffen, and K. H. Wang, Phys. Rev. B. 58, 4740 (1998).
- (16) T. Kuroda, S. Sanguinetti, M. Gurioli, K. Watanabe, F. Minami and N. Koguchi, , Phys. Rev B. 66, 121302R (2002).
- (17) R. Heitz, F. Guffarth, I. Mukhametzhanov, M. Grundmann, A. Madhukar, and D. Bimberg Phys. Rev. B 62, 16881 (2000).
- (18) This high-energy shoulder is not observed outside of the QD array where the sample is etched beyond the doping layer and the QW. In addition, the peak is not seen with excitation photon energy below the AlGaAs bandgap. As expected for recombination from deep donor-acceptor pairs, the peak is blue shifted at high power density (J. Kang and Q. Huang, J. Appl. Phys. 72, 1395 (1992)).
- (19) P. Senellart, E. Peter, J. Hours, A. Cavanna, and J. Bloch, Phys. Rev. B 72, 115302 (2005).
- (20) S.M. Reimann and M. Manninen, Rev. Mod. Phys. 74, 1283 (2002).