Dynamics of ultrathin metal films on amorphous substrates
Abstract
A mathematical model is developed to analyze the growth/decay rate of surface perturbations of an ultrathin metal film on an amorphous substrate (). The formulation combines the approach of Mullins [J. Appl. Phys. v30, 77, 1959] for bulk substrates, in which curvature-driven mass transport and surface deformation can occur by surface/volume diffusion and evaporation-condensation processes, with that of Spencer et al. [Phys. Rev. Lett. v67, 26, 1991] to describe solid state transport in thin films under epitaxial strain. Modifications of Mullins model to account for thin film boundary conditions result in qualitatively different dispersion relationships especially in the limit as where is the wavenumber of the perturbation and is the unperturbed film height. The model is applied to study the relative rate of solid state mass transport as compared to that of liquid phase dewetting in a thin film subjected to fast a thermal pulse. Specifically, we have recently shown that multiple cycles of nanosecond () pulsed laser melting and resolidification of ultrathin metal films on amorphous substrates can lead to the formation of various types of spatially ordered nanostructures [Phys. Rev. B, v75, 235439 (2007)]. The pattern formation has been attributed to the dewetting of the thin film by a hydrodynamic instability. In such experiments the film is in the solid state during a substantial fraction of each thermal cycle. However, results of a linear stability analysis based on the aforementioned model suggest that solid state mass transport has negligible effect on morphology changes of the surface. Further, a qualitative analysis of the effect of thermoelastic stress, induced by the rapid temperature changes in the film-substrate bilayer, suggests that stress relaxation does not appreciably contribute to surface deformation. Hence, surface deformation caused by liquid phase instabilities is rapidly quenched-in during the cooling phase. This deformed state is further evolved by subsequent laser pulses. These results have implications to developing accurate computer simulations of thin film dewetting by energetic beams aimed at the manufacturing of optically active nanoscale materials for applications including information processing, optical devices and solar energy harvesting.
I Introduction
Ion and photon beam irradiation are widely used to generate nanoscale surface features for a variety of applications: optoelectronic, plasmonic, magnetic, bio- and chemical sensing, and catalytic devices McHenry and Laughlin (2000); Shipway et al. (2000); Xia et al. (2003); Raty et al. (2005). Understanding interfacial transport mechanisms under fast thermal processing or energetic beam irradiation is essential to accurately predicting the spatio-temporal dynamics of film evolution that imparts the desired nanoscale surface features. The contributions from various solid state transport processes that cause surface changes such as flattening or grooving in bulk materials were studied by Mullins Mullins (1957); Nichols and Mullins (1965); Mullins (1959). In his formulation, smoothening of bulk surfaces is driven by curvature effects that manifest in solid state surface diffusion, volume diffusion, or evaporation-condensation mechanismsMullins (1959). Mullins’ theory has been widely accepted and used extensively in the analyses of surface processes Espinosa et al. (2006); Cahill (2003); Bartelt (2002); Tritscher (1999); Timsit (1990); Ogasawara (2003). However, Mullins’ theoretical framework is inadequate to describe solid state mass transport in ultrathin films in which one has to account for the effects of other driving forces on pattern formation, e.g. dispersion forces and epitaxial stress. For instance, it is well-established that epitaxial stress has a significant effect on surface diffusion. There is extensive literature on pattern formation in thin films in the presence of epitaxial stresses Spencer et al. (1991); Lu and Suo (2001); LeGoues et al. (1990); Jensen (1999). In contrast, the literature on the evolution of ultrathin films on amorphous substrates, a scenario in which epitaxial stress effects are negligible, is sparse. In this article, we develop a generally applicable mathematical model for describing such processes and apply the model to study solid state transport in thin films exposed to time periodic laser thermal stimulus.
Recently, we have observed that thermal processing of ultrathin metal films by multiple instances of a pulsed laser (with each pulse separated in time by ) results in a variety of spatially ordered patterns Favazza et al. (2006a, b, c). One of the important findings, relating to the processing conditions, was that in order for pattern formation to occur, it was necessary to irradiate the films at a laser fluency at or above a critical value, which was well-correlated with the threshold energy required to melt the films Trice et al. (2007). Consequently, mass transport was considered to occur primarily in the liquid phase and pattern formation was attributed to a thin film hydrodynamic (TFH) dewetting instability, which arises in spinodally unstable films when attractive long-range intermolecular dispersion forces amplify surface perturbations Favazza et al. (2006c). Thermal modeling of the film/substrate bilayer showed that during one laser pulse, the film experienced a nearly uniform, but transient temperature field for a time scale of , of which the time to reach the melt temperature during the heating phase was , the liquid lifetime, was typically between and cooling time was Trice et al. (2007). Therefore, approximately of the thermal cycle following each laser pulse was spent in the cooling phase. This is important in the context of Mullins’ analysis, which suggests that solid state diffusion and evaporation-condensation processes could influence surface deformation. Hence, it is necessary to analyze both liquid and solid phase mass transport processes to develop a comprehensive understanding of the physics of interface evolution in thin films processed under pulsed laser irradiation.
In this work, we have suitably modified Mullins’ original formulation Mullins (1959) to describe the evolution of infinitesimally small surface perturbation of ultrathin solid films on amorphous substrates. In particular, we have derived new results for volume diffusion transport and have employed the approach adopted by Spencer et al. Spencer et al. (1991) originally for describing diffusion in epitaxially stressed films, in order to account for dispersion forces that are influential only in thin films. For pulsed laser experiments described in Favazza et al. (2006a, c); Trice et al. (2007), we determined that there is negligible contribution to surface deformation from solid state material redistribution by evaluating solid state mass transport rates via diffusion and evaporation-condensation processes. These results suggest that film deformation occurring under each melting cycle in the liquid phase is essentially quenched-in during rapid resolidification. Subsequent laser pulses cause progressively more interface deformation until the film ruptures. This mechanism is consistent with experimental observations Favazza et al. (2006c); Trice et al. (2007).
II Solid state mass transport
Local curvature differences provide the driving force for mass rearrangement through various mechanisms in the solid state including surface diffusion, volume diffusion, and evaporation-condensation. In a series of papers, Mullins outlined a theory to predict the mass transfer rates by the aforementioned processes for surface deformation of bulk materials Mullins (1957); Nichols and Mullins (1965); Mullins (1959). For thin films, additional driving forces need to be accounted for, such as the free energy contributions from dispersion (van der Waals) forces and thermal strain. For films supported by amorphous substrates, epitaxial strain is irrelevant. However, mismatch in thermal expansion coefficients of the film and the substrate can result in thermoelastic strain. In this work, we first develop the theory by incorporating dispersion forces, in the absence of thermal stresses. The effect of thermal stresses is only discussed qualitatively in Sec. V.
Following Spencer et al. Spencer et al. (1991), the evolution of the film height h is described by:
| (1) |
where , is the surface tension, is the local curvature, is the surface diffusion coefficient, is the atomic volume, is the number of atoms per unit area, is Boltzmann’s constant, is the absolute temperature, is a free energy per volume term, and is an additional velocity term such as a material deposition term Mullins (1957); Nichols and Mullins (1965); Spencer et al. (1991). In the limit that the height of any surface fluctuations are small, the curvature can be approximated as . It has already been established that dispersion forces play a key role in the evolution of a thin metal film Suo and Zhang (1998), especially upon laser-induced melting Favazza et al. (2006a, b, c); Trice et al. (2007); Bischof et al. (1996). By including the effect of the disjoining pressure to the free energy, the height evolution equation becomes:
| (2) |
where is the Hamaker coefficient and the free energy per volume contribution due to dispersion forces, is strictly valid for a flat film.
The effects of evaporation-condensation and volume diffusion processes can be included into the height evolution equation as additional velocity terms, in eq. 1. By relating local pressure differences between the flat and perturbed states to the local curvature though the Gibbs-Thompson formula, Mullins has shown that the evolution of a rough surface, due to evaporation-condensation is given by:
| (3) |
where ), is the equilibrium vapor pressure and is the mass of the metal atom Mullins (1957, 1959).
As in the case of evaporation-condensation, volume diffusion can be considered and included in the height evolution equation as another term. In the derivation below, x and z denote the lateral and normal coordinates respectively such that z = 0 and h correspond to the film-substrate interface and local film height respectively. The substrate is much thicker than the film and hence considered as a semi-infinite domain. The decay rate due to volume diffusion can be related to the local density, as , where is the coefficient of self-diffusion and z denotes the coordinate normal to the substrate plane Mullins (1959); Herring (1950). For a bulk surface (), assuming quasi steady-state diffusion and solving the Laplace equation with boundary conditions at and at , where and are the amplitude and wavevector of the surface perturbation respectively, Mullins derived , where . However, for a film of finite thickness the boundary conditions need to be modified, specifically: at and at . Assuming quasi-steady state diffusion and where the expression for volume diffusion becomes :
| (4) |
where is the average film thickness.
Note that the quasi-steady state (QSS) assumption is only valid if , and even for sub-nanometer thick metal films, the time to reach QSS, . However, since (the density gradient at the surface of the film) will have its largest magnitude for short times and decrease to its steady-state value, the decay rate represented by a quasi steady-state approximation is a limiting case. For systems with a timescale the decay rate will be faster than that predicted above. For macroscopic systems , eq. 4 reduces to the Mullins equation for volume diffusion, Mullins (1959). It is interesting to note that in the opposite limit, i.e., for thin films with a relatively large perturbation wavelength () and after linearizing the exponential about , the expression for decay due to volume diffusion simplifies to:
| (5) |
This limit applicable for thin films is qualitatively different from that for a bulk material, with the rate of decay varying as as compared to for the latter. Further, the thickness dependence, i.e., the decay rate varying as , is absent in the case of bulk materials.
| (6) |
Letting , the growth/decay rate, of surface perturbations in the solid state is given by:
| (7) |
III Hydrodynamics of thin liquid metal films
In this section we summarize the results for the growth/decay rate of thin liquid films with the purpose of comparing the mass transport rates in the liquid state to that in the solid state. For a detailed description of liquid state mass transport and dewetting in thin films, see Vrij (1966); Vrij and Overbeek (1968); de Gennes et al. (2004); Kondic (2003); Sharma and Ruckenstein (1986); Reiter (1992). When the Navier-Stokes equations, describing mass transport in thin liquid films, are simplified via the lubrication approximation, a film-thickness dependent relationship between the material flow rate and pressure gradient can be derived Vrij (1966); Vrij and Overbeek (1968). The pressure is a combination of the Laplace pressure from capillarity and a disjoining pressure that arises from long-range dispersion or van der Waals forces Vrij (1966); Vrij and Overbeek (1968). When the disjoining pressure, which tends to amplify perturbations, exceeds the stabilizing effect of the surface tension, the film is in an unstable state and perturbations will grow, eventually causing the film to rupture. The thin film hydrodynamic equation describing this behavior is given by the following:
| (8) |
where is the dynamic viscosity. Once again letting , the growth/decay rate in the liquid phase is given by:
| (9) |
yielding the largest unstable wavevector, and a fastest growing perturbation wavelength, .
IV evolution of surface perturbations in solid and liquid states
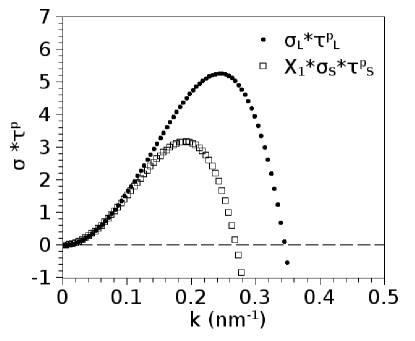
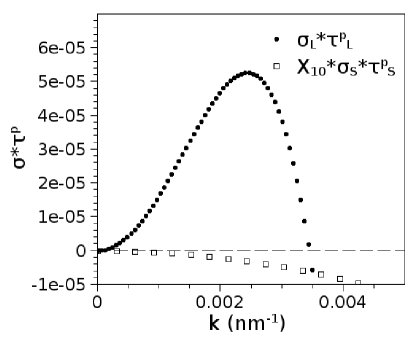
As mentioned previously (Sec. III), analytical models and numerical simulations have shown that for pulsed laser irradiation of thin metal films, the cooling time of the film is approximately times as large as the time that the film is in the molten state, i.e., Trice et al. (2007). At the beginning of the cooling phase, the film is at its melting temperature. The high temperatures suggest that solid state material transport mechanisms could be active. To estimate the relative magnitude of the effect that solid state mass transport could have on deformation of the film during the cooling period, we employed eqs. 7 and 9. For the values of and , we used the models of Flynn for surface and volume diffusion in which and Flynn (2006). In order to gain quantitative insight on the effect of mass transport in each phase, we have compared the growth/decay rate of a perturbation multiplied by the timescale during which it is applicable. Since diffusion and evaporation processes are disproportionally influenced by the time spent at the peak temperature, we have used an overestimate of the time at the peak temperature of in order to find an upper limit of the contribution from the solid state transport mechanisms. In Fig. 1(a-b) we have plotted the magnitude of and as a function of perturbation wavevector for material redistribution in both phases, where is the typical liquid lifetime. Due to the thickness dependency of several of these mechanisms, we have compared transport mechanisms in a and a Co film.
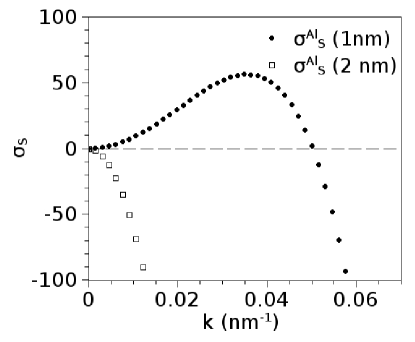
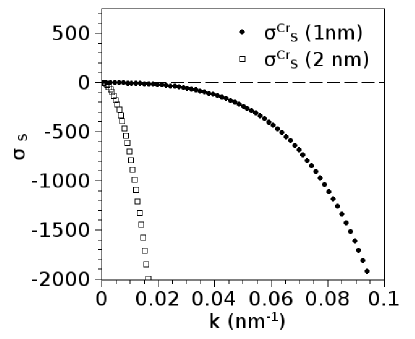
In the case of a film, the stability of the solid film is strongly dependent on the choice of the Hamaker coefficient , which dictates the magnitude of the disjoining pressure. When using the experimentally determined value of Favazza et al. (2006c) in eq. 7, the film is unstable and there exists a characteristic wavelength that will grow the fastest. The dispersion curve for growth/decay rates of perturbations in the solid state has been shifted to larger wavelengths, as compared to that for the TFH instability, as shown in Figure 1(a). In this case the cut-off and the fastest growing wavelengths have been increased due to the stabilizing effects of volume diffusion and evaporation-condensation. In the absence of of these effects and are the same for both the solid and liquid states. The importance of the magnitude of the dispersion term on mass transport can be seen if one uses the lower limit of the Hamaker coefficient for metals Israelachvili (1985). When a theoretically estimated was employed, the disjoining pressure was not large enough to destabilize the solid film; but rather, the film was seen to be stable against perturbations of all wavelengths. For a film, the dispersion forces with are not large enough to instigate a dewetting instability in the solid film, as shown if Figure 1(b). For the length scales stemming from a TFH instability, , thereby confirming that hydrodynamic flow is the more dominant mass transport mechanism during pulsed laser melting. We obtained similar results for a variety of metals suggesting that this is a general result, applicable to most thin metal films. Most metals investigated have similar diffusion rates, but the evaporation rates vary greatly. Figs. 2(a-b) show plots of dispersion curves for two extreme scenarios, one metal (Al) with a low evaporation rate and the other (Cr) with a large rate. In both cases, films with are seen to be stable to small perturbation of all wavelengths.
There are several implications manifested in these results. First, the timescales of solid state process are much larger than the timescales associated with hydrodynamic flow. Therefore, the quenched-in structures from the pulsed laser melting and resolidification are likely unchanged during the cooling period. This conclusion is corroborated by experimental observations of pattern formation in ultrathin metal films by using multiple pulses of ( wavelength, pulsed) ultraviolet (UV) laser irradiation: see Favazza et al. (2006b, a, c); Trice et al. (2007); Favazza et al. (2007) for details. A variety of metal thin films, including Co, Fe, Cu, Ag, Ni and Pt, were deposited under ultrahigh vacuum ( Torr) by e-beam evaporation or pulsed laser deposition onto commercially obtained SiO/Si substrates with the thermally grown oxide layer of 400 nm thickness. Film thicknesses ranged from nm. The initial films had an average surface roughness as evaluated by atomic force microscopy. Following deposition, the films were irradiated at various laser energies above a threshold energy density such that appreciable surface deformation was observed for various irradiation times, as measured by the number of pulses ranging from . Following such irradiation, the surface morphology and concentration of metal was evaluated by imaging and energy dispersive X-ray spectrometry in a scanning electron microscope, respectively. It was found that all the metals possessed a thickness-dependent threshold energy density above which substantial surface changes were observed. However, for energies below this threshold, no surface roughening was visible even after the longest irradiation times of 10,500 pulses. This energy threshold has been attributed to the energy required to melt the films Trice et al. (2007). By irradiating films with a laser energy density above the melt threshold, we performed detailed studies of the dynamics of the pattern evolution for Co films as a function and found that the dewetting patterns showed characteristic film-thickness dependent length scales and spatial order consistent with the predictions of eq. 9. Hence, despite the much larger time spent in the solid phase (i.e. cooling period), the overall contribution from solid state transport was inferred to be negligible.
V Thermal Stress
Since we focus on the dynamics of perturbed thin films on amorphous substrates, the prevalent stresses that are present in the film are thermally generated. Due to the mismatch in the thermal expansion coefficients between the film and the substrate, the film is under compressive stress while it is heated and a tensile stress when it is cooling. This stress is given by the following expression:
| (10) |
where is the thermal expansion coefficient, is Poisson’s ratio, is Young’s modulus, is the thickness of the layer, is the temperature change, and the subscripts and denote the film and substrate quantities, respectively Ohring (1992). In the limiting case where , the preceding expression reduces to:
| (11) |
Stresses related to thermal expansion for most thin metal films on a silica substrate are on the order of a few . However, they are still lower than the critical value required to initiate a buckling instability in the film, which is given by the following equation:
| (12) |
where is a constant. Typical critical stress values range from . Stress can also result from an anisotropic temperature distribution in the film Dawson (1976). This could arise in pulsed laser processing. As described above, the thickness variations caused by the TFH instability are quenched in during the rapid resolidification phase. Hence, in the solidified deformed film, a non-uniform temperature profile could prevail for times comparable to the diffusion time scale Trice et al. (2007). Within the context of linear theory of elasticity, the thermoelastic stress will also decay at the same rate as the the temperature profile in the film Dawson (1976). Hence a characteristic time scale of temperature/stress diffusion can be estimated by solving the transient heat equation for a 2-dimensional film:
| (13) |
where , , and are the density, heat capacity and thermal conductivity of the film, respectively. Assuming an initial sinusoidal temperature profile in the lateral (x) direction and a uniform temperature distribution throughout the thickness (z direction) of the film, one finds the following relationship for the time dependent component of the temperature, , in which the temperature, :
| (14) |
is the thermal diffusivity of the film, is the wavevector of the perturbation, is a constant between and and , , and are the density, heat capacity and thermal conductivity of the substrate, respectively. Since the length scale of the periodic thickness variations is being imprinted on the film in the liquid state, one can take the expected value of for a corresponding from TFH theory. Using these values , the timescale during which this stress could influence solid state mass transport is on the order of a picosecond for a perturbation wavelength, and on the order of a nanosecond for . These timescales are too short to appreciably effect any solid state process in modifying the surface of the film.
VI Conclusion
We have developed a mathematical model to describe thin film dynamics on amorphous surfaces by incorporating the effects of surface/volume diffusion, evaporation-condensation and dispersion forces. New results are presented for volume diffusion in thin films. Specifically, for < < 1, the decay rate of surface perturbations by this mechanisms is proportional to as compared to for bulk materials. It is shown that depending on the magnitude of the Hamaker coefficient, ultrathin solid films with thickness < 2 nm could be prone to pattern forming instabilities while films with thickness > 2 nm are predicted to be stable for a variety of metals. The model was applied to analyze the role of solid state mass transport mechanisms on the dynamics of thin films processed by pulsed laser irradiation. The upper limits for the time constants associated with the decay of surface perturbations in the solid state was found to be much smaller compared to the time interval between subsequent pulses. Further, a qualitative analysis of thermoelastic stress dissipation in the film-substrate bilayer system showed that the time scale of stress relaxation is much smaller than the pulse duration. These findings suggest that contributions to the changes in surface deformation from solid state processes are minimal and the pattern formation occurs through a hydrodynamic instability that is followed by laser melting of the film, an observation corroborated by experimental observations.
Acknowledgements
RK and RS acknowledges support by the National Science Foundation through grant CAREER DMI-0449258 and CTS-0335348, respectively. CF acknowledges valuable contributions from Hare Krishna.
References
- McHenry and Laughlin (2000) M. E. McHenry and D. E. Laughlin, Acta Mater. 48, 223 (2000).
- Shipway et al. (2000) A. N. Shipway, E. Katz, and I. Willner, Phys. Chem. 1, 18 (2000).
- Xia et al. (2003) Y. Xia, P. Yang, Y. Sun, Y. Wu, B. Mayers, B. Gates, Y. Yin, F. Kim, and H. Yan, Adv. Mat. 15, 353 (2003).
- Raty et al. (2005) J.-Y. Raty, F. Gygi, and G. Galli, Phy. Rev. Lett. 95, 096103 (2005).
- Mullins (1957) W. W. Mullins, J. Appl. Phys. 28, 333 (1957).
- Nichols and Mullins (1965) F. A. Nichols and W. W. Mullins, Trans. Metall. Soc. AIME 223, 1840 (1965).
- Mullins (1959) W. W. Mullins, J. Appl. Phys. 30, 77 (1959).
- Espinosa et al. (2006) J. Espinosa, H. Shi, and D. Lederman, J. Appl. Phys. 99, 023516 (2006).
- Cahill (2003) D. G. Cahill, J. Vac. Sci. Tech. A 21, 110 (2003).
- Bartelt (2002) N. C. Bartelt, MRS Bull. pp. 961–966 (2002).
- Tritscher (1999) P. Tritscher, Proc. Roy. Soc. Lond. A 455, 1957 (1999).
- Timsit (1990) R. S. Timsit, IEEE Trans. Comp. Hybrids Manu. Tech. 13, 65 (1990).
- Ogasawara (2003) Y. Ogasawara, J. Phys. Soc. Jpn. 72, 1871 (2003).
- Spencer et al. (1991) B. J. Spencer, P. W. Voorhees, and S. H. Davis, Phys. Rev. Lett. 67, 3696 (1991).
- Lu and Suo (2001) W. Lu and Z. Suo, J. Mech. Phys. Solids 49, 1937 (2001).
- LeGoues et al. (1990) F. K. LeGoues, V. P. Kesan, S. S. Iyer, J. Tersoff, and R. Tromp, Phys. Rev. Lett. 64, 2038 (1990).
- Jensen (1999) P. Jensen, Rev. Mod. Phys. 71, 1695 (1999).
- Favazza et al. (2006a) C. Favazza, J. Trice, H. Krishna, R. Kalyanaraman, and R. Sureshkumar, Appl. Phys. Lett. 88, 1531181 (2006a).
- Favazza et al. (2006b) C. Favazza, J. Trice, A. Gangopadhyay, H. Garcia, R. Sureshkumar, and R. Kalyanaraman, J. Elec. Mat. 35, 1618 (2006b).
- Favazza et al. (2006c) C. Favazza, R. Kalyanaraman, and R. Sureshkumar, Nanotechnology 17, 4229 (2006c).
- Trice et al. (2007) J. Trice, D. Thomas, C. Favazza, R. Sureshkumar, and R. Kalyanaraman, Phys. Rev. B 75, 235439 (2007).
- Suo and Zhang (1998) Z. Suo and Z. Zhang, Phys. Rev. B 58, 5116 (1998).
- Bischof et al. (1996) J. Bischof, D. Scherer, S. Herminghaus, and P. Leiderer, Phys. Rev. Lett. 77, 1536 (1996).
- Herring (1950) C. Herring, J. Appl. Phys. 21, 301 (1950).
- Vrij (1966) A. Vrij, Disc. Farad. Soc. 42, 23 (1966).
- Vrij and Overbeek (1968) A. Vrij and J. T. G. Overbeek, J. Am. Chem. Soc. 90, 3074 (1968).
- de Gennes et al. (2004) P. de Gennes, F. Brochard-Wyart, and D. Quere, Capillarity and Wetting Phenomena: Drops, Bubbles, Pearls, Waves (Springer, New York, 2004).
- Kondic (2003) L. Kondic, SIAM Rev. 45, 95 (2003).
- Sharma and Ruckenstein (1986) A. Sharma and E. Ruckenstein, Langmuir 2, 480 (1986).
- Reiter (1992) G. Reiter, Phys. Rev. Lett. 68, 75 (1992).
- Flynn (2006) C. P. Flynn, J. Phys. Cond. Matt. 18, S439 (2006).
- Israelachvili (1985) J. N. Israelachvili, Intermolecular And Surface Forces: With Applications to Colloidal and Biological Systems (Academic Press Inc., Orlando, 1985).
- Favazza et al. (2007) C. Favazza, J. Trice, R. Sureshkumar, and R. Kalyanaraman, Mater. Res. Soc. Symp. Proc. (MRS, Warrendal, PA, 2007), vol. 960, 0960-N02-02.
- Ohring (1992) M. Ohring, The Materials Science of Thin Films (Academic Press, San Diego, CA, 1992).
- Dawson (1976) T. H. Dawson, Theory and Practice of Solid Mechanics (Plenum Press, New York, 1976).