Rate-dependent slip boundary conditions for simple fluids
Abstract
The dynamic behavior of the slip length in a fluid flow confined between atomically smooth surfaces is investigated using molecular dynamics simulations. At weak wall-fluid interactions, the slip length increases nonlinearly with the shear rate provided that the liquid/solid interface forms incommensurable structures. A gradual transition to the linear rate-dependence is observed upon increasing the wall-fluid interaction. We found that the slip length can be well described by a function of a single variable that in turn depends on the in-plane structure factor, contact density and temperature of the first fluid layer near the solid wall. Extensive simulations show that this formula is valid in a wide range of shear rates and wall-fluid interactions.
pacs:
83.50.Rp, 47.61.-k, 83.10.Rs, 47.85.lbI Introduction
The interest in modeling of fluid flow in confined geometries has recently been revived because of the need for optimal design of micro- and nanofluidic devices Darhuber05 . For systems with large surface to volume ratio, the fluid flow can be significantly affected by slip at the liquid/solid interface. The existence of slip and its degree strongly depend on structural and dynamical properties of the interface. The most commonly used Navier model for the partial slip boundary conditions states that the liquid slip velocity is proportional to the rate of shear normal to the surface. The proportionality coefficient, so-called slip length, is defined as an extrapolated distance from the wall where the fluid tangential velocity component vanishes. Alternatively, a ratio of fluid viscosity to the slip length determines a friction coefficient at the liquid/solid interface, which relates the interfacial shear stress and fluid slip velocity. The slip is augmented for specially designed superhydropobic surfaces Rothstein04 ; Vorobieff06 , high polymer weights LegerPRL93 ; MackayVino , hydrophobic surfaces with trapped nanobubbles Ishida00 ; Tyrrell01 ; Steitz03 and high shear rates Nature97 ; Granick01 ; CraigPRL01 ; Breuer03 . On the other hand, surface roughness Granick02 ; Leger06 and hydrophilic surfaces Charlaix05 ; Vinograd06 usually lead to a reduction of slip. In spite of the long standing interest in slip behavior, it is not yet clear how the slip length depends on the local shear rate and on microscopic parameters of the interface.
In the last two decades, molecular dynamics (MD) simulations were used to examine flow boundary conditions for simple fluids confined between atomically flat walls Thompson90 ; KB89 ; Barrat94 ; Barrat99 ; Barrat99fd ; Cieplak01 ; Quirke01 . The boundary conditions are very sensitive to the wetting properties and molecular roughness of the surface, as well as to the liquid structure near the wall. In general, the slip is enhanced for weak wall-fluid interactions and incommensurable periodic structures of the surface potential and the first fluid layer. The slip length was found to correlate with the degree of the surface induced order in the adjacent fluid layer and wall-fluid interaction energy Thompson90 . Recently, Barrat and Bocquet Barrat94 ; Barrat99fd have performed a detailed analysis based on the Green–Kubo relation for the friction coefficient at the interface to derive a scaling relation for the slip length dependence on density, collective diffusion coefficient and structure factor of the first fluid layer near the wall at equilibrium. Dynamics of the first layer of liquid molecules near the wall is closely related to the friction of a monolayer of adsorbed particles sliding along a solid substrate Smith96 ; Tomassone97 ; Ellis04 . Molecular scale corrugations reduce the effective slip length in cases of periodic wall roughness Barrat94 ; Priezjev06 , chemically patterned surfaces Priezjev05 , and atomic roughness due to the variable size of the wall atoms Attard04 .
While most of the studies have investigated how a variation of surface energy and roughness affects boundary conditions, the dynamic behavior of the slip length with increasing shear rate has received much less attention. Difficulties in analysis of the effective slip arise from a combination of different factors, such as surface roughness, wettability and rate-dependency, which produce non-equal or even opposite effects on the fluid flow near the boundary. For example, in non-wetting systems, a reduction of the slip length due to surface roughness might be compensated by rate-dependent effects Granick02 . Thus, the understanding of the dynamic behavior of the slip length is important for both the interpretation of experimental results for flows past rough surfaces Vinograd06 ; BonaccursoRev05 and modeling fluid flows in microfluidic channels KarniBeskok .
Molecular dynamics simulations Nature97 of simple fluids undergoing planar shear flow past atomically smooth surfaces have shown that the slip length increases nonlinearly with the shear rate, and the usual Navier slip condition is only valid in a limit of low shear rates. A later study Priezjev04 demonstrated that nonlinear boundary conditions could also describe the flow of complex fluids which consist of short polymer chains. A transition from negative to positive slip with varying shear rate in Poiseuille flows of simple fluids was observed for atomically rough hydrophilic surfaces, while at smaller wall-fluid interactions, the slip length increased approximately linearly with shear rate Fang05 . Experimental studies have also reported rate-dependent slip for Newtonian liquids in pressure driven flows in hydrophobic microchannels Breuer03 and thin film drainage in the surface force apparatus Granick01 . Currently, there is no consensus regarding the functional form of the rate-dependent slip length and the existence of a shear rate threshold. As a consequence, this prevents the analysis of more complex systems involving combined effects of surface roughness, wettability and rate-dependency.
The focus of this paper is to explore the influence of the wall-fluid interaction energy and shear rate on slip flow of simple fluids driven by a constant force. We will show that for strong wall-fluid interactions the slip length increases linearly with the shear rate provided the liquid/solid interface forms incommensurable structures. A gradual transition in rate-dependence of the slip length, from linear to highly nonlinear, is observed upon reducing the strength of wall-fluid interactions. A detailed analysis of the fluid structure near the solid wall shows that in a wide range of shear rates and wall-fluid interactions the slip length can be expressed as a function of a single variable that depends on the in-plane structure factor, contact density and temperature of the adjacent fluid layer.
This paper is organized as follows. In the next section, we describe details of molecular dynamics simulations. Predictions from the continuum hydrodynamics are briefly summarized in Section III. Simulation results for the fluid structure and the slip length are presented in Section IV. The summary and conclusions are given in the last section.
II Simulation model
The computational domain consists of a monoatomic fluid confined between two atomistic walls. The fluid molecules interact through the pairwise Lennard-Jones (LJ) potential
| (1) |
where and represent the energy and length scales of the fluid phase. For computational efficiency the cutoff distance is set to . The LJ wall-fluid interaction energy and the length scale are measured in units of and , respectively. In all our simulations, wall atoms do not interact with each other and their diameter is equal to . A constant volume accessible to molecules corresponds to the fluid density .
The planar Poiseuille flow was generated by a constant external force in the direction, which was added to the equation of motion for each fluid molecule. The heat exchange between the fluid and an external reservoir was regulated by a Langevin thermostat with a random force and a damping term with friction coefficient . This value of the friction coefficient is small enough not to influence significantly dynamics of fluid molecules Grest86 ; GrestJCP04 . The damping term was only applied to the coordinate to avoid a bias in the flow direction Thompson90 . All three components of the equations of motion for a fluid molecule of mass are given by
| (2) | |||||
| (3) | |||||
| (4) |
where is a randomly distributed force with zero mean and variance, , determined from the fluctuation-dissipation relation. The temperature of the Langevin thermostat is set to , where is the Boltzmann constant. The equations of motion are integrated using the fifth order gear-predictor algorithm Allen87 with a time step , where is the characteristic LJ time.
The upper and lower walls of the cell each consisted of 648 atoms distributed between two (111) planes of the face-centered cubic (fcc) lattice. A fixed wall density corresponds to a nearest-neighbor distance between equilibrium positions of wall atoms in the plane. The distance between planes containing wall atoms in a contact with the fluid was set to a constant value of . The dimensions of the cell in the plane were fixed to . Periodic boundary conditions were applied along the and directions.
The steady state Poiseuille flow was induced by a constant force in the direction, while both the lower and upper walls remained stationary. Initially, fluid molecules were uniformly distributed on the centers of the fcc lattice. After an equilibration period of , an external force was gradually increased from zero to its final value corresponding to a steady state flow during next . After an additional equilibration of about , fluid velocity profiles were averaged within slices of the computational domain of thickness for a time interval up to . Fluid density profiles were computed within slices of thickness for a time period .
Fluid density and interaction parameters used in this study correspond to the fluid viscosity , which was found to be shear rate independent in a range Nature97 ; Priezjev04 . The upper estimate of the Reynolds number (based on the maximum difference in fluid velocities at the center and near walls, fluid viscosity, and channel width) is , indicating laminar flow conditions.
III Hydrodynamic predictions
For the planar Poiseuille flow under an externally applied force in the direction, the solution of the Navier-Stokes equation is described by a parabolic velocity profile KarniBeskok
| (5) |
where the fluid viscosity is assumed to be shear rate independent. The boundary conditions for the fluid velocity are prescribed at the confining parallel walls, . The shear rate at the liquid/solid interface relates the fluid slip velocity and the slip length as follows
| (6) |
A quantity of interest for experimental measurements, the flow rate, can be evaluated by integrating the fluid velocity profile, Eq. (5), across the channel width
| (7) |
where the second term represents a correction to the flow rate due to slip boundary conditions. A relative increase in the flow rate due to slip can also be expressed in terms of the slip length and the distance between confining walls
| (8) |
Fluid velocity profiles obtained from MD simulations will be compared with the hydrodynamic predictions, Eq. (5), in the next section. Parameters of the liquid/solid interface correspond to a flow regime, where the slip length is comparable with the channel width, ; and, therefore, the flow rate strongly depends on the boundary conditions.
IV Results
IV.1 Fluid structure near the walls
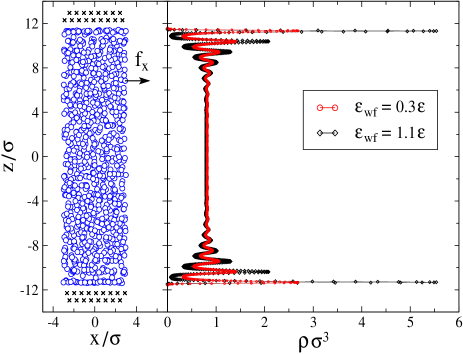
Dynamical and structural properties of a fluid can be significantly affected by the presence of a solid substrate Israel92 . A flat solid wall constrains the motion of fluid molecules in a normal direction and induces oscillations in the fluid density profile. Typically, these density oscillations gradually decay within a few molecular diameters away from the wall. The spatial distribution of molecules near the wall becomes non-isotropic and consists of fluid layers with thickness of about a molecular diameter. Although a large amplitude of density oscillations near the wall is a signature of a high surface attraction energy, the enhanced layering does not necessarily correlate with a reduction of the fluid slippage at the interface. For example, a highly attractive surface potential free of lateral corrugations would induce substantial fluid layering, which can be interpreted as an infinite slip. In our simulations, density oscillations relax to a uniform bulk profile within away from the wall, see Fig. 1. As expected, the higher surface attraction energy causes a more pronounced fluid layering.
In general, the fluid layer closest to the flat wall has the largest degree of in-plane order characterized by the structure factor , where is a two-dimensional vector of a molecule position and is the total number of molecules within the adjacent layer. Factors affecting the in-plane order include a correlation between fluid molecules near the wall and the energy landscape of the surface potential. The degree of the surface induced order depends on a mismatch between the wall lattice constant and the nearest-neighbor distance in the adjacent fluid layer. If the wall-fluid interaction is comparable with the fluid-fluid energy scale , then commensurable wall-fluid structures would typically result in stick boundary conditions, or even fluid epitaxial locking, while incommensurable structures would likely produce more slippage Thompson90 ; Attard04 .
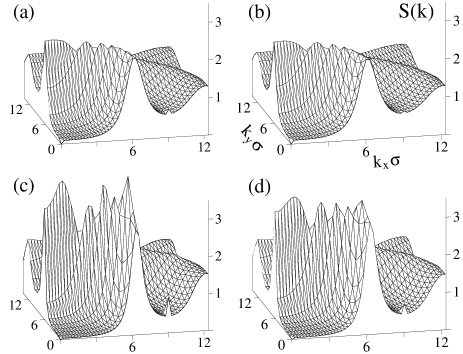
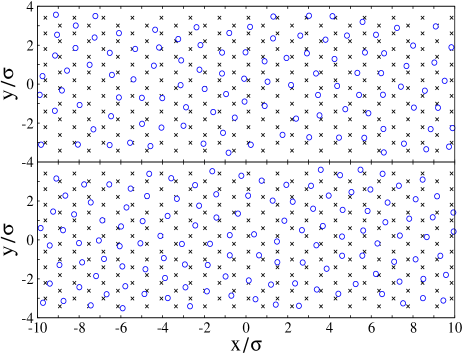
In this study, the liquid and solid phases form an interface with a mismatch between neighboring distance within the first fluid layer (of about ) and a lattice constant in the plane, . Figure 2 shows instantaneous snapshots of molecular positions in a fluid layer adjacent to the lower wall for the highest () and the lowest () wall-fluid interaction energies. In the later case, the averaged structure factor within the first layer exhibits typical short-range fluid ordering characterized by a circular ridge at with an amplitude , see Fig. 3. For , the surface induces higher short-range order, which is enhanced along the crystal axes in the plane. The height of the largest peak in Fig. 3 (a) is . A smaller peak of the in-plane structure factor due to periodic surface potential corresponds to the first reciprocal lattice vector , see Fig. 3 (a) – (d). The amplitude of the peak at decreases at larger values of the external force. A correlation between surface induced order in the first fluid layer and the slip length will be discussed in the next subsection.
IV.2 Fluid velocity profiles and slip length
The magnitude of the external force, which is required to reach a parabolic velocity profile described by Eq. (5), depends on the fluid viscosity, density and wall-fluid interaction parameters Barrat99 ; KB89 ; Cieplak01 ; Quirke01 ; Fang05 . Since the slip velocity is not known a priori, the value of the force in MD simulations is usually adjusted so that a fluid velocity profile could be accurately resolved without an excessive computational effort due to thermal averaging. One of the goals of this study is to systematically explore the effect of an applied force on a flow of simple fluids near solid boundaries and to determine a variation of the slip length as a function of shear rate. In our simulations, the channel width, , is large enough to avoid extreme confinement conditions Bitsanis90 ; Travis97 ; Travis00 , where deviations from macroscopic hydrodynamics are expected.
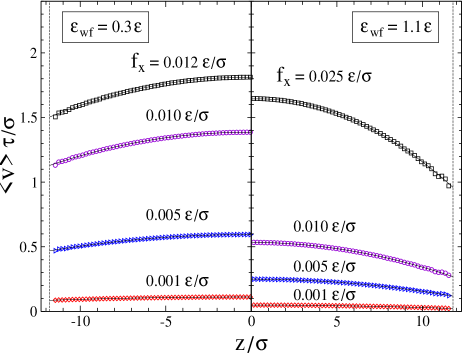
Examples of averaged velocity profiles for different values of the external force and fixed wall-fluid interaction energies, and , are shown in Fig. 4. The data are presented only in half of the channel because of the symmetry with respect to plane, . Fluid velocity profiles are well fitted by a parabola as expected from the hydrodynamic predictions, see Eq. (5). Weak oscillations within near the walls correspond to a pronounced fluid layering perpendicular to the surface. In a range of wall-fluid interaction energies considered in this study, , fluid flow undergoes slippage at the solid walls. Fluid velocity in the channel and at the interfaces increases with the applied force. The shear viscosity, , which was computed from the Kirkwood relation Bird87 , remained independent of the applied force.
A ratio between fluid slip velocity and the local shear rate at the interface defines the slip length, denoted by throughout. For the parabolic profiles, the slip length was evaluated by linear extrapolation of the slope at the interface to zero velocity. In our simulations, the position of the interface in the direction is defined at a distance away from the fcc lattice planes, see vertical dashed lines in Fig. 4. This offset was chosen to account for the excluded volume due to wall atoms. The slip length was defined as the average of values extracted at the top and the bottom walls.
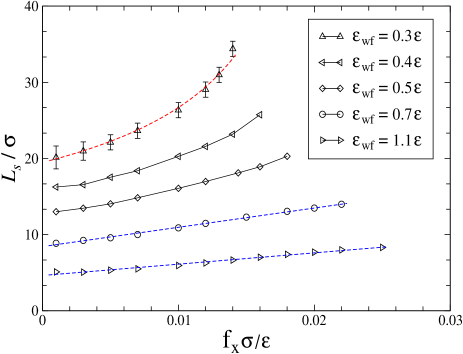
The dynamic response of the slip length as a function of the external force is presented in Fig. 5. A gradual transition in the functional dependence of is observed by varying the strength of the wall-fluid interaction. The slip length increases monotonically with the applied force for . The data can be well fitted by a straight line, see Fig. 5. At lower surface energies, , the relation between and becomes nonlinear and exhibits a pronounced downward curvature for . For each curve shown in Fig. 5, a ratio of maximum slip length to its value at small applied forces is equal to . This factor determines an upper bound for the increase in the flow rate due to slip dependence on the applied force. Given the fixed channel width used in our study, the maximum relative gain in the flow rate due to variation of the slip length with the force is for and for . These results suggest that a significant drag reduction for laminar flows can be achieved through the increase in the pressure difference across a microfluidic channel.
In the original paper by Thompson and Troian Nature97 on shear flow of simple fluids, the slip length was found to increase nonlinearly with the shear rate. In a range of accessible shear rates and weak wall-fluid interactions, the MD data were well described by a power law function
| (9) |
where and are fitting parameters. In our simulations, the shear rate is proportional to the external force, see Eq. (5), and, therefore, the analogous expression for the slip length dependence on the applied force should be . This form was used to fit the data for the lowest wall-fluid interaction energy , see dashed curve in Fig. 5. The agreement is rather good in the range of applied forces .
For each curve presented in Fig. 5, the external force was varied from up to a maximum value, which depends on . This value of the force corresponds to a maximum shear stress the liquid/solid interface can support. With a further increase of the force, the fluid flow acquires a large velocity component in the direction, , where is the thermal fluid velocity. In this extreme regime, the dynamics of fluid molecules near walls cannot be resolved accurately with the integration time step used in this study. We note, however, that test runs with a smaller time step did not produce noticeable changes in the results presented in Fig. 5. The transition to the flow regime characterized by very large slip velocities is not the main focus of this paper and, therefore, it was not studied in detail.
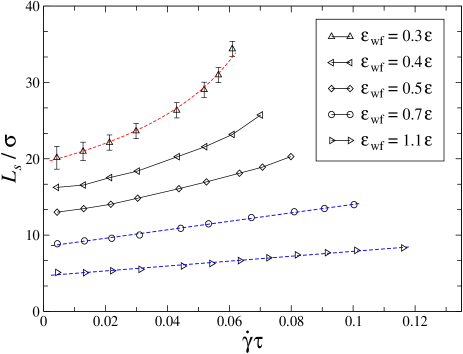
The parabolic shape of the fluid velocity profiles implies that the external force is proportional to the interfacial shear rate, see Eq. (5). The functional dependence of the slip length, therefore, is expected to be similar for and the local shear rate. Figure 6 shows the same MD data as in Fig. 5, but replotted in the axis versus local shear rate, as extracted from parabolic velocity profiles at the location of interfaces. The range of shear rates is below the values reported for laminar flows in Ref. Thompson90 . The slip length increases with shear rate, and the growth of is enhanced at lower values of . The dependence for can be well fitted by the power law function, Eq. (9), with and , see dashed curve in Fig. 6. Thus, for a weak wall-fluid interaction our results are in agreement with those reported in a previous study Nature97 on dynamical behavior of the slip length in boundary driven flows. Furthermore, at higher surface energies, , the slip length increases linearly with the interfacial shear rate, see Fig. 6. In this regime, the simulations results might be relevant to a monotonic growth of the slip length with the shear rate measured in pressure driven flows in hydrophobic microchannels Breuer03 . Finally, in contrast to our results, a transition from the linear to the power law rate-dependence upon increasing the strength of wall-fluid interactions was reported in Ref. Fang05 . The difference in the slip behavior might be explained by the lower fluid density and higher shear rates examined in that study Fang05 .
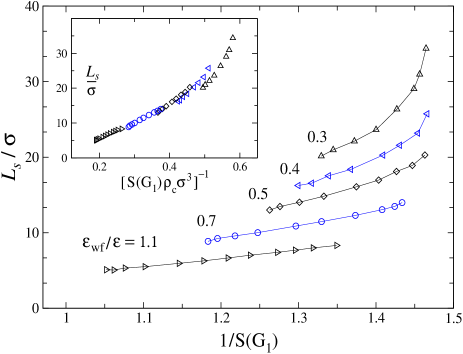
Molecular-scale corrugations of a solid wall composed of periodically arranged LJ atoms induce in-plane order in the adjacent fluid layer. The amount of surface induced order in the first fluid layer is reflected in the fluid in-plane structure factor. A correlation between the slip length in a shear rate independent regime and the peak value of the fluid structure factor evaluated at the first reciprocal lattice vector was established earlier Thompson90 ; Barrat99fd . In this study, the peak of the structure factor at the first reciprocal lattice vector is displaced from the circular ridge at the vector , see Fig. 3. The magnitude of the peak at decreases with increasing slip velocity. Figure 7 shows the behavior of the slip length as a function of the inverse value of the structure factor. For the largest wall-fluid interaction energy the slip length increases linearly with . At lower surface energies, the function deviates from the linear dependence and increases more rapidly for . These results demonstrate that the slip length in a shear rate dependent regime strongly correlates with the surface induced order in the fluid layer adjacent to the wall.
In a zero shear limit, the Green–Kubo analysis for the friction coefficient at the liquid/solid interface shows that for attractive wall-fluid interactions the slip length depends on the structure factor, contact density, diffusion coefficient and temperature of the first fluid layer Barrat99fd . In our simulations, the equilibrium fluid density and temperature profiles near the wall are modified at higher shear rates. The contact density, , was determined from the maximum of the fluid density profile in the first fluid layer, see Fig. 1. The contact density increases with the strength of wall-fluid interaction and decreases with shear rate. In the inset of Fig. 7 the slip length is plotted against an inverse product of the structure factor and the contact density. Except for the lowest wall-fluid interaction energy, , the functional form of the slip length consists of nearly linear interconnected segments each characterized by its own value of .
The data for the slip length for different wall-fluid interaction energies and shear rates can be collapsed onto a single master curve by taking into account a variation in temperature of the first fluid layer. In a steady state flow induced by a constant force, fluid temperature was computed from the kinetic energy
| (10) |
where is a three-dimensional vector of a molecule position and is the local average flow velocity. At low shear rates, , the fluid temperature remains equal to that imposed by the Langevin thermostat, , and it increases slightly at higher . The maximum relative increase of is about for each value of . The heatup is larger near the walls because of the higher shear rates and the slip velocity, which becomes comparable to the thermal fluid velocity, see Fig. 4. Temperature of the first fluid layer, , rises by about at the highest shear rates reported in Fig. 6.
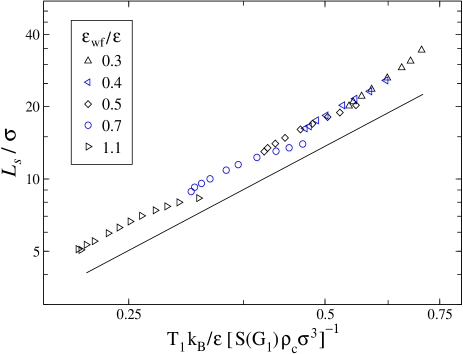
Figure 8 shows the slip length as a function of a combined ratio of temperature to the product evaluated in the first fluid layer. In a wide range of shear rates and for , the slip length is well described by a power law function
| (11) |
with . A solid line in Fig. 8 corresponds to the value . This result implies that the condition defines a curve on the plane and characterized by a constant slip length. The functional dependence of the slip length, Eq. (11), can also be determined from equilibrium measurements of for different surface energies . This prediction is in qualitative agreement with previous MD results Thompson90 ; Barrat99fd , which demonstrated that the slip length decreases with the contact density and surface induced order in the adjacent fluid layer. A strong correlation between the slip length and microscopic properties of the first fluid layer provides a framework for the analysis of systems with combined effects of wettability and rate-dependency.
V Conclusions
In this paper the effect of surface energy and shear rate on the slip length in a flow of simple fluids was studied by molecular dynamics simulations. Fluid velocity profiles in steady state flow induced by a constant force were fitted by a parabola with a shift by the value of the slip velocity. The slope of the parabolic fit at the interface was used to define the local shear rate. For a weak wall-fluid interaction the slip length increases nonlinearly with the shear rate and its dependence can be well fitted by a power law function. Increasing the strength of wall-fluid interactions leads to the linear rate-dependence of the slip length. For a fixed channel width, the flow rate increases significantly due to the rate-dependence of the slip length for both weak and strong wall-fluid interactions. Simulation results also indicate a strong correlation between the slip length and the surface induced order in the first fluid layer in a shear rate-dependent regime. We showed that in a wide range of wall-fluid interaction energies and shear rates the slip length is well described by a function of a single variable that depends on the in-plane structure factor, contact density and temperature of the first fluid layer.
Future work will show how sensitive these results are to the variation of molecular-scale roughness. The surface induced order in the adjacent fluid layer and the slip length might be affected by the presence of substrate inhomogeneities. The effect of thermal, random and periodically corrugated surfaces on slip behavior in a rate-dependent regime should be explored.
Acknowledgments
Financial support from the Michigan State University Intramural Research Grants Program is gratefully acknowledged. The author thanks S. M. Troian, A. A. Darhuber and L. Bocquet for useful discussions and P. A. Thompson for kindly sharing his source code. Computational work in support of this research was performed at Michigan State University’s High Performance Computing Facility.
References
- (1) A. A. Darhuber and S. M. Troian, Annu. Rev. Fluid Mech. 37, 425 (2005).
- (2) J. Ou, B. Perot, and J. P. Rothstein, Physics of Fluids 16, 4635 (2004).
- (3) R. Truesdell, A. Mammoli, P. Vorobieff, F. van Swol, and C. J. Brinker, Phys. Rev. Lett. 97, 044504 (2006).
- (4) K. B. Migler, H. Hervet and L. Leger, Phys. Rev. Lett. 70, 287 (1993).
- (5) R. G. Horn, O. I. Vinogradova, M. E. Mackay, N. Phan-Thien, J. Chem. Phys. 112, 6424 (2000).
- (6) N. Ishida, T. Inoue, M. Miyahara, and K. Higashitani, Langmuir 16, 6377 (2000).
- (7) J. W. G. Tyrrell and P. Attard, Phys. Rev. Lett. 87, 176104 (2001).
- (8) R. Steitz, T. Gutberlet, T. Hauss, B. Klösgen, R. Krastev, S. Schemmel, A. C. Simonsen, and G. H. Findenegg, Langmuir 19, 2409 (2003).
- (9) P. A. Thompson and S. M. Troian, Nature (London) 389, 360 (1997).
- (10) Y. Zhu and S. Granick, Phys. Rev. Lett. 87, 096105 (2001).
- (11) V. S. J. Craig, C. Neto, and D. R. M. Williams, Phys. Rev. Lett. 87, 054504 (2001).
- (12) C. H. Choi, K. J. A. Westin, and K. S. Breuer, Phys. Fluids 15, 2897 (2003).
- (13) Y. Zhu and S. Granick, Phys. Rev. Lett. 88, 106102 (2002).
- (14) T. Schmatko, H. Hervet, and L. Leger, Langmuir 22, 6843 (2006).
- (15) C. Cottin-Bizonne, B. Cross, A. Steinberger, E. Charlaix, Phys. Rev. Lett. 94, 056102 (2005).
- (16) O. I. Vinogradova and G. E. Yakubov, Phys. Rev. E 73, 045302 (2006).
- (17) P. A. Thompson and M. O. Robbins, Phys. Rev. A 41, 6830 (1990).
- (18) J. Koplik, J. R. Banavar, and J. F. Willemsen, Phys. Fluids A 1, 781 (1989).
- (19) L. Bocquet and J.-L. Barrat, Phys. Rev. E 49, 3079 (1994).
- (20) J.-L. Barrat and L. Bocquet, Phys. Rev. Lett. 82, 4671 (1999).
- (21) J.-L. Barrat and L. Bocquet, Faraday Discuss. 112, 119 (1999).
- (22) M. Cieplak, J. Koplik, J. R. Banavar, Phys. Rev. Lett. 86, 803 (2001); Physica A 287, 153 (2000).
- (23) V. P. Sokhan, D. Nicholson, and N. Quirke, J. Chem. Phys. 115, 3878 (2001).
- (24) E. D. Smith, M. O. Robbins, and M. Cieplak, Phys. Rev. B 54, 8252 (1996).
- (25) M. S. Tomassone, J. B. Sokoloff, A. Widom, J. Krim, Phys. Rev. Lett. 79, 4798 (1997).
- (26) J. S. Ellis and M. Thompson, Phys. Chem. Chem. Phys. 6, 4928 (2004).
- (27) N. V. Priezjev and S. M. Troian, J. Fluid Mech. 554, 25 (2006).
- (28) N. V. Priezjev, A. A. Darhuber, and S. M. Troian, Phys. Rev. E 71, 041608 (2005).
- (29) T. M. Galea and P. Attard, Langmuir 20, 3477 (2004).
- (30) C. Neto, D. R. Evans, E. Bonaccurso, H. J. Butt, and V. S. J. Craig, Rep. Prog. Phys. 68, 2859 (2005).
- (31) G. E. Karniadakis, A. Beskok, and N. Aluru, Microflows and Nanoflows: Fundamentals and Simulation, (Springer, New York, 2005).
- (32) N. V. Priezjev and S. M. Troian, Phys. Rev. Lett. 92, 018302 (2004).
- (33) S. C. Yang and L. B. Fang, Molecular Simulation 31, 971 (2005).
- (34) G. S. Grest and K. Kremer, Phys. Rev. A 33, 3628 (1986).
- (35) M. Tsige and G. S. Grest, J. Chem. Phys. 120, 2989 (2004).
- (36) M. P. Allen and D. J. Tildesley, Computer Simulation of Liquids (Claredon, Oxford, 1987).
- (37) J. N. Israelachvili, Intermolecular and surface forces, second edition, (Academic Press, San Diego, 1992).
- (38) I. Bitsanis, S. A. Somers, H. T. Davis, and M. Tirrel, J. Chem. Phys. 93, 3427 (1990).
- (39) K. P. Travis, B. D. Todd, and D. J. Evans, Phys. Rev. E 55, 4288 (1997).
- (40) K. P. Travis and K. E. Gubbins, J. Chem. Phys. 112, 1984 (2000).
- (41) R. B. Bird, C. F. Curtiss, R. C. Armstrong, and O. Hassager, Dynamics of Polymeric Liquids, second edition (Wiley, New York, 1987).