Graph Partitioning Induced Phase Transitions
Abstract
We study the percolation properties of graph partitioning on random regular graphs with N vertices of degree . Optimal graph partitioning is directly related to optimal attack and immunization of complex networks. We find that for any partitioning process (even if non-optimal) that partitions the graph into equal sized connected components (clusters), the system undergoes a percolation phase transition at where is the fraction of edges removed to partition the graph. For optimal partitioning, at the percolation threshold, we find where is the size of the clusters and where is their diameter. Additionally, we find that undergoes multiple non-percolation transitions for .
The graph partitioning problem deals with assigning vertices in a graph to different partitions such that no partition is greater than a given size. The optimal solution is one which minimizes the fraction of edges that must be removed such that there are no edges between partitions Kernighan .
Graph partitioning is of interest not only because of the large amount of previous research done but also because optimal partitioning is equivalent to optimal attack/immunization of a complex network. That is, the percolation threshold , at which global connectivity is lost, will be lower than that for any other type of attack/immunization and the measure of fragmentation Borgatti for all values of will be higher than for any other type of attack/immunization Holme .
Graph partitioning is a much studied subject with a long history of work by mathematicians and computer scientists. The problem of determining the optimal solution is NP complete. Mathematicians have pursued finding rigorous bounds for the minimum number of edges needed to partition (usually random regular) graphs into two equal sized partitions Buser ; Bollabas ; Alon ; Bezrukov . Computer scientists have pursued developing efficient algorithms which heuristically find good approximations to the optimal solution Kernighan ; Boettcher ; Karypis1 ; Metis .
Here we study graph partitioning from the standpoint of statistical physics. To make contact with percolation theory Stauffer ; BundeHavlin , we identify the number of edges removed as the control variable and study the inverse problem: given that we are allowed to remove a fraction of the edges from the graph, how can we partition the graph to minimize the size of the largest partition. We denote as the size of the largest connected component (cluster) which results from the partitioning. Then, plays the role of order parameter and we are interested in the behavior of S as a function of . We ask if there is a critical value such that for , while for , scales slower than . That is, does the graph undergo a percolation phase transition? If so, what is the percolation threshold and what are the critical exponents associated with the phase transition.
We study random graphs, random graphs the vertices of which all have the same degree, . We study these graphs because of their intrinsic interest and because these graphs are examples of expander graphs which are extremely robust to node or edge removal expander1 ; expander2 . They are therefore a good testbed for optimal graph partitioning.
We find that, in fact, a percolation transition does exist and we analytically determine . We also estimate critical exponents associated with the transition. In addition however, we find that for the graph undergoes a large number of first order transitions related to the partitioning process.
Percolation Threshold. The percolation threshold can be determined analytically as follows. In Refs. Cohen2000 ; Cohen2002 it was argued that for a random graph having a degree distribution to have a spanning cluster, a vertex which is reached by following a link (from vertex on) the giant cluster must have at least one other link, on average to allow the cluster to exist. Or, given that vertex is connected to , the average degree of vertex must be at least 2:
| (1) |
We will show below that, for large at the percolation threshold, all partitions are essentially the same size and that each partition consists of one cluster note0 . Then, to achieve Eq. (1) the average degree in each cluster must be 2 and the fraction of edges which must be present is
| (2) |
This is to be compared to the random site or bond percolation threshold Cohen2000 .
We can gain insight into the structure of the spanning clusters by noting that for tree graphs with vertices
| (3) |
which approaches 2 as . For finite graphs, however, to satisfy , there must be on average one loop in each graph. Thus, at the percolation threshold, the clusters contain on average one loop. Our problem can be restated as: how do we partition a graph into the largest number of equal sized partitions each composed of one cluster with on average one loop per cluster. The larger the number of partitions (and thus the smaller the partition size), the closer the solution is to the optimal one. Different types of partitioning that maintain one cluster per partition will result in the same critical point but the scaling of the cluster size at the critical point may depend on the optimality of the partitioning.
Optimal Partitioning. We use the METIS graph partitioning program Metis which provides close to optimal graph partitioning. For the same random graph we run the program many times over the range of partition sizes in which we are interested. After each partitioning we identify the clusters in the graph, determine the size of the largest cluster and note the number of edges needed to be removed for the partitioning. For each value of the number of edges, we maintain the minimum value of the size of largest cluster in the partitioning.
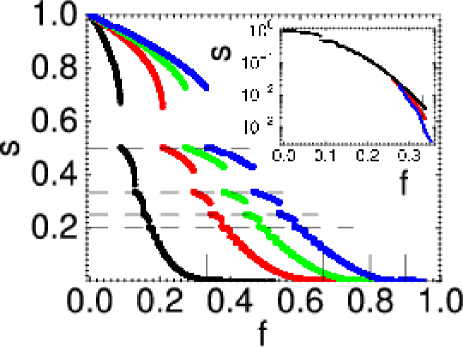
Figure 1 illustrates the behavior of versus for various values of Pinf . In what follows we will analyze the case in depth; similar results are obtained for other values of .
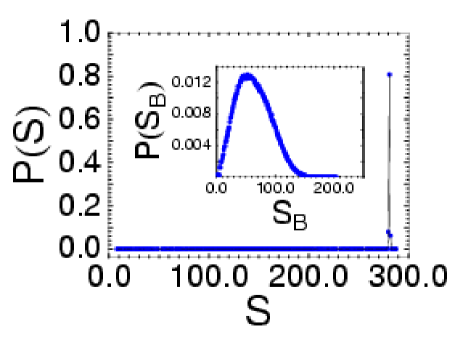
In Fig. 2, for , we plot the distribution of cluster sizes, , versus at the threshold predicted by Eq. (2) . As expected, the distribution is very strongly peaked – almost all clusters are the same size. In the inset in Fig. 1 for and various values of we plot versus . Below the plots collapse indicating that here . In the vicinity of and above the plots no longer collapse, a manifestation of scaling more slowly than .
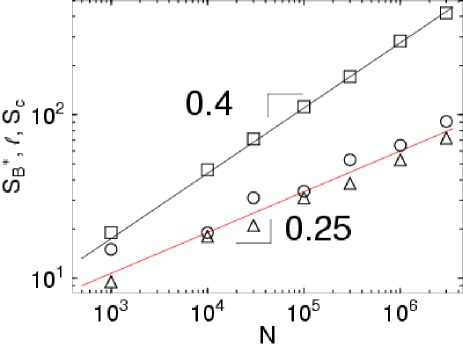
In Fig. 3 we plot the value of S at the percolation threshold versus . The slope of the plot is consistent with
| (4) |
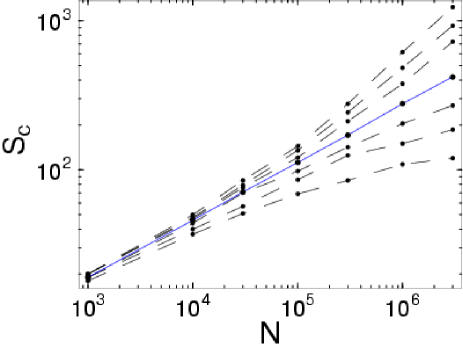
where . In Fig. 4, we plot versus for various values of and see that the straightest plot is for , the predicted critical threshold.
In Fig. 3 we also plot the chemical size (diameter) of the critical clusters versus . The slope of the plot is consistent with
| (5) |
where . From Eqs. (4) and (5) we obtain
| (6) |
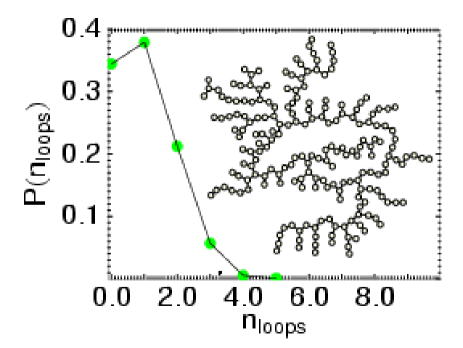
where . The exponent is a measure of the compactness of the clusters: clusters with are essentially chains; higher values of correspond to more dense structures. For random percolation, BundeHavlin ; HavlinNosal . The inset in Figure 5 is a representative critical cluster obtained from partitioning. Note the single loop required by Eq. (1) and its ”stringy” structure, the manifestation of . In Fig. 5 we plot the distribution of the number of loops per cluster, and note that it is fairly narrow with the most probable value being 1. Thus, not only is the average number of loops per cluster 1 but the most probable number is also 1.
The exponent is defined by BundeHavlin
| (7) |
where is Euclidean distance. At the percolation threshold, is expected to be , the same value as for a random walk (or for a network embedded in a very high dimensional lattice, such that spatial constraints are irrelevant) BundeHavlin .
Using Eq. (6) with and Eq. (7) with , we can determine the fractal dimension of the percolation clusters at criticality defined by
| (8) |
to be
| (9) |
Assuming that our problem of optimal partitioning on random regular graphs has an analog on lattices in Euclidean space of dimension , in which
| (10) |
where is the length of a side of the lattice, we can determine the upper critical dimension, for that analog. The upper critical dimension is defined such that for , all critical exponents are unchanged. Since random graphs can be considered to be embedded in an infinite dimensional space, the critical exponents for our problem should be the same as those at the critical dimension for the Euclidean analog. Using Eqs. (8) and (10), we find and thus which interestingly is the critical dimension for lattice animals and branched polymers latticeAnimal1 ; latticeAnimal2 .
We can learn more about the fractal structure of the spanning cluster at by analyzing the 2-connected components (blobs) HerrmannStanley within the spanning clusters. This is equivalent to analyzing the loops within the spanning clusters because the typical cluster contains 1 loop which is the 2-connected component in the cluster. In Fig. 3 we plot the most probable blob size (equivalent to the length of loops), , versus . The scaling is consistent with similar to the scaling of the chemical length of the whole cluster. From this we infer that the chemical size of the cluster is driven by the size of the loops.
Non-optimal partitioning. We find that for partitioning in which we ensure that each partition consists of one cluster but no attempt is made to minimize the number of edges between partitions, as predicted above, in this case is also but at criticality . That is, the clusters at criticality are larger than those at criticality for optimal partitioning. The argument that the exponent is exactly is as follows: We ask how large a cluster must be to have on average one loop. Consider a cluster of size . The total number of edges associated with vertices in the cluster is . Connectivity among vertices in the cluster is provided by of the edges and others (also of order ) are either removed (connected to other partitions) or connected back to the cluster forming a loop. Because the graph is random and we partition randomly (subject to the constraint that the partitions consist of one cluster each), the probability that one of these edges is connected back to the cluster is
| (11) |
Setting we find .
Random partitioning. Random partitioning is achieved by assigning vertices to partitions randomly and is equivalent to random site percolation randomsite , for which the well known result holds Cohen2000 ; Cohen2002 . In contrast to the optimal and the non-optimal partitioning considered above, for random partitioning, partitions contain clusters of all sizes (including very small ones). Eq. (2) holds for the spanning cluster in each partition but does not hold for all clusters and is therefore significantly larger.
Non-percolation transitions. In Fig. 1, we see that the order parameter is discontinuous at values of , qualifying these points as first order phase transitions. However, these discontinuities, which occur where the number of partitions changes are not percolation transitions – the scaling of with does not change. The behavior at these transitions (and the general shape of the segments of the plots) can be understood as follows: Consider the region of the plot corresponding to two partitions () and assume we reduce the size of the larger partition (increasing the size of the smaller partition) by moving selected vertices one-by-one from the larger partition to the smaller partition note1 . Initially, the number of edges needed to be removed when we move a vertex is – all edges adjacent to the moved vertex must be removed. As the size of the smaller partition increases, we can select a vertex requiring fewer of its edges to be removed because some of its edges already have ends in the smaller partition. At some point, the number of edges to the smaller partition of a vertex to be moved is equal to the number of the vertex’s edges to the larger partition – thus, there is zero cost to the move note2 . This continues to be the case until the partitions are of equal size, resulting in the discontinuity.
Discussion. If a graph with an arbitrary degree distribution can be partitioned such that there is one cluster per partition, then our result for should be generalized to
| (12) |
where is the average degree per vertex. Areas for future work include determining whether this is the case for partitioning on such other types of graphs as Erdos-Renyi and scale-free graphs. Also of interest will be determining if there exists a Euclidean analog to our graph partitioning problem.
We thank ONR, the Israel Science Foundation and the Dysonet Project for support.
References
- (1) B. Kernighan and S. Lin, Bell System Technical J. 49, 291 (1970).
- (2) S. P. Borgatti, Computational, Mathematical and Organizational Theory, 12, 21 (2006).
- (3) P. Holme, B. J. Kim, C. N. Yoon and S. K. Han, Phys. Rev. E. 65, 056109 (2002).
- (4) P. Buser, Discrete Applied Math. 9 105 (1984).
- (5) B. Bollobás, Europ. J. Combinatorics 9, 241 (1988).
- (6) N. Alon, Combinatorics, Probability and Computing 6, 145 (1997).
- (7) S. L. Bezrukov, in: L. Lovász, A. Gyarfas, G. O. H. Katona, A. Recski, L. Szekely (Eds.), Graph Theory and Combinatorial Biology, 7, Bolyai Soc. Math. Stud., Budapest, 157 (1999).
- (8) G. Karypis and V. Kumar, SIAM J. Sci. Comput., 20 359 (1998) and references contained therein.
-
(9)
G. Karypis and V. Kumar, METIS, a Software Package for
Partitioning Unstructured Graphs, see http:
www.cs.umn.edu/ karypis/metis. - (10) S. Boettcher and A. G. Percus, Phys. Rev. E. 64, 026114 (2001).
- (11) D. Stauffer and A. Aharony, Introduction to Percolation Theory, (Taylor & Francis, London, 1992).
- (12) A. Bunde and S. Havlin, Fractals and Disordered Systems, (Springer, Berlin, 1995).
- (13) P. Sarnak, Notices of the AMS, 51, 762 (2004).
- (14) L. Donetti, F. Neri, and M. A. Muñoz, J. Stat. Mech. P08007 (2006).
- (15) R. Cohen, K. Erez, D. ben-Avraham, and S. Havlin, Phys. Rev. Lett. 85, 4626 (2000).
- (16) R. Cohen, D. ben-Avraham, and S. Havlin, in Handbook of Graphs and Networks, edited by S. Bornholdt and H. G. Schuster (Wiley-VCH, New York, 2002), Chap. 4.
- (17) This is a reasonable assumption because an optimal algorithm will not needlessly remove edges in a partition which resulting in multiple clusters. If it did, the solution would not be optimal – edges would have been wasted dividing the partition into multiple clusters. On the other hand, one cannot, a priori, rule out optimal partitioning resulting in multiple clusters per partition.
- (18) The quantity is equivalent to the order parameter in percolation theory , the fraction of sites in the incipient infinite cluster.
- (19) S. Havlin and R. Nossal, J. Phys. A 17, L427 (1984).
- (20) T. C. Lubensky and J. Isaacson, Phys. Rev. Lett. 41, 829 (1978).
- (21) S. Havlin, Z. V. Djordjevic, I. Majid, H. E. Stanley, and G. H. Weiss, Phys. Rev. Lett., 53,178 (1984).
- (22) H. J. Herrmann and H. E. Stanley, Phys. Rev. Lett. 53,1121 (1984).
- (23) Each partition is equivalent to a percolation system after vertices have been randomly removed from the system and is thus equivalent to random site percolaton.
- (24) This is not necessarily how optimal partitioning would occur but it is illustrative of the point we are making.
- (25) Here we consider graphs with even . For odd , consider moving 2 vertices at a time.