Direct measurement of antiferromagnetic domain fluctuations
Abstract
Measurements of magnetic noise emanating from ferromagnets due to domain motion were first carried out nearly 100 years ago [1] and have underpinned much science and technology [2, 3]. Antiferromagnets, which carry no net external magnetic dipole moment, yet have a periodic arrangement of the electron spins extending over macroscopic distances, should also display magnetic noise, but this must be sampled at spatial wavelengths of order several interatomic spacings, rather than the macroscopic scales characteristic of ferromagnets. Here we present the first direct measurement of the fluctuations in the nanometre-scale spin- (charge-) density wave superstructure associated with antiferromagnetism in elemental Chromium. The technique used is X-ray Photon Correlation Spectroscopy, where coherent x-ray diffraction produces a speckle pattern that serves as a “fingerprint” of a particular magnetic domain configuration. The temporal evolution of the patterns corresponds to domain walls advancing and retreating over micron distances. While the domain wall motion is thermally activated at temperatures above 100K, it is not so at lower temperatures, and indeed has a rate which saturates at a finite value – consistent with quantum fluctuations - on cooling below 40K. Our work is important because it provides an important new measurement tool for antiferromagnetic domain engineering as well as revealing a fundamental new fact about spin dynamics in the simplest antiferromagnet.
Center for Nanoscale Materials, Argonne National Laboratory, Argonne, IL 60439, USA
James Franck Institute and Dept. of Physics, University of Chicago, Chicago, IL 60637, USA
London Centre for Nanotechnology and Department of Physics and Astronomy, University College London, London WC1E 6BT, UK
Advanced Photon Source, Argonne National Laboratory, Argonne, IL 60439, USA
Because of scientific and technical interest in ferromagnetic domains, there has been large, long-standing activity on magnetic noise in ferromagnets as a direct witness of domain motion. As antiferromagnets begin to find applications themselves, for example as pinning layers in spintronics, there is a need for measurements of the noise associated with moving antiferromagnetic domains. Antiferromagnetic domain dynamics are also important because they are implicated in basic problems in condensed matter physics, such as high temperature superconductivity and ‘heavy’ Fermions. Neutrons are an excellent non-local probe of antiferromagnetism and its dynamics [4]. However, a direct local probe of mesoscopic antiferromagnetic domain dynamics has not been hitherto available because the magnetic dipole moments for antiferromagnets vanish on the scale of a nanometer, rendering the domain fluctuations responsible for noise essentially invisible to the direct magnetometer probes (e.g. superconducting interference devices) which have been so successful for ferromagnets [5].
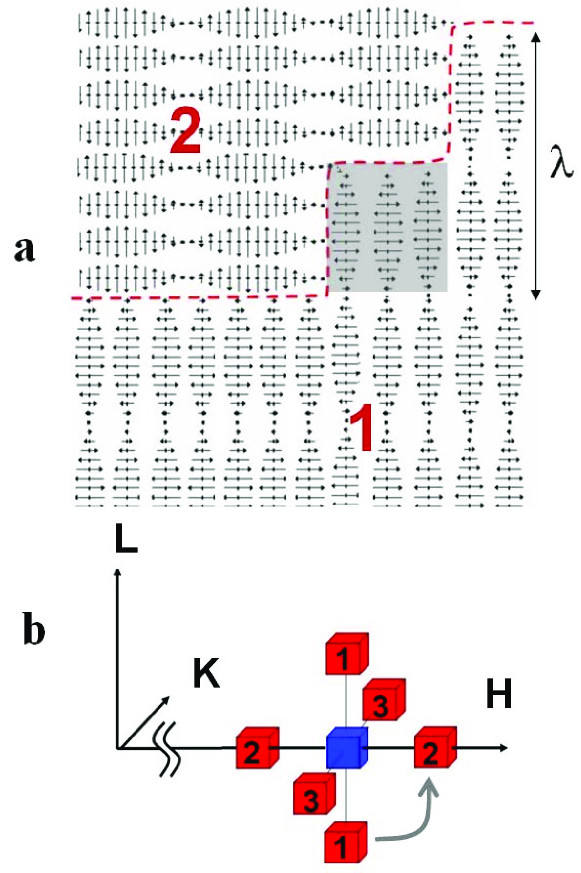
Chromium is a body-centred cubic (bcc) metal with an antiferromagnetic state nearly described by the simple rule that the electrons surrounding each Cr atom have magnetization opposite to those on the nearest neighbour Cr atoms. What actually occurs is sinusoidal modulation of this elementary magnetic structure, called a spin density wave (SDW) with wavelength =6-8 nm, along one of the three equivalent cubic (100) directions. A single crystal chromium sample cooled below the Néel temperature TN=311 K spontaneously breaks (see Fig. 1) into three types of magnetic domains characterized by the three different choices for the SDW propagation direction [6]. The SDW is accompanied by a charge density wave (CDW), a combination of both itinerant and ionic charge modulation.
X-ray microdiffraction reveals that the typical size of the SDW domains in bulk Cr samples is on the order of 1-30 m [7]. Fluctuations of domain walls at fixed temperature have been studied via random electrical telegraph noise in thin Cr films for temperatures above 140 K [8]. Even though the measurements were done for mesoscopic samples, the effects on the electrical resistance R of the switching dynamics were small (R/R10 and the interpretation difficult because R is an indirect probe of the underlying SDW and CDW order.
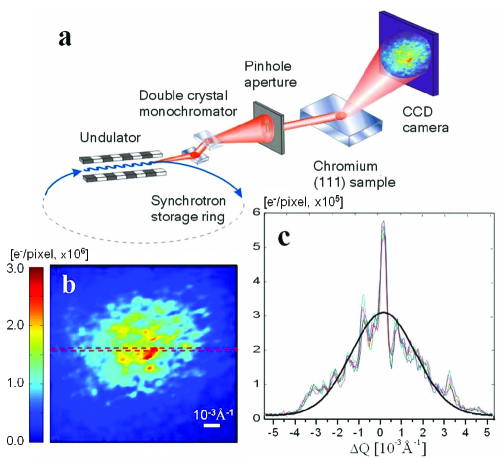
We report the first direct observations of domain wall fluctuations in bulk Cr using X-ray Photon Correlation Spectroscopy (XPCS), which overcomes the limitations of the classic bulk and laser probes in that it accesses the short wavelength structure associated with the SDW directly. A coherent beam illuminating a partially ordered system (in our case consisting of SDW/CDW domains) produces an interference pattern, also known as speckle [9, 10]. Due to the high sensitivity of speckle to minute changes in domain wall configuration, the time variation of the speckle pattern directly reveals the dynamics of domain structure. Fig. 2a is a schematic of the experimental configuration, and Figure 2b shows a speckle pattern of the (200) Bragg peak for the bcc Cr lattice. Interference fringes arising from partial coherence of the x-ray beam are clearly seen in the image as well as in the line scans shown in Fig. 2c. Incoherent diffraction would produce the Gaussian-like profile represented by the black line in Fig. 2c. The lattice Bragg speckle pattern is static over 5 hrs indicating the high level of stability for our instrumentation and the sample.
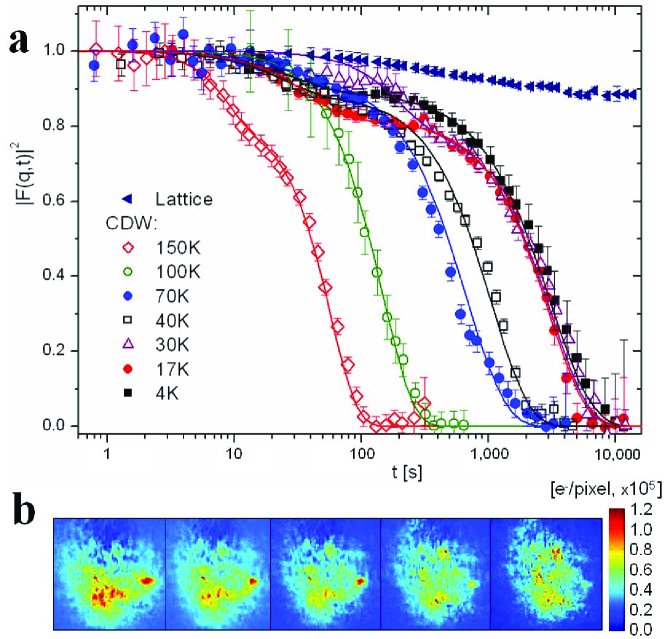
We turn next to the speckle pattern for the (2-2, 0, 0) CDW superlattice reflection, displayed for 17 K at a variety of times in Fig. 3b. The patterns in subsequent frames, separated by 1,000 s, grow increasingly dissimilar for longer time lags – patterns within frames collected more than 3,000 s apart appear completely uncorrelated. Thus, the CDW speckle evolves with a characteristic time of a few thousand seconds or less, much shorter than the 20,000 s relaxation time for the bcc Bragg speckle of Fig. 2c. This indicates that the changes in the CDW speckle are indeed due to changes in the magnetic domain configuration, rather than some experimental artefact. For example, drift of the x-ray beam or the cryostat, motion of crystalline defects within the Cr sample or any other effect not related to magnetic domain dynamics would inevitably cause changes in both the CDW and (200) Bragg speckle.
The spatial sensitivity of the speckle to domain motion is described by two distinct lengths: the first is 1/Q100Å, where Q=10-2Å-1 is the total size of visible speckle pattern in reciprocal space (See Figs. 2b, 2c and 3b) and represents the minimum size of domains with a visible impact on the speckle pattern. The second is the domain wall displacement necessary to produce a speckle pattern that is highly dissimilar (or uncorrelated) to the original one. A combination of x-ray microdiffraction images of domain configurations and speckle simulations indicate that this second length is 1 m (see Methods and Supplementary Information).
Beyond revealing that domain walls are moving by distances of order 1 m, the data provide several other important quantities. For example, we can evaluate the autocorrelation function g2(t):
| (1) |
where I() and I() are the intensities in a given pixel for frames taken at times and +t respectively, F(Q,t) is the intermediate scattering function, describes the beam coherence [9,10], and the averaging is performed over times and pixels. Figure 3a shows F(Q,t)for several temperatures calculated from the CDW speckle. For large time delays the speckle patterns become uncorrelated, resulting in g2(t)=1, corresponding to F(Q,t) =0. The dynamics are strongly temperature-dependent: upon cooling, the domain fluctuation times increases by nearly two decades. Surprisingly, below 40 K the times remain finite, rather than diverging as expected for thermally driven fluctuations.
Two distinct fluctuation timescales are visible in most datasets presented in Fig. 3a. The measured F(Q,t) was therefore modelled by a double exponential form:
| (2) |
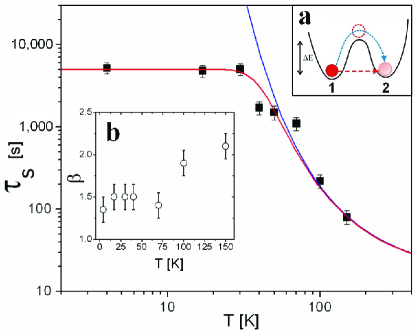
A small value of a=0.03-0.10 indicates that the time dependence of F(Q,t) is mainly due to slow fluctuations. The value of the stretching exponent was found to be greater than 1, manifested by the “compressed” shape of the F(Q,t). Compressed exponential relaxation has been observed for a variety of soft matter systems undergoing “jamming” transitions which results in arrested, solid-like collective dynamics [11, 12, 13] with 1, as instead of liquid-like fluctuations with 1. Extended to our system, this points to elastically coupled dynamics between blocks of spins, similar to elastic collective depinning dynamics observed in CDW conductors [14], an observation also consistent with the weakly pinned nature of SDW/CDW domains [15-17]. Furthermore, the fit value of at T100K is approximately 1.5 (Fig. 4b), a universal value for dynamics of soft condensed matter systems in a jammed state [18].
Fig. 4 shows the T-dependence of the slow relaxation times obtained from fits to autocorrelation functions in Fig. 3a. The 20% uncertainty in fitting parameters arises primarily from counting statistics of the autocorrelation function g2(t) (see Supplementary Information). Standard thermal activation (, blue line) with a single attempt frequency and activation barrier accounts for the data at high T. The thermal picture fails spectacularly at low temperature for T40 K, and a switching mechanism which is temperature-independent in this range is required. The simplest possibility is that switching between low-energy domain wall configurations occurs via quantum tunneling, rather than classical thermal activation. A fit to the data that combines a thermally activated model and a quantum tunneling contribution represented by a temperature-independent residence time , is shown by the red solid line in Fig. 4 for =5,000 s and 15 s (confidence limits obtained from the fits are =5,0001,000 s and tR=4-60 s). The short-term fluctuation rate observed in the autocorrelation data in Fig. 3a has the same magnitude as the attempt frequency . In analogy with alpha and beta relaxation observed in glasses, supercooled liquids and jammed soft matter systems, faster fluctuations represent local relaxation, while slower fluctuations are due to collective relaxation modes.
The relaxation times observed here are similar to those associated with magnetization switching in ferromagnets first observed by Barkhausen [1] and studied since then in systems from bulk materials to magnetic molecules [5, 19-22]. Antiferromagnets have more complex order than ferromagnets because they break translation as well as spin rotation invariance, which has forced us to formulate a very crude physical picture, to understand our data at a semi quantitative level. We start with the realization that to minimize the very large exchange energy (0.4 eV) [23, 24] associated with domain walls, it is clearly advantageous for the nodal planes (where the spin polarization vanishes) of the SDW with its propagation vector perpendicular to the domain wall to lie on the walls [25]. Such an assumption is further supported by the previously observed preference for the formation of SDW nodes at Fe/Cr interfaces [26]. This implies that the fundamental switching unit (grey shaded region in Fig. 1a) is of volume where is the underlying period of the SDW. In the simplest Gaussian model where underlying units are switching randomly at typical times , we would conclude that the switching time for a volume of V=1 m3 would be (V/V. Using our experimental value for the attempt frequency , we therefore obtain = 36 THz=140 meV as the attempt frequency for rotating an entire unit. This is an electronic energy scale, and could therefore be derived from the hopping of electrons across the domain wall; such electrons (also important in electrical noise measurements [8]) are, after all, responsible for the current fluctuations which sample the possibility of rotating the Fermi surface of a ‘quantum dot’ with the fundamental unit volume VS. It is fortunate that the barrier for rotation between two minima has been identified by neutron spectroscopy on Cr0.95V0.05 (data for pure Cr are not published) (See Fig. 2 of Ref. 27) as the energy Eo at which the incommensurate spin density fluctuations no longer display distinct peaks at the incommensurate satellite positions; Eo is found to be of order 25 meV (or 290 K), which is not far from the tunnelling barrier E=20 meV (or 240 K) established in our own experiments. Interestingly, it is this energy, rather than the much larger exchange coupling, which corresponds to TN.
In the simplest WKB approximation (see e.g. Ref. 22), the dimensionless ratio /is equal to , where is the tunneling action. Because the underlying attempt frequencies and their rescaling to account for observable effects in the X-ray experiment are the same for both incoherent quantum and classical processes, all of the detail – invoking multiple rotors - of the last paragraph drops out, and S characterizes a single rotor. We can therefore calculate the moment of inertia I of the quantum rotor using the measured parameters , and the barrier height E=20 meV obtained from the Arrhenius regime. The result is I=100 me nm2, which, assuming a cube of uniform density distributed over the (/2)3 volume of the fundamental unit corresponds to 0.1 electron mass me per Chromium unit cell. This remarkable result, derived only from our data and the simple physical picture of Fig. 1, is consistent with Hall effect data [28, 29] showing that the SDW is associated with the loss of a similar number of carriers, which of course must be moved with the rotors when there is a switching event.
We have introduced the direct measurement of noise spectra in antiferromagnets. Our experiments access local mesoscale spin dynamics with just a few domain walls in the illuminated volume, an advantage over non-local experimental probes that cannot be easily applied for macroscopic or bulk structures. The key finding is that even in bulk samples, and at temperatures very low compared to the Neel temperature, domain walls can be unstable on time scales of fractions of an hour. What this means is that the stability of antiferromagnetism needs to engineered, e.g. by insertion of appropriate pinning centres, into devices that exploit it. This will become even more important for nanoscale spintronics including antiferromagnetic elements. Beyond the obvious advantages for magnetic engineering of now having a technique with which antiferromagnetic domain fluctuations can be readily assessed, we foresee tremendous opportunities in areas such as the science of antiferromagnetic nanoparticles.
Methods. Experiments were carried out at beamlines 33-ID and 8-ID of Advanced Photon Source, Argonne National Laboratory. The undulator-generated x rays are monochromatized by a Si (111) crystal at an energy E=7.35 keV (wavelength 1.686 Angstroms). A 10 m pinhole aperture or a 10m (horizontally) by 40 m (vertically) slits placed 5 cm upstream from the sample selected partially coherent portion of the x-ray beam with a resulting coherence fraction A0.07-0.18. A high purity (111) Cr wafer (Alfa Aesar, Ward Hill, MA) was used to ensure roughly equal population of domains. The sample was mounted inside a low-drift He flow cryostat, with thermal shielding provided by 600 m thick Be dome. Speckle patterns were recorded with a Princeton Instruments PI-LCX 1300 deep depletion x-ray CCD camera (1340x1300 pixel array with 20 micron by 20 micron pixel size), located 150 cm from the sample in reflection geometry.
References.
[1] Barkhausen, H. Zwei mit Hilfe der Neuen Verstärker
entdeckte Erscheinungen. Phys. Z. 20, 401-403 (1919).
[2] Weissman, M. B. Low Frequency Noise as a tool to study
disordered materials. Annu. Rev. Mater. Sci. 26, 395-429 (1996).
[3] Sethna, J. P., Dahmen, K. A. & Myers C. R. Crackling Noise.
Nature 410, 242-250 (2001).
[4] Ekspong, G. (ed.) Nobel Lectures, Physics 1991-1995 (World Scientific Publishing Co., Singapore,
1997). 1994 Nobel prize lectures by Clifford G. Shull and Bertram N.
Brockhouse (pp. 107-154)
[5] Vitale, S., Cavalieri, A., Cerdonio, M., Maraner, A. &
Prodi, G. A. Thermal equilibrium noise with 1/f spectrum in a ferromagnetic
alloy: Anomalous temperature dependence. J. Appl. Phys. 76,
6332-4 (1994).
[6] For a review of SDW in Cr see Fawcett, E. Spin-density-wave
antiferromagnetism in chromium. Rev. Mod. Phys. 60, 209-283 (1988).
[7] Evans, P.G., Isaacs, E.D., Aeppli, G., Cai, Z.-H. & Lai, B.
X-ray microdiffraction image of antiferromagnetic domain evolution in
chromium. Science 295, 1042-1045 (2002).
[8] Michel, R. P., Israeloff, N. E., Weissman, M. B., Dura, J. A.
& Flynn, C. P. Electrical-noise measurements on chromium films. Phys. Rev. B 44, 7413-7425 (1991).
[9] Sutton, M., Mochrie, S. G. J., Greytak, T., Nagler, S. E. &
Berman, L. E. Observation of speckle by diffraction with coherent X-rays.
Nature 352, 608-610 (1991).
[10] Sutton, M. Coherent X-ray Diffraction. In Mills, D. (ed.)
Third-Generation Hard X-Ray Synchrotron Radiation Sources: Source Properties, Optics, and Experimental Techniques (John Wiley & Sons, New York, 2002).
[11] Cipelletti, L., Manley, S., Ball, R. C. & Weitz, D. A.
Universal Aging Features in the Restructuring of Fractal Colloidal Gels.
Phys. Rev. Lett. 84, 2275–2278 (2000).
[12] Bandyopadhyay, R. et al. Evolution of Particle-Scale Dynamics in an
Aging Clay Suspension. Phys. Rev. Lett. 93, 228302 (2004).
[13] Falus, P., Borthwick, M. A., Narayanan, S., Sandy, A. R. &
Mochrie, S. G. J. Crossover from Stretched to Compressed Exponential
Relaxations in a Polymer-Based Sponge Phase. Phys. Rev. Lett. 97, 066102 (2006).
[14] Lemay, S. G., Thorne, R. E., Li Y. & Brock, J. D.
Temporally ordered collective creep and dynamic transition in the
charge-density-wave conductor NbSe3. Phys. Rev. Lett. 83, 2793-2796 (1999).
[15] Fukuyama H.& Lee, P. A. Dynamics of the
charge-density wave. I. Impurity pinning in a single chain. Phys. Rev. B 17, 535 - 541 (1978).
[16] Fukuyama H.& Lee, P. A. Dynamics of the
charge-density wave. II. Long-range Coulomb effects in an array of chains.
Phys. Rev. B 17, 542 - 548 (1978).
[17] Littlewood, P. B. & Rice, T. M. Metastability of the
Vector of Pinned Charge- and Spin-Density Waves. Phys. Rev. Lett.48, 44 - 47 (1982).
[18] Cipelletti, L. et al. Universal non-diffusive slow dynamics in aging
soft matter. Faraday Discuss. 123, 237-251 (2003).
[19] Chudnovsky, E. M. & Tejada, J. Macroscopic Quantum Tunneling of the Magnetic Moment (Cambridge University Press, Cambridge, UK, 1998).
[20] Barbara, B. et al. Quantum tunneling in magnetic systems of various
sizes. J. Appl. Phys. 73, 6703-6706 (1993).
[21] Wernsdorfer, W. Classical and quantum magnetization reversal
studied in nanometersized particles and clusters. Adv. Chem. Phys. 118, 99 (2001).
[22] Brooke, J., Rosenbaum, T. F. & Aeppli, G. Tunable quantum
tunnelling of magnetic domain walls. Nature, 413, 610-613 (2001).
[23] Fenton, E. W. & Leavens, C. R. The spin density wave in
chromium. J. Phys. F 10, 1853-1878 (1980).
[24] Fenton, E. W. Domains in the Spin-Density-Wave Phases of
Chromium. Phys. Rev. Lett. 45, 736 - 739 (1980).
[25] Michel, R. P., Weissman, M. B., Ritley, K., Huang, J. C. &
Flynn, C. P. Suppression of polarization fluctuations in chromium alloys
with commensurate spin-density waves. Phys. Rev. B 47, 3442 - 3445 (1993).
[26] Fullerton, E. E., Bader, S. D. & Robertson, J. L.,
Spin-density-wave Antiferro-magnetism of Cr in Fe/Cr(001) Superlattices, Phys. Rev. Lett. 77, 1382-1385 (1996).
[27] Hayden, S. M., Doubble, R., Aeppli, G., Perring, T. G. &
Fawcett, E. Strongly Enhanced Magnetic Excitations Near the Quantum Critical
Point of Cr1-xVx and Why Strong Exchange Enhancement Need Not
Imply Heavy Fermion Behavior. Phys. Rev. Lett. 84, 999 - 1002 (2000).
[28] Lee, M., Husmann, A., Rosenbaum, T. F. & Aeppli, G. High
resolution study of magnetic ordering at absolute zero. Phys. Rev. Lett. 92, 187201 (2004).
[29] Yeh, A. et al. Quantum phase transition in a common metal. Nature 419, 459-462 (2002).
Supplementary Information accompanies the paper. {addendum}
Use of the Center for Nanoscale Materials and Advanced Photon Source was supported by the U. S. Department of Energy, Office of Science, Office of Basic Energy Sciences. The work at the University of Chicago was supported by the National Science Foundation, while that in London was funded by a Royal Society Wolfson Research Merit Award and the Basic Technologies programme of RCUK. Authors declare they have no competing financial interests.
The authors declare that they have no competing financial interests.
Correspondence and requests for materials should be addressed to O. G. S. (oshpyrko@anl.gov)