Breakdown of the Stokes-Einstein Relation in Supercooled Water
Pradeep Kumar1, S. V. Buldyrev2, S. R. Becker,3
P. H. Poole4, F. W. Starr3, and H. E. Stanley1
1Center for Polymer Studies and Department
of Physics, Boston University, Boston, MA 02215 USA
2 Yeshiva
University, Department of Physics, 500 West 185th Street, New York,
New York 10033, USA
3Department of Physics, Wesleyan University,
Middletown, CT 06459, USA
4 Department of Physics, St. Francis
Xavier University, Antigonish, Nova Scotia B2G 2W5, Canada
PACS: 05.40.-a REVISED: 09 Jan
ABSTRACT
Supercooled water exhibits a breakdown of the Stokes-Einstein relation between the diffusion constant and the alpha relaxation time . For water simulated with the TIP5P and ST2 potentials, we find that the temperature of the decoupling of diffusion and alpha relaxation correlates with the temperature of the maximum in specific heat that corresponds to crossing the Widom line . Specifically, we find that our results for collapse onto a single master curve if temperature is replaced by , where is the temperature where the constant-pressure specific heat achieves a maximum. Also, we find agreement between our ST2 simulations and experimental values of . We further find that the size of the mobile molecule clusters (dynamical heterogeneities) increases sharply near . Moreover, our calculations of mobile particle cluster size for different pressures, where is the time for which the mobile particle cluster size is largest, also collapse onto a single master curve if is replaced by . The crossover to a more locally structured low density liquid (LDL) environment as appears to be well correlated with both the breakdown of the Stokes-Einstein relation and the growth of dynamic heterogeneities.
A 17th century study of the density maximum at C tmd demonstrates the long history of water science mishima98 ; pgdbook ; pabloreview ; angell-review . Since that time, dozens of additional anomalies of water have been discovered chaplin , including the sharp increase upon cooling of both the constant-pressure specific heat and the isothermal compressibility . These anomalies of water become more pronounced as water is supercooled. To explain these properties, a liquid-liquid (LL) critical point has been proposed poole1 . Emanating from this critical point there must be loci of extrema of thermodynamic response functions such as and . These loci must coincide as the critical point is approached, since response functions are proportional to powers of the correlation length, and the locus of the correlation length maxima asymptotically close to the critical point defines the Widom line.
In the supercooled region of the pressure-temperature phase diagram, the dynamic properties of water show dramatic changes chenmallamace2006 ; prielmeierXX . One basic relation among dynamic properties is the Stokes-Einstein (SE) relation
| (1) |
where is the diffusion constant, is the temperature, is the Boltzmann constant, is the viscosity and is the effective hydrodynamic radius of a molecule. This expression provides a relation between mass and momentum transport of a spherical object in a viscous medium. The SE relation describes nearly all fluids at , where is the glass transition temperature, and since the hydrodynamic radius is roughly constant, is approximately independent of egelstaff ; se-obedience1 ; se-obedience2 . However, in most liquids, for is no longer a constant sillescu-rev ; OTP ; Cicerone95 ; berthier ; pollack ; Pollack85 ; ediger-rev ; sillescu-rev ; fujara ; ediger ; sillescu . For the case of water, the breakdown of the SE relation occurs about , in the same temperature region in which many of the unusual thermodynamic features of water occur angell-review ; chenmallamace2006 ; sas .
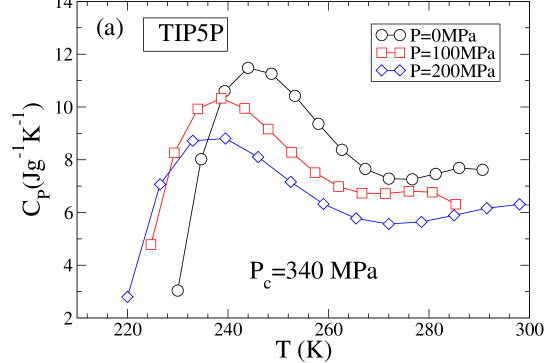
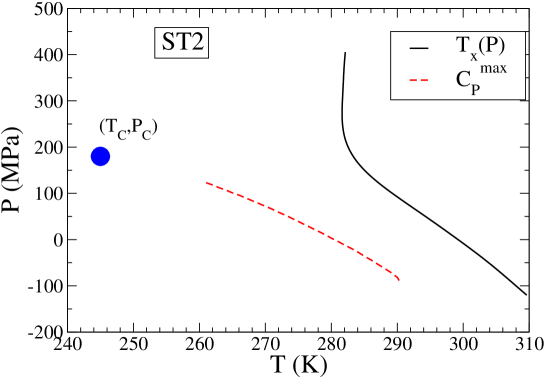
Our aim is to evaluate to what degree the SE breakdown can be correlated with the presence of thermodynamic anomalies and the onset of spatially heterogeneous dynamics, and how these features relate to the location of the Widom line stillinger ; tarjus ; ngai ; berthier ; weeks2000 . From prior studies of water, we can already form an expectation for the correlation between the SE breakdown and the Widom line by combining three elements: (i) the Widom line is approximately known from the extrapolated power-law divergence of kano-angell ; (ii) the locus of points where extrapolates to zero is also known, and nearly coincides with at low pressures (see Fig.1 of Ref. sss ); (iii) the SE relation has been found to fail in liquids generally at the temperature rossler . Combining these three results, one might not be surprised if the breakdown of the SE relation should occur near to the Widom line for , and it should continue to follow for . We will see that our results are consistent with this expectation, but reveal some unexpected insights. To address these issues, we perform molecular dynamics (MD) simulations of waterlike molecules interacting via the TIP5P potential JorgensenXX ; YamadaXX , which exhibits a LL critical point at approximately K and MPa YamadaXX ; Paschek05 . We carry out simulations in the ensemble for three different pressures MPa, MPa, and MPa, and for temperatures ranging from K down to K for and MPa, and down to K for MPa. We also analyze MD simulations of waterlike molecules interacting via the ST2 potential st2 ; bps , which displays a LL critical point at K and MPa poole2 . The simulations for the ST2 model are performed in the ensemble bps . To locate the Widom line, we first analyze the isobaric heat capacity for the TIP5P model [Fig. 1(a)]. For the ST2 model, we use the results for the Widom line from Ref. poole2 .
We next explore the possible relation between the Widom line and the breakdown of the SE relation(Eq. 1). We first calculate the diffusion constant via its asymptotic relation to the mean-squared displacement,
| (2) |
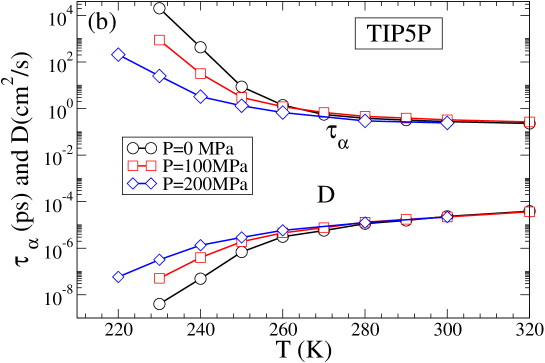
where is the position of oxygen at time . It is difficult to accurately calculate the viscosity in simulations, so we instead calculate the alpha relaxation time (which is expected to have nearly the same dependence as ) as the time at which the coherent intermediate scattering function
| (3) |
decays by a factor of . Here is the Fourier transform of the density at time , is the position of oxygen at time , is a wave vector and the brackets denote an average over all and many equilibrium starting configurations. We calculate at the value of of the first maximum in the static structure factor . It is important that we use the coherent scattering function (as opposed to the incoherent, or self-scattering function), since we want to capture collective relaxation that contributes to . Hence the SE relation can be written as
| (4) |
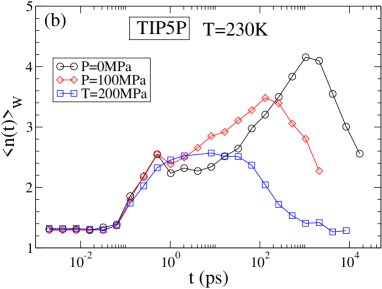
We see that both and (Fig. 1(b)) display rapid changes at low .
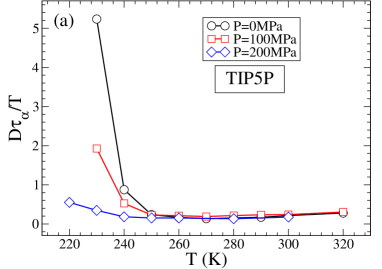
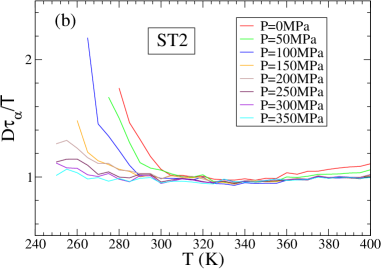
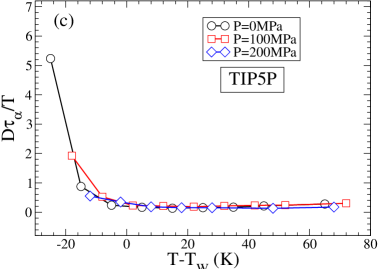
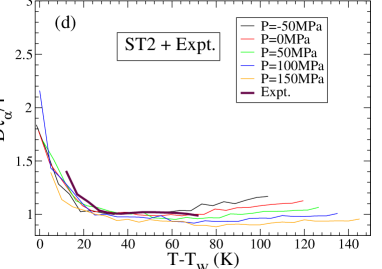
Figures 2(a) and 2(b) show as a function of . At high , remains approximately constant. At low , increases indicating a breakdown of the SE relation (1), which occurs in the same region where the thermodynamic anomalies develop, and near the Widom line . To test if there is a correlation between the SE breakdown and , we plot against [Figs. 2(c) and (d)] and find the unexpected result that all the curves for different pressures overlap within the limits of our accuracy for both TIP5P and ST2 potentials. Hence is a function only of , from which it follows that the locus of the temperature of the breakdown of the SE relation is correlated with .
To better quantify the temperature where the SE relation breaks down, we use the fact that when the SE relation fails it can be replaced by a “fractional” SE relation sillescu-rev ; bps . By plotting parametrically as a function of , one can identify the crossover temperature between the two regions by the intersection of the high SE behavior and the low fractional SE behavior [Fig. 3]. We confirm that the same collapse of can be found by replacing with , demonstrating (Fig. 3) that the loci of SE breakdown defined by and track each other for . There is also some difference between the ST2 and TIP5P models in the relative location of the breakdown of the SE relation and , evidenced by the fact that the magnitude of the SE breakdown is different at . As a result, the data for the two models will not collapse when plotted together. Moreover, we find that from the experimental data plotted against [Fig. 2(d)], coincides with the ST2 results, suggesting that the data collapse should exist for real water when is replaced by footnote ; angell-review81 .
The above analysis has primarily focused on the behavior for , where there is a Widom line. For , water behaves similarly to simple glass forming liquids, and we expect the breakdown of the SE relation for water to be similar to other simple liquids. Specifically, the SE relation should break down at sillescu-rev . This breakdown approximately coincides with the temperature where the mode coupling description of the dynamics fails rossler ; sillescu-rev . For the SPC/E model of water, the mode coupling temperature () locus has been evaluated, and the slope in the - plane of this locus changes from negative to positive for fwstarr99 (the slope is positive for simple liquids). Correspondingly, there is also a decoupling of and near fwstarr99 . We find the same behavior for the ST2 model.
Since we find a correlation between and the breakdown of the SE relation, the hypothesized connection between the SE breakdown and the onset of dynamical heterogeneities (DH) suggests a connection between and the onset of DH. To investigate the behavior of the dynamic heterogeneities, we study the clusters formed by the most mobile molecules donati , defined as molecules with the largest displacements during a certain interval of time of length . The clusters of the most mobile molecules are defined as follows. If in a pair of the most mobile molecules determined in the interval , two oxygens at time are separated by less than the distance corresponding to position of the first minimum in the pair correlation function ( nm in TIP5P and nm in ST2), this pair belongs to the same cluster.
The weight averaged mean cluster size
| (5) |
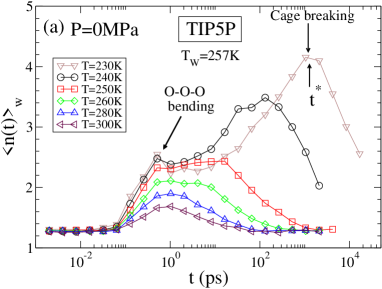
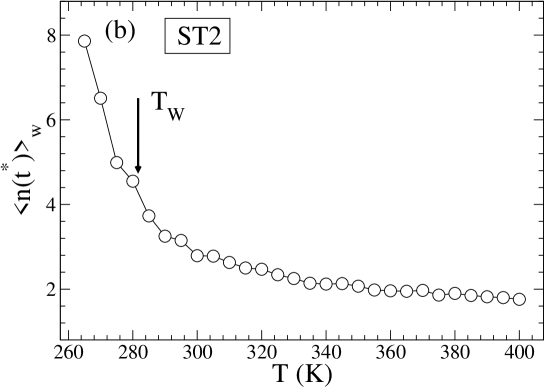
measures the cluster size to which a randomly chosen molecule belongs, where is the number averaged mean cluster size. We show in Fig. 4 for TIP5P as a function of observation time interval for different at MPa [Fig. 4(a)]. The behavior at higher is qualitatively the same [Fig. 4(b)]. At low , has a maximum at the time associated with the breaking of the cage formed by the neighboring molecules (see gbss and the references therein). Both the magnitude and the time scale of the peak grow as decreases. At high , this peak merges and becomes indistinguishable from a second peak with fixed characteristic time ps. By evaluating the vibrational density of states, we associate this feature with a low frequency vibrational motion of the system, probably the O-O-O bending mode tsai2005 .
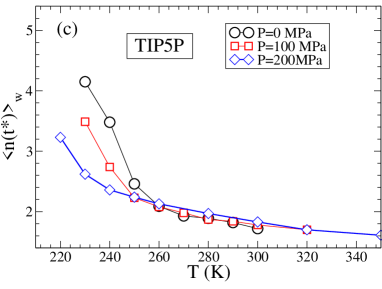
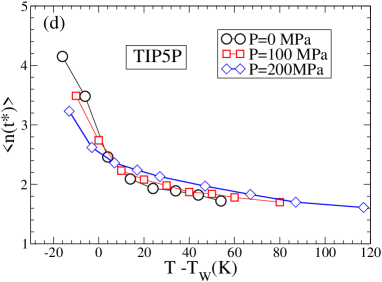
To probe the temperature dependence of , we plot the peak value in Fig. 4(c) as a function of for MPa, 100 MPa, and 200 MPa for the TIP5P model. At high , is nearly constant, since at high , clusters result simply from random motion of the molecules. Upon cooling near the Widom line, increases sharply. When is plotted as a function of [see Fig. 4(d)], we find that (similarly to the behavior of ) the three curves for MPa, MPa, and MPa overlap, and it is apparent that the pronounced increase in occurs for .
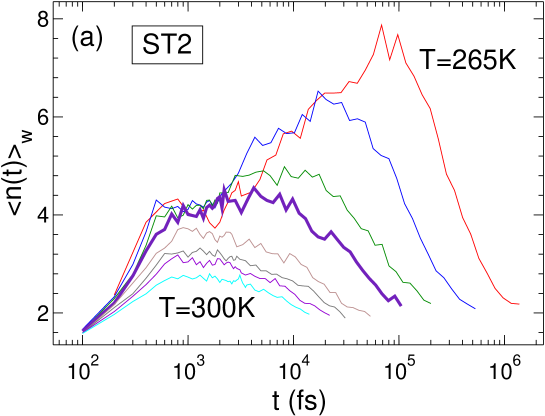
To further test that the breakdown of the SE relation in water is associated with the onset of large DH near the Widom line, we show for different along an isochore of density g/cm3 for the ST2 model of water in Fig. 5(a). We show an isochore because only isochoric data are available from Ref. poole2 . As in the case of TIP5P, we find the emergence of a second time scale larger than ps in near the crossing of the Widom line at this density. Similarly, increases sharply near the Widom line temperature [see Fig. 5(b)]. Hence the sharp growth of DH and the appearance of a second time scale in both occur near the Widom line. We also find that the magnitude of is larger for the ST2 model than for the TIP5P model at the Widom temperature, consistent with the above observation that the breakdown of the SE relation is more pronounced for the ST2 model than for the TIP5P model.
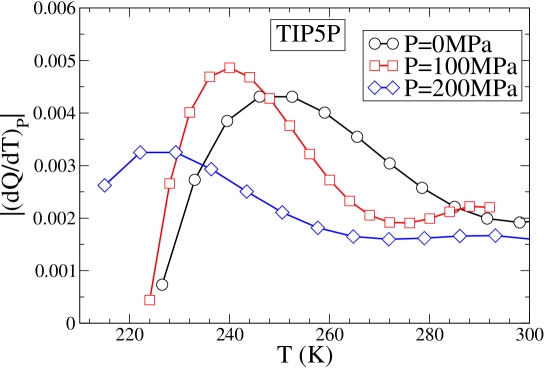
Finally, we consider the correspondence between DH and static structural heterogeneity in the supercritical region; this region is characterized by large fluctuations spanning a wide range of structures, from HDL-like to LDL-like. To quantify these structural fluctuations, we calculate for the TIP5P model the temperature derivative of a local tetrahedral order parameter erringtonQ . In Fig. 6(a), we show at different for MPa, and MPa, and find maxima kumarProtein at (P) xuPNAS ; Oguni . The maxima in indicates that the change in local tetrahedrality is maximal at , which should occur when the structural fluctuation of LDL-like and HDL-like components is largest. We see that the growth of the dynamic heterogeneity coincides with the maximum in fluctuation of the local environment. Also, since quantifies the orientational order, the fact that we find that has maximum at approximately the same temperature where has a maximum, supports the idea that water anomalies are closely related to the orientational order present in water.
Before concluding, we note that more than a dozen other phenomena have been correlated with . Some of these phenomena are from simulations, such as the crossover in the relaxation time of the fluctuations in orientational order parameter kbs07 or the maximum in the temperature derivative of the number of hydrogen bonds per molecule kfs06 . Others are from only experiments, such as the sharp drop in the the temperature derivative of the zero-frequency structure factor observed by QENS or the appearance of a Boson peak, both observed by quasi-elastic neutron scattering Liu04 . Finally, some anomalies that correlate with the Widom line are found in both simulations and experiment, such as the dynamic “fragile-to-strong” crossover in the diffusion constant, or the sharp drop in temperature derivative of of the mean squared displacement (seen in QENS, NMR, and simulations) mallamaceJCP ; xuPNAS ; kumarProtein .
In conclusion, we find that the breakdown of the Stokes-Einstein relation for can be correlated with the Widom line. In particular, rescaling by yields good data collapse of for different pressures. Rapid structural changes occur at near the Widom line, where larger LDL “patches” emerge upon cooling. The size of the dynamic heterogeneities also increases sharply as the Widom line is crossed. The breakdown of the SE relation can be understood by the fact that diffusion at low is dominated by regions of fastest moving molecules (DH) while the relaxation of the system as a whole is dominated by slowest moving molecules. Consistent with this, we found that the growth of mobile particle clusters occurs near the Widom line and also near the breakdown of the SE relation for . Thus the SE breakdown in water is consistent with the LL-critical point hypothesis mishima98 ; poole1 ; angell-review ; pgdbook ; pabloreview . Our results are also consistent with recent experimental findings in confined water Liu04 ; mallamaceJCP ; chenmallamace2006 .
We thank C. A. Angell, S.-H. Chen, G. Franzese, J. M. H. Levelt Sengers, S. Han, L. Liu, M. G. Mazza, F. Sciortino, M. Sperl, K. Stokely, B. Widom, L. Xu, Z. Yan, E. Zaccarelli and especially S. Sastry for helpful discussions and the NSF Chemistry Program for support. We also thank the Boston University Computation Center and Yeshiva University for allocation of computational time.
References
- (1) Waller, R., trans. Essayes of natural experiments [original in Italian by the Secretary of the Academie del Cimento]. Facsimile of 1684 English translation (Johnson Reprint Corporation, New York, 1964).
- (2) Mishima, O. & Stanley, H. E. (1998) Nature 392, 164–168.
- (3) Debenedetti, P. G. & Stanley, H. E. (2003) Physics Today 56 [6], 40–46.
- (4) Debenedetti, P. G. (2003) J. Phys.: Condens. Matter 15, R1669–R1726.
- (5) Angell, C. A. (2004) Ann. Rev. Phys. Chem. 55, 559–583.
- (6) http://www.lsbu.ac.uk/water/anmlies.html.
- (7) Poole, P. H., Sciortino, F., Essmann, U. & Stanley, H. E. (1992) Nature 360, 324–328.
- (8) Chen, S.-H., Mallamace, F., Mou, C.-Y, Broccio, M., Corsaro, C., Faraone, A. & Liu, L. (2006) Proc. Natl. Acad. Sci. USA 103, 12974–12978.
- (9) Prielmeier, F. X., Lang, E. W, Speedy, R. J. & Lüdemann, H. D. (1987) Phys. Rev. Lett. 59, 1128–1131.
- (10) Egelstaff, P. A., An Introduction to the Liquid State (Clarendon Press, New York, 1994).
- (11) Jonas, J. & Akai, J. A. (1977) J. Phys. Chem. 66, 4946–4950.
- (12) Keyes, T. & Oppenheim, I. (1973) Phys. Rev. A 8, 937–949.
- (13) Sillescu, H. (1999) J. Non-Cryst. Solids 243, 81–108.
- (14) Cicerone, M. T., Blackburn, F. R. & Ediger, M. D. (1995) Macromolecules 28, 8224-8232.
- (15) Cicerone, M. T. & Ediger, M. D. (1995) J. Chem. Phys. 103, 5683–5692.
- (16) Berthier, L., Biroli, G., Bouchaud, J.-P., Cipeletti, L., Masri, D. El, L’Hote, D., Ladieu, D. & Pierno, M. (2005) Science 310, 1797–1800.
- (17) Pollack, G. L. (1981) Phys. Rev. A 23, 2660.
- (18) Pollack, G. L. & Enyeart, J. J. (1985) Phys. Rev. A 31, 980.
- (19) Ediger, M. D. (2005) Annu. Rev. Phys. Chem. 51, 99–128.
- (20) Fujara, F., Geil, B., Sillescu, H., & Fleischer, G., (1992) Z. Phys. B 88, 195–204.
- (21) Cicerone, M. T., Blackburn, F. R. & Ediger, M. D. (2005) J. Chem. Phys. 102, 471–479.
- (22) Ehlich, D. & Sillescu, H. (1990) Macromolecules 23, 1600.
- (23) Starr, F. W., Angell, A., Stanley, H. E. (2003) Physica A 323, 51–66.
- (24) Stillinger, F. H. & Hodgon, J. A. (1994)Phys. Rev. E 50, 2064.
- (25) Gilles, T. & Kivelson, D. (1995) J. Chem. Phys. 103, 3071–3073.
- (26) Ngai, K. L. (1999) Phil. Mag. B 79, 1783–1797.
- (27) Weeks, E. R., Crocker, J. C., Levitt, A. C., Schofield, A., Weitz, D. A., (2000) Science 287, 627–631.
- (28) Kanno H. & Angell, C. A., (1979) J. Chem. Phys. 70, 4008–4016.
- (29) Starr, F. W., Sciortino, F., Stanley, H. E., (1999) Phys. Rev. E 60 6757–6768.
- (30) Rössler, E., (1990) Phys. Rev. Lett., 1595–1598.
- (31) Mahoney, M. W & Jorgensen, W. L. (2000) J. Chem. Phys. 112, 8910–8922.
- (32) Yamada, M., Mossa, S., Stanley, H. E. & Sciortino, F. (2002) Phys. Rev. Lett. 88, 195701.
- (33) Paschek, D. (2005) Phys. Rev. Lett. 94, 217802.
- (34) Stillinger, F. H. & Rahman, A. (1974) J. Chem. Phys. 60, 1545.
- (35) Becker, S. R., Poole, P. H. & Starr, F. W. (2006) Phys. Rev. Lett. 97, 055901.
- (36) Poole, P. H., Saika-Voivod, I. & Sciortino, F. (2005) J. Phys.: Condens. Matter 17, L431–L437.
- (37) The experimental data for were taken from Ref. prielmeierXX and the experimental data for were taken from Ref. angell-review81 . The for experimental water at atm is taken to be K Oguni which is also supported by simulation studies of the SPC/E model of water sas .
- (38) Hallet, J. (1963) Proc. Phys. Soc. 82, 1046–1050; Opisov, Y. A., Zheleznyi, B. V., & Bondarenko, N. F. (1977) J. Phys. Chem. 51, 748–752; Angell, A. (1981) in Water: A comprehensive treatise, edited by F. Franks (Plenum press, New York).
- (39) Starr, F. W., Harrington, S., Sciortino, F. & Stanley, H. E. (1999) Phys. Rev. Lett. 82, 3629–3632.
- (40) Donati, C. et al. (1999) Phys. Rev. E 60, 3107–3119.
- (41) Giovambattista, N., Buldyrev, S. V., Stanley, H. E. & Starr, F. W. (2005) Physical Review E 72, 011202.
- (42) Tsai K. H., & Wu T.-M., (2005) Chem. Phys. Lett. 417, 390–395.
- (43) Errington J. R. & Debenedetti P.G, (2001) Nature 409, 318–321.
- (44) Kumar, P., Yan Z., Xu, L., Mazza, M, Buldyrev, S. V., Chen, S.-H., Sastry, S. & Stanley, H. E., (2006) Phys. Rev. Lett. 97 , 177802.
- (45) Xu, L., Kumar, P., Buldyrev, S. V., Chen, S.-H., Poole, P. H., Sciortino, F. & Stanley, H. E., (2005) Proc. Nat. Acad. Sci. 102 16558–16562.
- (46) Maruyama, S., Wakabayashi, K. & Oguni, M. (2004) AIP Conf. Proc. 708, 675–676.
- (47) Kumar, P., Buldyrev, S. V., Stanley, H. E., (2007) (to be submitted).
- (48) Kumar, P., Franzese, G., and Stanley, H. E., (submitted Dec 06).
- (49) Liu, L., Chen, S.-H., Faraone, A., Yen, C.-W & Mou, C.-Y (2005) Phys. Rev. Lett. 95, 117802.
- (50) Mallamace F., Broccio M., Corsaro C., Faraone A., Wanderlingh U., Liu L., Mou, C.-Y., & Chen, S.-H. (2006) J. Chem. Phys. 124, 161102.