Electronic address: ]kimura@ims.ac.jp
Infrared study on the electronic structure of alkaline-earth-filled skutterudites Sb12 ( = Sr, Ba; = Fe, Ru, Os)
Abstract
The optical conductivity [] spectra of alkaline-earth-filled skutterudites with the chemical formula Sb12 ( = Sr, Ba, = Fe, Ru, Os) and a reference material La3+Fe4Sb12 were obtained and compared with the corresponding band structure calculations and with calculated spectra to investigate their electronic structures. At high temperatures, the energy of the plasma edge decreased with the increasing valence of the guest atoms in the Fe4Sb12 cage indicating hole-type conduction. A narrow peak with a pseudogap of 25 meV was observed in SrFe4Sb12, while the corresponding peak were located at 200 and 100 meV in the Ru- and Os-counterparts, respectively. The order of the peak energy in these compounds is consistent with the thermodynamical properties in which the Os-compound is located between the Fe- and Ru-compounds. This indicated that the electronic structure observed in the infrared spectra directly affects the thermodynamical properties. The band structure calculation implies the different electronic structure among these compounds originates from the different states of the ions.
pacs:
78.30.-j, 71.20.Lp, 75.50.BbI Introduction
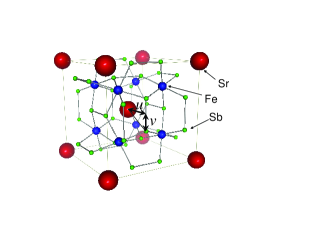
Rare-earth-filled skutterudites have recently attracted attention due to their various unique physical properties such as the magnetic field-induced quadrupole order in PrOs4Sb12 Aoki03 , the pressure-induced superconducting phase in PrRu4P12, Miyake04 new ordered states in high magnetic fields in PrFe4P12, Tayama04 a multipole ordered state in SmRu4P12, Hachi06 and the magnetic field-independent heavy fermion state in SmOs4Sb12 Sato06 to name a few. These unconventional physical properties indicate that the combination of the guest rare-earth ions and the other two elements of the cage produce unique physical environments due to the strong hybridization between these ions. In the filled skutterudites case, the crystal structure shown in Figure 1 (body-centered-cubic structure with () THK2001 ), (: guest atom, : transition metals, : pnictogen), is the key for this strong hybridization. The crystal structure makes nano-sized cages composed of . The guest atoms are located in these cages. HK03 The strong hybridization between the ion and the cage is believed to be the origin of the various unique physical properties mentioned above. In addition, the electronic structure of the frame is also important in determining the bulk physical properties, particularly given the magnetic moment of the ion. For example, in the case of non-magnetic guest atoms, alkali-metal-filled iron antimony skutterudites (KFe4Sb12 and NaFe4Sb12) exhibit weak itinerant ferromagnetism due to the Fe electrons. ALJ03 ; ALJ04 ; Sheet05 These skutterudites also produce iron-based heavy quasiparticles as a result. Joerg06 ; sk06-1 The positional parameters and of the Sb atoms denoted in Figure 1 change depending on the different and atoms. These positional parameters also affect the electronic structure. Koga2005 Given the positional dependence, it is important to ascertain the relationship between these parameters and the electronic structure as well as the physical properties.
Alkaline-earth-filled antimony skutterudites Sb12 ( = Ca, Sr, Ba, = Fe, Ru, Os) have been vigorously investigated. Taka06 Among these materials, Fe4Sb12 materials have an electrical resistivity with a shoulder at 70 K with a quadratic dependence upon decreasing temperatures, a thermopower with a local maximum at around 50 K, an electronic specific heat coefficient of 100 mJ/mol K2 and a maximum magnetic susceptibility at 50 K, which commonly implies the presence of low energy spin fluctuations described by the self-consistent renormalization (SCR) theory. Matsuoka05 ; Matsumura05 The ratio between the enhanced coefficient of the quadratic electrical resistivity ( = ) and is close to the Kadowaki-Woods value [1.0 10 cm K-2/(mJ/mol K2)2]. This phenomenon originates from the presence of heavy quasiparticles, observed in an infrared reflectivity experiment, arising from the Fe electrons. sk06-1 In comparison, alkaline-earth-filled ruthenium antimony skutterudites, Ru4Sb12, exhibit normal metallic physical properties with a small electrical specific heat coefficient, = 10 mJ/mol K2. The electrical resistivities of Os4Sb12 compounds exhibit a pronounced shoulder at 100 K, a magnetic susceptibility with a logarithmic temperature dependence and a moderately high is moderately high value of 45 mJ/mol K2. Matsuoka06 The thermodynamical properties of the Os-compounds imply that they are located between the Fe- and Ru-compounds.
To clarify the differences in the physical properties in Sb12 compounds ( = Sr, Ba, = Fe, Ru, Os), the optical conductivity [] spectra of these compounds were obtained and compared with the band structure calculations. The specific purpose of this comparison is to observe and differences between the experimental and calculated spectra using the lattice constants and the positional parameters experimentally obtained by X-ray diffraction. To check the effects of the positional parameters of the Sb atoms, the band structures of SrFe4Sb12 were also calculated using the positional parameters of the Ru-counterpart. In the next section, the experimental and analytical methods including the theoretical calculations are explained. In Section 3, the experimental and the calculated spectra are compared and which parameter is more influential regarding the electronic structure near the Fermi level () is discussed. The results are summarized in Section 4.
II Experimental and Band Calculation Methods
High density polycrystalline Sb12 samples were synthesized using a spark-plasma sintering technique previously reported. Matsuoka05 The near-normal incident optical reflectivity [] spectra were acquired from well-polished samples by using 0.3 m grain-size Al2O3 wrapping film sheets. Martin-Puplett and Michelson type rapid-scan Fourier spectrometers (JASCO Co. Ltd., FARIS-1 and FTIR610) were used at photon energies () of 2.5 – 30 meV and 5 meV – 1.5 eV, respectively, at sample temperatures in the range of 7 – 300 K using a closed cycle-helium cryostat for FTIR610 and a liquid-helium flow-type cryostat for FARIS-1. To obtain the absolute values, the samples were evaporated in-situ with gold, whose spectrum was then measured as a reference. To obtain spectra via the Kramers-Kronig analysis (KKA), was measured at 300 K over the energy range of 1.5 – 30 eV at the synchrotron radiation beam line 7B of UVSOR-II, at the Institute for Molecular Science. BL7B Since does not significantly change with temperature above 1.5 eV, the spectra above 1.5 eV were connected to the spectra at other temperatures in the energy range below 1.5 eV. In the energy ranges below 2.5 meV and above 30 eV, the spectra were extrapolated using the Hagen-Rubens function [] and the relationship, respectively. DG02 Here denote the direct current conductivity. After constructing in the energy region from zero to infinity, the KKA was performed to obtain the spectrum.
| Compound | lattice constant (pm) | ||
|---|---|---|---|
| SrFe4Sb12 | 918.126 | 0.338393 | 0.160343 |
| SrRu4Sb12 | 928.91 | 0.343316 | 0.158496 |
| SrOs4Sb12 | 933.134 | 0.34154 | 0.15660 |
| BaRu4Sb12 | 931.51 | 0.344393 | 0.159263 |
| BaOs4Sb12 | 933.507 | 0.34174 | 0.157507 |
| LaFe4Sb12 | 913.952 | 0.336966 | 0.160425 |
The band structure calculation was performed using the full potential linearized augmented plane wave plus the local orbital (LAPW + lo) method including spin orbit coupling implemented in the Wien2k code. WIEN2k The no overlapping muffin-tin (MT) sphere radii of 2.50, 2.50 and 2.27 Bohrs radii were used for the Sr, Fe and Sb atoms in SrFe4Sb12, respectively. The radii of all other atoms in other compounds were set to similar values. The value of (the smallest MT radius multiplied by the maximum value in the expansion of plane waves in the basis set), which determines the accuracy of the basis set used, was set to 7.0. The total number of Brillouin zones was sampled with 4000 points. The lattice constants and positional parameters reported previously Kaiser99 for Fe- and Ru-compounds were used. For Os-compounds, the parameters experimentally obtained by X-ray diffraction were used. Tsubota06 The lattice constants and the positional parameters for an Sb atom that were used in this paper are listed in Table 1.
III Results and Discussion
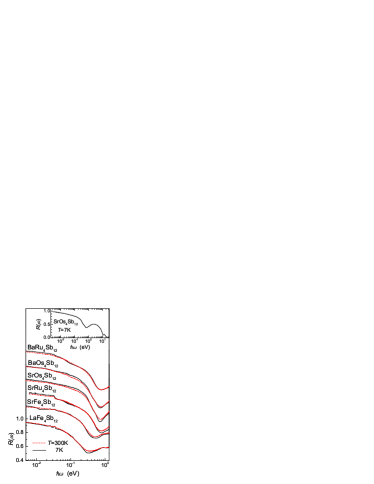
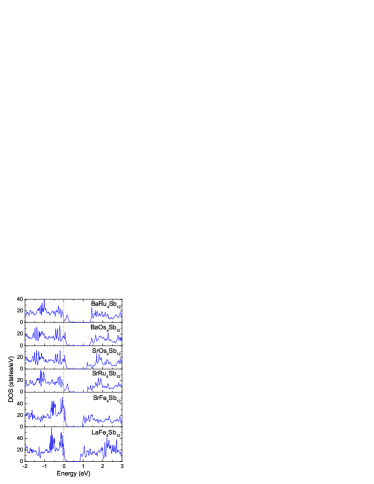
The obtained spectra at 7 and 300 K are shown in Figure 2. The plasma edge () that is the reflectivity minimum in this energy range is located at 0.31 eV in LaFe4Sb12 and at 0.51 eV in SrFe4Sb12. Since is proportional to the carrier density in the Drude formula, the carrier density of SrFe4Sb12 is higher than that of LaFe4Sb12. The origin of the difference in carrier density originates from the different valence numbers of the guest atoms between these materials, specifically, Sr2+ in SrFe4Sb12 and La3+ in LaFe4Sb12. The increase in carrier density with the increasing valence number of the guest atoms indicates that positive carriers (holes) are dominant. This is consistent with the band structure calculations as shown in Figure 3 and also with the positive value in the thermopower and Hall coefficient data in the normal state. Taka06 The band structure calculations indicate that the overall band structure does not change in these materials, with the of LaFe4Sb12 only shifting by about 30 meV from that of SrFe4Sb12. It was confirmed that in Na+Fe4Sb12 and K+Fe4Sb12, is located at 0.6 eV, which is a higher energy than that of SrFe4Sb12. Joerg07 Therefore the carrier density of Na- and K-compounds is higher than that of Sr2+-compounds. This indicates that the electrons released from the guest atoms control the in the rigid-band-like electronic structure of the Fe4Sb12 cage. It should be noted that in comparing with the band structure among Fe4Sb12 ( = La, Sr, Na) materials, the hybridization band between the Fe and Sb orbitals commonly exists neat the , and that the is determined only by the valence number of the guest atom. This indicates that the minimum is not only the carrier based plasma edge, but also includes interband transitions near the , as discussed later. This fine structure near the is smeared out by thermal broadening at 300 K. In this case, the minimum value can be regarded as the carrier plasma edge at 300 K. The spectral weight (, where the rest mass of an electron and is the electron charge.) below the plasma edge ( = 0.51 eV) of SrFe4Sb12 is evaluated to be 2.71021 cm-3, which is consistent with the carrier density of CaFe4Sb12 evaluated by the Hall coefficient measurement. Taka06
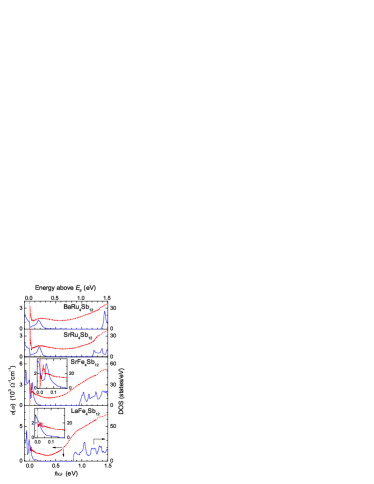
The next step in this comparison is to make clear which electronic structure an spectrum corresponds to. The spectra at = 7 K and the densities of states (DOS) above the ’s of LaFe4Sb12, SrFe4Sb12, SrRu4Sb12 and BaRu4Sb12 are then plotted, as shown in Figure 4. For LaFe4Sb12, the spectrum monotonically decreases with increasing photon energy for energies less than 0.4 eV with the exceptions of the TO-phonon structure at around 0.02 eV. Above 0.4 eV, the spectrum is dominated by the shoulder structure at around 0.8 eV. The DOS above the also monotonically decreases with increasing energy below 0.15 eV, disappears between 0.2 – 0.8 eV, and appears again above 0.8 eV. In this case, the spectrum can be attributed to the DOS above the in which the spectrum originates from the transition from the DOS at the to the unoccupied states.
In the case of SrFe4Sb12, a shoulder structure (unclear, but it is not flat) in the spectrum appears at around 0.9 eV that corresponds to that at 0.8 eV in LaFe4Sb12. In addition, an additional peak in the appears at 25 meV. Roughly speaking, the additional peak can also be explained by unoccupied states in the DOS, as shown in the inset of Figure 4. However, the peak in the spectrum is located at 25 meV as compared with the location of the DOS peak at 50 meV. sk06-2 The origin of this difference is discussed later. Due to the rigid-band-like shift of the , the peak structure that is located below the in LaFe4Sb12 is pushed up above the in SrFe4Sb12. Coincidently, the “V”-shaped DOS peak located 40 meV below the in LaFe4Sb12 is moved up to the . spectra with a narrow pseudogap structure, which commonly appears in Fe4Sb12 materials, reflect the “V”-shape DOS of the . Joerg06 ; sk06-1
In the case of SrRu4Sb12 and BaRu4Sb12, a broad peak in the spectra appears at 0.2 eV that is consistent with the peak in unoccupied states in the DOS as shown in Figure 4. In addition, shoulder structures in the spectra appear at 1.25 and 1.35 eV in SrRu4Sb12 and BaRu4Sb12, respectively, that corresponds to additional states of the DOS. Based on this analysis, it was concluded that the spectra of LaFe4Sb12, SrFe4Sb12, SrRu4Sb12 and BaRu4Sb12 shown in Figure 4 correspond to unoccupied states in the DOS.
In the Os-compounds, the spectra can not be explained by these unoccupied states. According to Figure 3, DOS fine structures exist not only above but also below the for these materials. It is then possible for the occupied states to also determine the spectra. An additional comparison of the calculated spectra from the band structure calculations to the experimental spectra is then required.
To clarify the effect of the different atoms in Fe, Ru and Os to the electronic structure in detail, the experimental spectra are compared with the theoretical ones obtained from the band structure calculation. The spectra due to interband transitions are derived from the function as follow in which the direct transition is assumed; Ant04
Here, the and states denote the occupied and unoccupied states, respectively, is the Fermi-Dirac function, is the energy difference of the unoccupied and occupied states and is the lifetime parameter. In the calculation, = 1 meV was assumed.
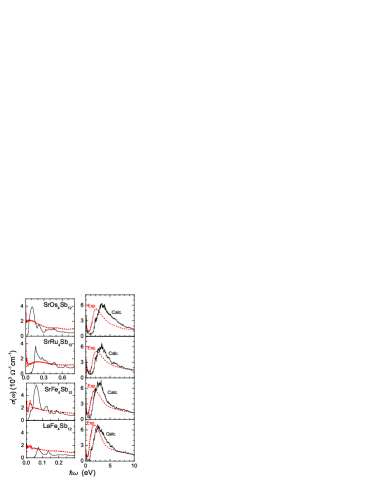
The calculated spectra of SrSb12 ( = Fe, Ru, Os) and LaFe4Sb12 and the corresponding experimental spectra are shown in Figure 5. The experimental spectra over the wide energy range in the right figures of Figure 5 has a tail towards the higher energy side, which was reproduced by the calculation with reasonable accuracy. However, the large peak experimentally observed at around = 2 eV that corresponds to the interband transition from the valence to conduction bands is located at about 3 eV in the calculated spectra. The experimental peak slightly shifts to the higher energy side changing from = Fe to Os, and the corresponding peak in LaFe4Sb12 is located at a lower energy than that of SrFe4Sb12. The shifts in the peak energies are consistent with the calculations. By comparison, the spectral features in the lower energy region shown in the left figures in Figure 5 drastically change with changing . In the case of SrFe4Sb12, as reported in previous papers, Joerg06 ; sk06-2 a pseudogap appears below 14 meV, and a peak is present at around 25 meV. In comparing the calculated spectra with LaFe4Sb12, the spectrum of SrFe4Sb12 has a peak at 60 meV. This peak was assumed to correspond to the experimental peak at 25 meV despite the large energy difference. The origin of this inconsistency is discussed later.
In the case of SrRu4Sb12, a broad peak was experimentally observed at 0.2 eV. There is a corresponding peak at the same energy in the calculated spectrum. In the case of SrOs4Sb12, two peaks at 0.1 and 0.5 eV and a shoulder at 0.22 eV were experimentally observed. All of these structures were reproduced by the calculation. BaOs4Sb12 exhibited the same result as SrOs4Sb12 (results not shown). Based on this, all of the experimental spectra of the Sb12 materials reported here can be qualitatively reproduced by the band calculation. In comparison with the other experiments, the order of the peak energies for is the same as for the other physical properties of these materials. For instance, the electronic specific heat coefficient is 100, 10 and 45 mJ/mol K2 in = Fe, Ru, Os, respectively. This indicates that the low energy peak in the spectra as well as the shape of the DOS near the strongly affects the thermodynamical physical properties in Sb12 materials.
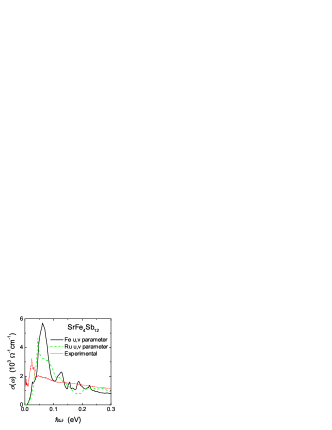
The possibilities of the origin of the difference of the spectral shapes among = Fe, Ru, Os in the infrared region include the different positional parameters of Sb ions and the differences in the wave function of the electrons due to the different principal quantum numbers. In order to ascertain the effects of the different positional parameters, the spectrum of SrFe4Sb12 with the positional parameter of the Ru-counterpart was calculated, as shown in Figure 6. The characteristic peak at 60 meV is again present even using the Ru positional parameters, although the intensity is lower. This result indicates that the positional parameters of Sb ions do not affect the electronic structure near the , but the differences in the wave functions of the states in = Fe, Ru, Os are dominant. Therefore, the differences in the physical properties among these materials also originate from the different wave functions of the states. Particularly in the case of SrFe4Sb12, the electronic structure near the is largely determined by the Fe – Sb hybridization state. The pseudogap structure is concluded to originate from the localization of the Fe state. As noted previously, the experimentally obtained peak energy of 25 meV for SrRu4Sb12 is lower than the calculated one (60 meV), which is not the case for the other compounds. This low energy shift in the experimental peak might be due to the renormalization effect arising from the strong electron correlation or due to the self-energy effect observed in the photoemission spectra. Kord05 The existence of heavy quasiparticles originating from the Fe state has been previously reported. sk06-1 The origin of the heavy quasiparticles is believed to be the Kondo effect resulting from the hybridization between the localized Fe state and conduction band. However, since SrFe4Sb12 is located very near the ferromagnetic ordering state, the spin fluctuation effect must also be considered. Heavy quasiparticles due to the spin fluctuation are also predicted by the SCR theory. Hasegawa79 ; Moriya91 Both the peak shift and the presence of heavy quasiparticles suggest the Fe state in SrFe4Sb12 has stronger electron correlation than the Ru- and Os-compounds.
IV Conclusion
In summary, to investigate the electronic structure of the Sb12 cage in Sb12 ( = Sr, Ba, La, = Fe, Ru, Os) materials, we measured the optical conductivity [] spectra and compared with band structure calculations as well as calculated spectra. Both the energy shift of the plasma edge due to the different valence number of guest atoms in the Fe4Sb12 cage and the corresponding band calculation suggest the hole-type carriers. The experimental spectra were reasonably well reproduced by the band calculations using experimental lattice constants and positional parameters. The spectra of SrSb12 ( = Fe, Ru, Os) in the infrared region drastically change with different . The origin of this change does not originate from the different positional parameters of Sb ions but from the different wave functions of states due to the different principal quantum numbers of ions.
ACKNOWLEDGMENT
We would like to thank Prof. K. Takegahara for the fruitful discussion and suggestions. This work was a joint studies program of the Institute for Molecular Science (2005) and was partially supported by a Grant-in-Aids; the COE Research (Grant No. 13CE2002), the priority area ”Skutterudite” (No. 15072205) and Scientific Research (B) (No. 18340110) from MEXT of Japan.
References
- (1) Y. Aoki, A. Tsuchiya, T. Kanayama, S. R. Saha, H. Sugawara, H. Sato, W. Higemoto, A. Koda, K. Ohishi, K. Nishiyama, and R. Kadono, Phys. Rev. Lett. 91, 067003 (2003).
- (2) A. Miyake, K. Shimizu, C. Sekine, K. Kihou, and I. Shirotani, J. Phys. Soc. Jpn. 73, 2370 (2004).
- (3) T. Tayama, J. Custers, H. Sato, T. Sakakibara, H. Sugawara, and H. Sato, J. Phys. Soc. Jpn. 73, 3258 (2004).
- (4) K. Hachitani, H. Fukazawa, Y. Kohori, I. Watanabe, C. Sekine, and I. Shirotani, Phys. Rev. B 73, 052408 (2006).
- (5) H. Sato, H. Sugawara, D. Kikuchi, S. Sanada, K. Tanaka, H. Aoki, K. Kuwahara, Y. Aoki, and M. Kohgi, Physica B 378-380, 46 (2006).
- (6) K. Takegahara, H. Harima, and A. Yanase, J. Phys. Soc. Jpn. 70 (2001) 1190; ibid 70 (2001) 3468; ibid 71, 372 (2002).
- (7) H. Harima and K. Takegahara, J. Phys.: Condens. Matter 15, S2081 (2003).
- (8) A. Leithe-Jasper, W. Schnelle, H. Rosner, N. Senthilkumaran, A. Rabis, M. Baenitz, A. Gippius, E. Morozova, J. A. Mydosh, and Y. Grin, Phys. Rev. Lett. 91, 037208 (2003).
- (9) A. Leithe-Jasper, W. Schnelle, H. Rosner, M. Baenitz, A. Rabis, A. A. Gippius, E. N. Morozova, H. Borrmann, U. Burkhardt, R. Ramlau, U. Schwarz, J. A. Mydosh, Y. Grin, V. Ksenofontov, and S. Reiman, Phys. Rev. B 70, 214418 (2004).
- (10) G. Sheet, H. Rosner, S. Wirth, A. Leithe-Jasper, W. Schnelle, U. Burkhardt, J. A. Mydosh, P. Raychaudhuri, and Yu. Grin, Phys. Rev. B 72, 180407(R) (2005).
- (11) J. Sichelschmidt, V. Voevodin, H. J. Im, S. Kimura, H. Rosner, A. Leithe-Jasper, W. Schnelle, U. Burkhardt, J. A. Mydosh, Yu. Grin, and F. Steglich, Phys. Rev. Lett 96, 037406 (2006).
- (12) S. Kimura, T. Mizuno, H.J. Im, K. Hayashi, E. Matsuoka, and T. Takabatake, Phys. Rev. B 73, 214416 (2006).
- (13) K. Koga, K. Akai, K. Oshiro, and M. Matsuura, Phys. Rev. B 71, 155119 (2005).
- (14) T. Takabatake, E. Matsuoka, S. Narazu, K. Hayashi, S. Morimoto, T. Sasakawa, K. Umeo, and M. Sera, Physica B 383, 93 (2006).
- (15) E. Matsuoka, K. Hayashi, A. Ikeda, K. Tanaka, T. Takabatake, and M. Matsumura, J. Phys. Soc. Jpn. 74, 1382 (2005).
- (16) M. Matsumura, G. Hyoudou, H. Kato, T. Nishioka, E. Matsuoka, H. Tou, T. Takabatake, and M. Sera, J. Phys. Soc. Jpn. 74, 2205 (2005).
- (17) E. Matsuoka, S. Narazu, K. Hayashi, K. Umeo, and T. Takabatake, J. Phys. Soc. Jpn. 75, 014602 (2006).
- (18) K. Fukui, H. Miura, H. Nakagawa, I. Shimoyama, K. Nakagawa, H. Okamura, T. Nanba, M. Hasumoto, and T. Kinoshita, Nucl. Instrum. Methods Phys. Res. A 467-468, 601 (2001).
- (19) M. Dressel and G. Grüner, Electrodynamics of Solids, (Cambridge University Press, Cambridge, UK, 2002).
- (20) P. Blaha, K. Schwarz, G. K. H. Madsen, D. Kvasnicka, and J. Luitz, WIEN2K, Vienna University of Technology, 2001, improved and updated Unix version of the original copyrighted WIEN code, which was presented by P. Blaha, K. Schwarz, P. Sorantin, and S. B. Trickey, Comput. Phys. Commun. 59, 339 (1990); URL http://www.wien2k.at .
- (21) J.W. Kaiser and W. Jeitschko, J. Alloys and Comp. 291, 66 (1999).
- (22) Tsubota, private communication.
- (23) J. Sichelschmidt et al., preprint.
- (24) S. Kimura, H.J. Im, Y. Sakurai, T. Mizuno, K. Takegahara, H. Harima, K. Hayashi, E. Matsuoka, and T. Takabatake, Physica B 383, 137 (2006).
- (25) V. Antonov, B. Harmon, and A. Yaresko, Electronic Structure and Magneto-Optical Properties of Solids, (Kluwer Academic Publishers, Dordrecht, The Netherlands, 2004).
- (26) A.A. Kordyuk, S.V. Borisenko, A. Koitzsch, J. Fink, M. Knupfer, and H. Berger, Phys. Rev. B 71, 214513 (2005).
- (27) H. Hasegawa, J. Phys. Soc. Jpn. 46, 831 (1979).
- (28) T. Moriya and Y. Takahashi, J. Phys. Soc. Jpn. 60, 776 (1991).