Magnetron sputter deposition of a 48-member cuprate superconductor library: Bi2Sr2YxCa1-xCu2O8+δ (0.51) linearly varying in steps of .
Abstract
Using magnetron sputtering, a spatial composition spread approach was applied successfully to obtain 48-member libraries of the Bi2Sr2YxCa1-xCu2O8+δ (0.5x1) cuprate superconducting system. The libraries of each system were deposited onto (100) single crystal MgO, mounted on a water cooled rotating table, using two targets: the antiferromagnetic insulator Bi2Sr2YCu2O8+δ (P=98 W RF) and the hole doped superconductor Bi2Sr2CaCu2O8+δ (P=44 W DC). A low chamber pressure of 0.81 mTorr argon is used to reduce scattering by the process gas. To minimize oxygen resputtering a substrate bias of -20 V was used as well as a process gas free of oxygen. A rapid thermal processor is used to post-anneal the amorphous deposited films. A step annealing regime was used, with a ramp rate of 5 ∘C/s for heating and cooling, with a first plateau at 780 ∘C held for 200 s, and a second at 875 ∘C held for 480 s. X-ray diffraction reveals that the films develop crystalline order with the c-axis lattice parameter contracting linearly from 30.55 Å (x=0.5) to 30.24 Å (x=1.0) with increasing Y-content, consistent with bulk values. The crystallized films are polycrystalline, developing preferred orientation (c-axis parallel to the substrate) for thinner members of the library. There is a change of 0.01 in doping per library member which will enable further studies to densely map phase space.
pacs:
81.15.-z, 81.15.Cd, 74.78.-w, 74.78Bz, 74.72Hs, 68.55Nq.I Introduction
It has been accepted for a long time that the temperature-hole concentration phase diagram holds the key to our understanding of the cuprate superconductors. Researchers have primarily sampled phase space discretely, using high quality single crystals, and have identified a number of important features such as the pseudogaptimusk99 - a region of the phase diagram which is marked by the supression of low energy excitations below a temperature T*. Understanding the doping dependence of this feature, especially near optimal doping (p=0.16) is thought to hold the key to determining whether the pseudogap is a friend or foe of superconductivitynorman05 . That is, whether T* merges with Tc, the superconducting onset temperature, or ends abruptly at optimal doping is thought to determine, respectively, whether the pseudogap phase is a precursor to, or competes with, superconductivity. Answering this question requires a dense map of phase space in order to trace the behaviour of T* and Tc. Combinatorial materials science offers a method whereby such a dense map of phase space can be obtained.
Combinatorial materials science methods produce various compositions on a spatially addressable substrate. In particular, one may produce a continuous variation in composition across a substrate using physical vapor deposition techniques. This spatial composition spread approach is therefore of benefit when one wishes to map phase space densely. Although CMS methods have been used to show that particular superconducting phases can be preparedxiang95 , to the author’s knowledge the composition spread approach has not been used to map phase space of the cuprates and this report therefore represents the first step towards this goal. In this paper, the spatial composition spread approach is applied to the superconducting system Bi2Sr2YxCa1-xCu2O8+δ, where varies quasi-continuously between 0.5 and 1.
II Experimental
The composition spread approach uses simultaneous, magnetron sputtering of two targets, e.g. A and B. Masks are placed over each target to produce a variation in the mass deposited onto a rotating substrate as described in more detail in referencedahn02 . When the mass varies linearly for one target and is constant for the other, and the rotation speed is sufficient to intimately mix the atoms, by an appropriate choice of the powers applied to each target a film composition A1-xBx (0.5 x 1) is produced. To produce Bi2Sr2YxCa1-xCu2O8+δ with 0.5x1, one may therefore co-sputter two targets: A=Bi2Sr2CaCu2O8+δ(Bi-Ca-2212)and B=Bi2Sr2YCu2O8+δ(Bi-Y-2212).
II.1 Target preparation
Targets of nominal composition (slightly enriched with Ca and Sr) Bi2.0Sr2.05Ca1.1Cu2O8+δ and Bi2.0Sr2.05Y1.1Cu2O8+δ are made through the same three-stage solid-state reaction. Powders of Bi2O3 (99.975%, Alfa-Aesar), SrCO3 (99.99%, Alfa-Aesar), CaO (99.95%, Alfa-Aesar) and CuO (99.7%, Alfa -Aesar) are mixed in the appropriate stoichiometric ratios and ground together for two hours using an agate auto grinder. The mixture is placed in an Al2O3 crucible and reacted in air inside a Thermolyne 48000 box furnace. The first reaction, which calcinate the powders, is at 800 for 12 h (slow heat/slow cool at /min). After the first reaction, the powder is ground for 2 h. The next two reactions are also in air and at a temperature of . In between these two reactions the powder is ground for 2 hours. Once the target powders are synthesized, they are pressed into pucks and hardened before use. To accomplish this, the powder is ground manually with an agate mortar and pestle and sifted through a 70 m sieve. Next, approximately 40 g of the sieved powder is pressed into a 5.08 cm (2 in.) diameter by 0.5 cm thick disc using a pressure of 13,000 psi. The disc is sintered for 30 hrs at (Bi-Ca-2212) or 900 ∘C (Bi-Y-2212) to harden the target and reduce porosity.
II.2 Film deposition
The film deposition apparatus is a Corona Vacuum Coaters V-37 sputtering system equipped with 5 magnetrons configured in a side-sputtering arrangement (on-axis), where the substrate is directly across (5.5 cm) from the target. To power the magnetrons either an Advanced Energy MDX-1KDC supply or a combination of an Advanced Energy RFX-600 generator and RTX-600 tuner is chosen for the Bi-Ca-2212 (conductor) and Bi-Y-2212 (insulator) targets, respectively. The film was deposited onto a water-cooled, rotating table (43 cm diameter) upon which two sets of three 1 inch x 1 inch single crystal MgO (100) substrates (Superconductive Components Inc.) were placed radially to cover the 75 mm sputtering track. A slotted aluminum mask, consisting of fifty-six 0.5 mm slots separated by 1.52 mm, is placed over each set. The mask therefore produces a 48-member library. Thus, the difference in composition between each adjacent library member is . In front of the Bi-Y-2212 target a mask was placed to produce a constant profile of mass deposited on the substrate while the Bi-Ca-2212 had a mask that produced a linear variation in mass deposited on the substrate. The chamber was pumped down to a base pressure of 3.9x10⁻⁷ Torr, then an argon flow of 2 sccm was initiated to create a process gas pressure of 0.81 mTorr. It is important to note that oxygen was not added to the process gas as it leads to greater resputtering of the film. A bias of -20 V was applied to each mask using a carbon brush assembly (detailed elsewheresanderson05 ). The targets were co-sputtered while the substrate table rotated at constant rate of 15 revolutions per minute. The Bi-Ca-2212 target was powered by a DC supply operating at 44 Watts, while the Bi-Y-2212 target was powered by an RF supply operating at 98 W. These powers are chosen to produce equal sputtering rates, in order to deposit the desired range of compositions (0.5x1), where .
II.3 Post annealing
Post-annealing using a Rapid thermal Processor RTP-600S (Modular Process Technology Corp.) was performed on the amorphous as-deposited films in dry air. A step annealing regime was found to result in the best films. The regime starts with a ramp at 5 oC per second to 780oC which is held for 200 seconds, followed by another ramp a 5 oC/sec to 875 oC which is held for 480 seconds. The RTA is then cooled at 5 oc/sec to room temperature.
II.4 Composition analysis
Composition of the films was determined using energy dispersive spectroscopy (EDS) measurements. Al foil strips were taped onto glass microscope slides and placed on the table. Following film deposition, the Al foil strips were removed from the microscope slides and affixed to an Al holder using double sided Cu tape. These were analyzed for elemental composition using a JEOL JXA-8200 Superprobe energy dispersive spectrometer equipped with a Noran energy detector (0.133 keV energy resolution). A 7.0 kV electron beam with a 50 nA current is used to analyze a 10 m spot of the film.
II.5 Structural analysis
For all deposited films, X-ray diffraction (XRD) spectra were collected using an Inel CPS-120 with a curved position sensitive detector. The Cu X-ray beam is incident upon the sample at approximately 6 degrees and the curved position sensitive detector collects all scattered X-rays from 2 = 4 to 120 degrees. Collection time for the XRD spectra is 1800 seconds. The Inel has computer controlled translation stages to scan samples precisely and efficiently.
II.6 Thickness measurement
The film thickness is measured using a Veeco Dektak 8M, by dragging a 12.5 stylus with a force of 24.4 over the film.
III Results
The composition of the films before and after post-annealing treatment is shown in Fig. 1

Figure 1 shows that post-annealing has no significant effect on the elemental ratios, given an error of 5 % in the estimates.
The obvious question is whether the compositions in Fig. 1 reflect the Bi2212 phase. While the Ca, Y content seems consistent with expectations, the Bi:Cu and Sr:Cu ratios seem systematically high, compared with the expected value (dashed line in Fig. 1). The first step is to determine the ratio of Bi:Sr, as shown in Fig. 2.
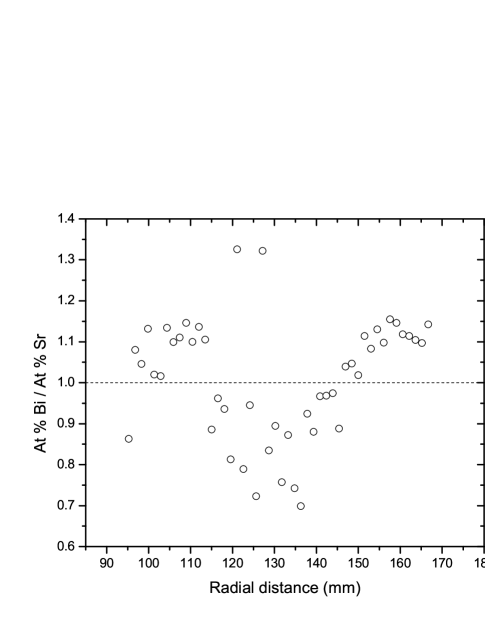
It is clear from this figure that most of the values are in the range 0.7 to 1.15. It is known that Bi2212 can be formed for a relatively large Bi:Sr range around 0.9-1.4 vanderah97 . Therefore, one expects the structure to be crystalline Bi2212 except perhaps in the range of radial distances 120-140 mm. To determine the structure, X-ray diffraction is carried out for the entire library and the results are shown in the 3D plot of Figure 3.
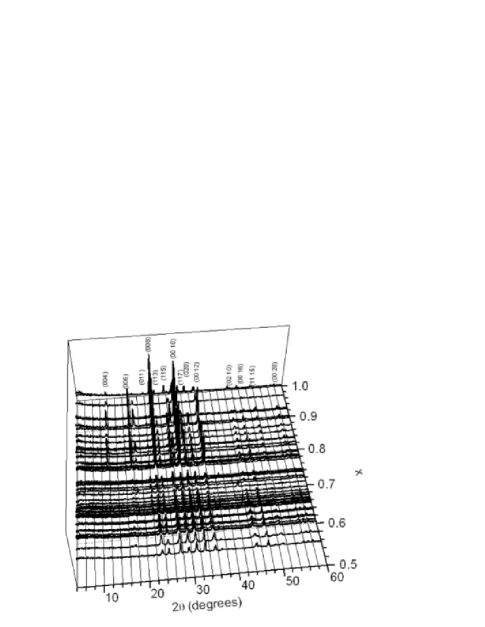
All reflections can be indexed to orthorhombic Bi2212 structure, despite the range of Bi:Sr values seen in Fig. 2. It is surprising but fortuitous that the structure corresponds to Bi2212 in the range 120-140 mm, given the Bi:Sr ratios.
Reflections from (00l) planes dominate the XRD patterns, leading to the conclusion that the film is primarily oriented with the c-axis perpendicular to the substrate, especially for . To understand this behaviour the thickness of the library is measured at 10 points and the results are shown in Figure 4.

The library is 0.5-0.6 thick in the Y-rich range , changing gradually to 1.0-1.1 for Y-contents . The thickness does not change in a linear manner, which the linear plus constant profile should produce. However, as is evident in Fig. 1, there is some resputtering which would reduce the film thickness in the central region of the library, as observed in Fig. 4. The library image of Figure 5 also shows

effects of resputtering, as the film also looks to be depleted in the range 110-148 mm. It is known that epitaxial growth is stabilized for very thin films. Thus, as expected, pseudo-epitaxial growth is stabilized in the Y-rich region.
Finally, the c-axis lattice parameter is determined in order to ascertain whether the changes are consistent with those of bulk Bi2212 doped with Y. The results are plotted in Figure 6.
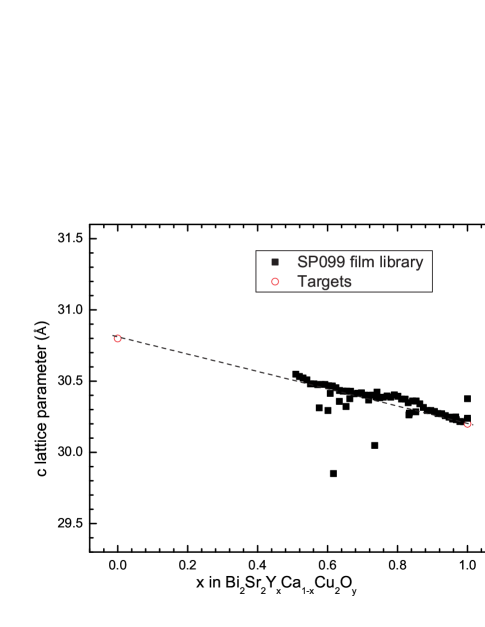
It reveals a trend that is clearly consistent with changes in bulk Bi2212.
IV Conclusions
Structural and composition analysis has revealed that a spatial composition spread approach has been successfully applied to the cuprate superconductor system, Bi2Sr2YxCa1-xCu2O8+δ (0.5x1). A 48-member library is produced with the composition varying in a linear manner over the range 0.5x1, corresponding to a change in Y-content of 0.01 per library member. The changes in the lattice parameter are consistent with those of bulk, and preferred orientation is observed for thinner members of the library. These films are now being used to densely map the electronic properties of phase space.
V Acknowledgements
The financial support of the Natural Sciences and Engineering Research Council of Canada is gratefully acknowledged. KH would like to thank Ichiro Takeuchi for useful discussions.
References
- (1) T. Timusk and B. Statt. Rep. Progress in Phys. 62, 61 (1999).
- (2) M. R. Norman, D. Pines and C. Kallin, Adv. in Phys. 54, 715 (2005).
- (3) X. D. Xiang, X. Sun, G. Briceno, Y. Lou, K-A. Wang, H. Chang, W. Wallace-Freedman, S-W. Chen and P. Schultz, Science 268, 1738 (1995).
- (4) J.R. Dahn, S. Trussler, T.D. Hatchard, A. Bonakdarpour, J.N. Meuller-Neuhaus, K.C. Hewitt and M. Fleischauer, Chem. Mater. 14, 3519 (2002).
- (5) R. J. Sanderson and K. C. Hewitt, Physica C 425, 52 (2005).
- (6) T. A. Vanderah, R. S. Roth and H. F. McMurdie, Ed. Phase diagrams for High-T superconductors II. (The American Ceramic Society, Westerville, OH, USA) pg. 211,214 (1997)