Preferential Behaviour and Scaling in Diffusive Dynamics on Networks
Abstract
We study the fluctuation properties and return-time statistics on inhomogeneous scale-free networks using packets moving with two different dynamical rules; random diffusion and locally navigated diffusive motion with preferred edges. Scaling in the fluctuations occurs when the dispersion of a quantity at each node or edge increases like the its mean to the power . We show that the occurrence of scaling in the fluctuations of both the number of packets passing nodes and the number flowing along edges is related to preferential behaviour in either the topology (in the case of nodes) or in the dynamics (in case the of edges). Within our model the absence of any preference leads to the absence of scaling, and when scaling occurs it is non-universal; for random diffusion the number of packets passing a node scales with an exponent which increases continuously with increased acquisition time window from at small windows, to at long time windows; In the preferentially navigated diffusive motion, busy nodes and edges have exponent , in contrast to less busy parts of the network, where an exponent is found. Broad distributions of the return times at nodes and edges illustrate that the basis of the observed scaling is the cooperative behaviour between groups of nodes or edges. These conclusions are relevant for a large class of diffusive dynamics on networks, including packet transport with local navigation rules.
1 Introduction
In transport processes on networks complex dynamical behaviour may be caused by the structure of underlying network geometry (for a recent review see [1] and references therein). The inhomogeneous degree distributions found in the scale-free networks may be one cause of this behaviour, however, other structural details appear to be essential when dynamics include the local navigation of packets [1, 2, 3]. Queuing effects at nodes, which is essential for high density information packet transport [1, 2, 3, 4, 5, 6], and is usually absent in other transport processes such as charge transport [7], is another cause of collective behaviour in transport dynamics.
Many dynamically measurable outputs exhibit scaling features, indicating a degree of universality that, in turn, can be used to probe a network’s structural and traffic properties [1]. Distributions of transport times, waiting times and noise fluctuations exhibit power-law behaviour in different network models. However, it is not an easy task to relate the emergent dynamical features to particular structural properties, firstly because of the network’s power-law inhomogeneity but also because different structural elements, i.e., nodes or edges, or higher (hidden) structures, may play a role in the dynamics. Therefore, a more systematic study of traffic scaling properties, that considers structure beyond the node’s connectivity, is necessary in order to reveal the origin of scaling and relate the observed scaling properties to the specific structural and dynamical features on complex networks.
In view of the long-range correlations in packet streams on inhomogeneous networks, analysis of traffic noise, defined by the number of packets processed by a node, and traffic flow, the number of packets passing along an edge, can give interesting information about traffic conditions and the underlying network structure [1]. In recent studies a multi-channel analysis of traffic noise on networks [8, 9, 10] reveals that the set of fluctuations of the traffic time-series measured at all nodes in the network obeys the scaling law
| (1) |
The exponent is often found to be either or , suggesting a super-universal behaviour across different networks [8]. However, recently it was found [9, 10, 1] that the exponent may depend on traffic conditions and the type of measurements taken. Similar results, in which non-universal scaling was found to depend on the acquisition time window, where found in the analysis of stock market time series [11]. A unique exponent between these two universal values was also found in the analysis of the genome-wide time series of the gene expression of yeast [12], the dynamics of which is naturally limited by the cell cycle.
In this paper we address the question of scaling in the diffusive dynamics on networks, by carefully selecting the inhomogeneity of the network and the dynamical rule, in order to determine the origin of the scaling and its robustness. To demonstrate the importance of these dynamic phenomena in real-world networks, we employ a non-trivial model for the transport of information packets [13, 2, 3, 1]. For the purpose of this work we use a simple scale-free network [14, 15] with a clear inhomogeneity in the node connectivity but with low clustering and no edge correlations. We consider two types of diffusive motion of the packets on the graph: random diffusion and local navigation with preferred edges, as described below.
In comparison to the models considered in [8, 9], our traffic model is more realistic in that:
-
•
Packets are created at a given rate and travel to specified destinations on network;
-
•
Packets queue dynamically at nodes;
-
•
Packets are navigated locally according to a specified algorithm.
Consequently the travel-times are determined self-consistently rather than being fixed as an adjustable external parameter of the model and have a broad distribution with a power-law tail, which depends on the network structure navigation algorithms [2, 16]. The waiting times of packets in queues is another property of our model that is determined self-consistently by the dynamics. Depending on the type of queuing discipline employed, the waiting time distribution can also have a power-law tail on scale-free networks [2]. Throughout this work we use low packet densities in order to keep the time series of traffic noise and flow stationary and avoid the effect of large queuing times (see [1] for a study of dense traffic on structured networks).
Our main findings suggest that the presence of a preference in either the topology, such as in node connectivity, or in the dynamics, such as by edge-preferred navigation, leads to the scaling of fluctuations. When this scaling occurs, careful analysis shows that it is non-universal, depending both on the acquisition-time and on the importance of the nodes or edges in the transport process. These findings of collective dynamical behavior on networks are further substantiated with a study of the return-times statistics for nodes and edges.
The organization of this paper is as follows. In section 2 we define the network and the traffic model and summarize the main features of the transport process. In section 3 the results for noise and flow fluctuations are given for various parameters and dynamic rules and in section 4 the origins of scaling are discussed and compared with transport on much simpler geometries. In section 5 the results for the return-times distributions are obtained for the network dynamics studied in section 3, and section 6 gives a short summary and discussion of our results.
2 Traffic of information packets with queuing and navigation on network
2.1 Network structure
We consider a simple scale-free network [14, 15] with a power-law inhomogeneity in node connectivity, low clustering and no correlations between edges. Such a network can be easily grown with a preferential attachment rule in which a node with two links is added to the network at each time step and each link is connected to a node of degree with a rate proportional to . In the emergent structure the degree of the added node , and hence the connectivity distribution has a power-law tail, with , as shown analytically [15]. A detailed analysis of the structure of the networks grown in this way shows that the clustering is very low and link correlations are entirely absent, in contrast to correlated scale-free networks, grown with the algorithms described in [17]. For our simulations of packet diffusion we grow a simple uncorrelated scale-free network of nodes and edges, which has a connectivity distribution with a power-law exponent .
Once the network is generated, we consider it’s structure as fixed, and start the transport processes on it. During these dynamics, at each time step each node can create a new packet with probability . At creation each packet is assigned a destination address, another node on the network where it should be delivered. Packets move diffusively through the network, either performing a random walk or navigated according to the algorithm described below. Once at the destination address packets disappear from the network. In this model packets move towards their destination simultaneously, forming queues at the nodes on the way. We assume a finite queue buffer of length at each node. The first in - first out (FIFO) queuing discipline is applied. The maximum length of the queue is important for transport close to the congestion state and has an impact on the scaling of the fluctuations on nodes [1, 10].
2.2 Random diffusion and edge-preferred navigation
The motion of packets through the network can either be random or navigated using some rules, which may affect the role of different nodes and edges in the transport process. In the case of random diffusion (RD) a node that is processing a packet selects one of its neighbouring nodes at random to send the packet to it. Hence the nodes on the network are visited at a rate proportional of their connectivity, and hence nodes with a high connectivity are often visited by moving packets. Implementation of a navigation algorithm [18, 1] will create a bias in the use of nodes and edges on a given topology. Here we consider one such navigation algorithm, referred to as the CD algorithm, that introduces a preference for less used edges in the traffic history [18]. In particular, a node that is processing a packet at time step selects one of its neighbour nodes, , that has the minimum value of the quantity defined as the product
| (2) |
where is the degree of the node and is the number of packets forwarded from node up to the time . This means that the CD algorithm is completely deterministic, involves a search of the nearest neighbourhood of the processing node, prefers to send packet to nodes away from the hubs and hence introduces a dynamical inhomogeneity to the network transport. In this way, from the point of view of nodes, the topological inhomogeneity of the network appears to be dynamically reduced. At the same time, an unequal use of edges appears, that is measured by the packet flow on them. Note that this property of the navigation rules may reduce jamming problems at high traffic density, which often occur on scale-free networks in algorithms based on the shortest paths [18]. We consider low packet density by keeping a low posting rate , which is much below the jamming rate for this network’s structure and navigation rules, in order to minimize the potential effects of long queues and to retain the stationarity of the traffic time series.
2.3 Traffic properties
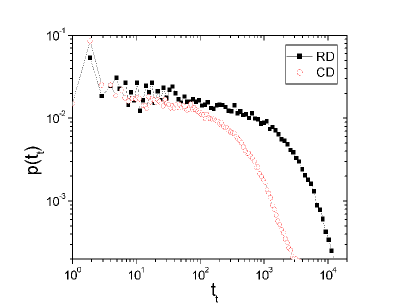
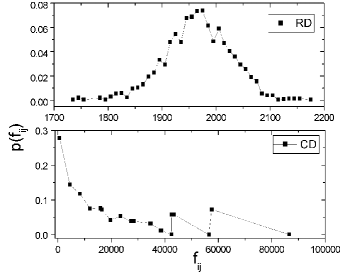
For the fixed network topology described above and a fixed posting rate of packets , we simulate packet transport both with random diffusion rules and with the CD navigation algorithm. The transport properties are measured by a number of global and local statistical quantities [13, 2, 3, 1], which depend on the diffusion rules. Here we summarize several traffic properties which are relevant for further discussion. In Fig. 1 we show how the two diffusion rules effect the distributions of travel times of packets and flow along the edges on the scale-free network. Both in the random diffusion and in the navigated transport the distribution of travel times exhibits a power-law tail, however, both slopes and cut-offs are different. The distribution of dynamic flow along edges of the network is shown in Fig. 1b. For RD the dynamical flow is similar to the topological flow (the centrality measure of edges) and is dominated by an average value with a width which depends on the packet density. In contrast, the CD navigation algorithm induces a non-symmetric flow distribution created by the dynamically preferred edges.
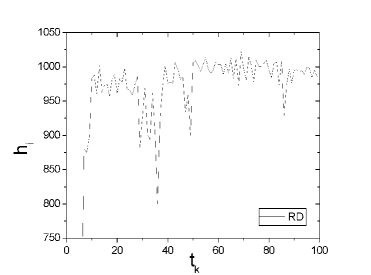
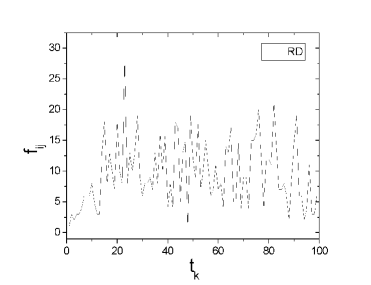
Further differences in traffic with the two diffusion rules are shown in the time series of the number of packets processed by individual nodes and edges, shown in Fig. 2. A detailed analysis of such time series is given in the following section.
 |
 |
 |
 |
3 Scaling of Noise and Flow
Noise and flow are two local characteristics of the traffic that are determined by the number of packets transported in a given time window at a node , and along a link and , . The index enumerates time windows of length time steps.
The flow can be written as
| (3) |
where . During the transport process we record a set of fluctuating time-series, one for each of nodes , , and similarly another set of time-series collected for each of the edges on the network. In the simulations we fix the creation rates of packets at for the RD and for CD-navigated diffusion, which are well below the respective jamming rates on this network structure.
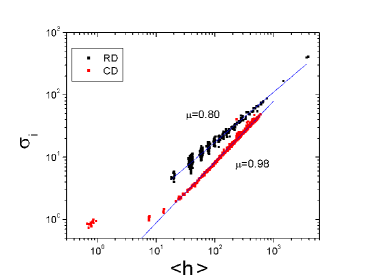
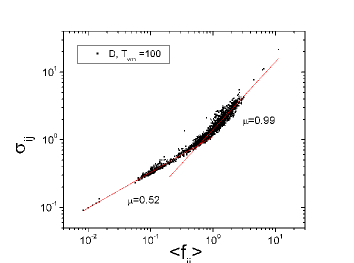
3.1 Noise fluctuations at nodes with scale-free connectivity
We determine the dispersion and an average of long time series recorded at all nodes , and . Plots of against are given in Fig. 3a, where each point represents one node of our scale-free network. The two curves correspond to the results for RD dynamics and for the transport with the CD navigation algorithm and a fixed acquisition time window time steps. As the Fig. 3a shows, these plots obey the scaling equation (1) with a well defined exponent , which is different for the two algorithms. For RD the value of is clearly between the two limits 1/2 and 1 mentioned above, whereas in the case of the CD navigation algorithm appears to be close to 1.
 |
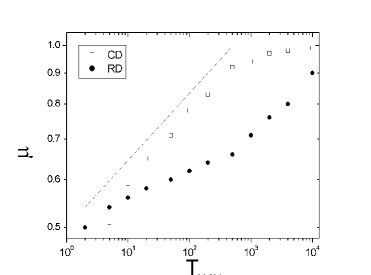 |
By changing the width of the time window in which the data is collected we find that the scaling law still holds, but with a different exponent . This applies for both RD and CD, however, the functional dependencies are different. The results are shown in Fig. 3b. As a rule, if data are acquired in a longer time window, the exponent tends to be larger. For RD we find the change from weak dependence at short time windows to steeper increase when large windows are applied. For CD the exponent is constantly large for large time windows, and changes rapidly when the windows are smaller than the typical time steps in these simulations. In fact, for CD we find that the dispersion between the groups of nodes exhibiting the scaling with large exponent is gradually reduced with decreasing time window and eventually the group becomes so condensed that an exponent cannot be defined. Simultaneously another group emerges with the scaling exponent close to .
3.2 Scaling of flow at preferred edges
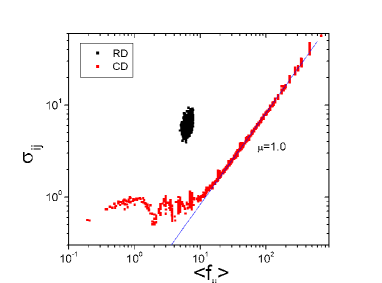
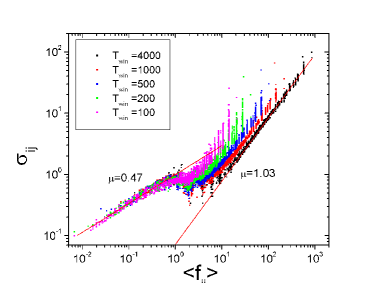
We apply a similar multi-channel analysis to the data on traffic flow fluctuations. The flow along an edge between nodes and is the sum of flow from and from . In Fig. 4 we plot the standard deviations of the flow time series against the average flow along that edge . Each point on the plot represents one edge on the network. As the Fig. 4a shows, in the case of CD navigated diffusion, flow fluctuations obtained at a large number of edges follow the same scaling pattern as that described in Eq. (1) for noise fluctuations at nodes. However, in the case of edges, the situation becomes different when random diffusion is used: the edges form a dense group on the plot, representing almost equal fluctuation properties. This implies that the dynamical preference in edges, which is built into the CD navigation rules, introduces both an uneven flow along different links and a different fluctuation pattern of the flow. The exponent that is measured from the data in Fig. 4a is close to . In the same plot we find another group of edges for which the scaling exponent cannot be defined. When the width of the time window is reduced the fraction of edges that belongs to the scaling regime with is reduced, and a number of edges appear in a new group, for which the scaling exponent is close to . The transition between these two groups is quite sharp for the deterministic CD navigation (see Fig. 4b). We investigate this question further by considering a simplified, probabilistic version of the edge-preferred navigation, called D algorithm [18], in which a packet moves from node to its neighbour with probability
| (4) |
where is the adjacency matrix and as before is the degree of node . Hence packets are more likely to move towards neighbours with a low connectivity. With this navigation rule, we find the flow fluctuations, shown in Fig. 5, exhibiting two distinct groups of edges with a smooth transition.
 |
 |
Study of the flow fluctuations suggests that the dynamical preference of edges, as in our navigation rules, introduces the necessary distinction between edges that leads to the scaling behaviour. In contrast to the noise fluctuations studied above, in flow fluctuations we did not observe a unique scaling exponent with a smooth dependence of the acquisition time window. According to their flow fluctuations, all edges appear to be in one of the two groups of well defined scaling exponents, either 1/2 or 1. The relative population of the groups changes, where the size of the group with the larger exponent is increasing with the length of the time window.
4 Origin of Noise Scaling on Complex Networks
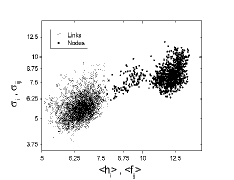
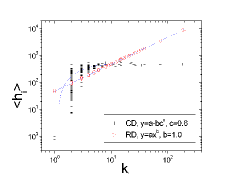
In the previous section a comparative analysis of the fluctuations of noise and flow suggested that in the diffusion processes a preference between network elements, that can be achieved in an inhomogeneous network, is necessary for the scaling of the type in Eq. 1 to occur. In order to further clarify this point, we have analysed different geometries including regular and homogeneous substrates.
In Fig. 6a and b we show the fluctuations of packets in random diffusion recorded on nodes and edges of a square lattice and of a random graph. Clearly, fluctuations of flow at edges on these structures appear to belong to one group within a statistical dispersion. However, the record of noise at different nodes already shows grouping according to their connectivity: on the square lattice one can distinguish between fluctuations in the number of packets processed by the four corner nodes, by nodes at the boundaries and by the rest of the nodes, whose the connectivity is four. A larger range of groups of nodes is found on a random graph, with connectivities ranging from 2 to 8 edges per node, where the larger connectivity nodes are shifted to the right part of the plot. In the same spirit, on the scale-free network the span of different groups of nodes, with different connectivities is even larger, also visible in Fig. 3a, and it is related to the connectivity profile. Therefore, the direct relationship between the node connectivity and the number of processed packets by that node (its dynamic centrality) occurs in the random diffusion. This represents the basis of the observed scaling of noise fluctuations on the scale-free networks. In Fig. 6c we show the emergent linear dependence between the average noise at a node and its connectivity for our scale-free network, which applies for the case of the random diffusion algorithm (see also [19]). However, when the diffusion rules are changed, as in our navigated diffusion, for example, these relationships are altered. We find that in the case of CD navigation the average number of packets at nodes of large connectivity plateaus according to the functional form , with .
Hence, nodes with different connectivity play a different role in the diffusion processes on networks. This idea of dissimilarity can be extended to the edges of the network when diffusion rules, such as our CD navigation, are implemented. Again, we observe distinct groups of edges which have different flow fluctuations, with more ’important’ groups having proportionally larger flow and large fluctuations.
 |
 |
 |
It is an intrinsic property of the diffusive dynamics that different groups of nodes or edges develop a cooperative behavior and fall on a line with a well defined profile, as given in Eq. (1). Our results for the diffusive dynamics of information packets suggest that stationarity of the time series is a necessary condition for such cooperativity to occur, whereas the dynamic continuity need not be strictly observed (in our model sources and sinks of packets occur, which are balanced in the average). Our results show that in topologically or dynamically inhomogeneous systems nodes or edges may develop different levels of cooperative behavior that leads to non-universal scaling. The non-universality is represented by the fact that the scaling exponent depends on the dynamics, with either a continuous change between the two limiting values , or with two exponents defined for different groups of edges. A possible origin of these two limiting values of the scaling exponent has been discussed in [8, 9, 11].
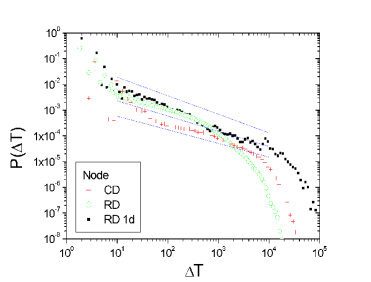
5 Return-Times to Nodes and Edges
Another type of dynamic measure collected at individual nodes and edges, that depends on the dynamic behaviour of the whole network, is the statistics of return-times, or time intervals between the successive events at a given node or an edge. In collective dynamical systems such as earthquakes [20, 21, 22], critical sandpiles [23, 24], and stock market dynamics [25, 26], a broad distribution of return times (sometimes called waiting times or recurrent times) is always found, with power-law tails suggesting the occurrence of long-range dynamic correlations between the events. In this work we address the question of return times to nodes and to edges in order to investigate further the nature of collective dynamic behaviour in our model of diffusion of packets on a scale-free network.
Return-Time to Nodes. In the case of random diffusion (random walks) on networks the return time distribution has been studied in other parts of the theoretical physics literature. In particular, the first return time to the origin of a random walker on sparse random graphs, with nodes representing states of a system, was considered by Bray and Rodgers [27] as a model of non-exponential relaxation in spin glasses and other non-ergodic systems. With the help of some heuristic arguments, they arrived at the conclusion that on a random graph the long-time behaviour in the diffusion in the phase space is dominated by the parts of the network with linear chains (no loops), leading to the expression , where is the homogeneous connectivity of the random graph and is known.
These arguments can be generalized to introduce a power-law distribution of connectivities. If the distribution of behaves like , and using the result in [27] that as , , then integrating over leads to with
| (5) |
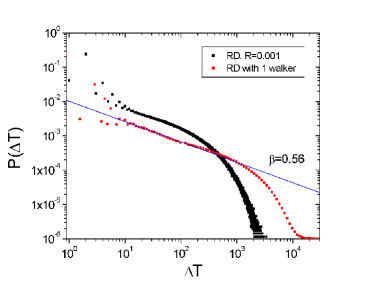
Thus, the inhomogeneous connectivity creates a power-law distribution in the return times distribution for RD. Recently a more rigorous treatment of random walks on scale-free networks was carried out by Noh and Rieger [19], that yielded identical results. The results of our simulations for different diffusion processes are shown in Fig. 7a. The return-time distributions in different cases studied here seem to have a power-law behaviour before a cut-off. (The cut-off can be related to the network size in the case of single random walker. Note also a characteristic splitting at small with an inherent preference for even return times, caused by the lack of clustering and the low density of walkers.) In the case of non-interacting random walks, i.e., random diffusion without queuing, the results agree, within error bars, with the above theoretical prediction. We have the exponent , whereas the distribution of the network’s connectivity has a power-law exponent (see Sec. 2).
Increasing the traffic density reduces the value of the cut-off, but the slope remains practically unchanged. However, when the navigated diffusion is considered, both the slope and the cut-off of the distribution are changed. In Fig. 7b we show the results for navigated diffusion with the CD algorithm, random diffusion with one-depth layer search and RD at low packet density.
 |
 |
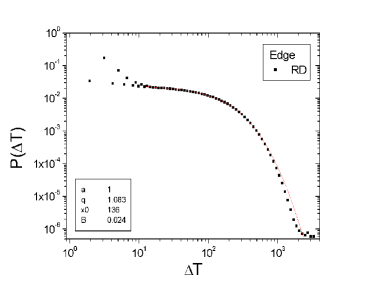
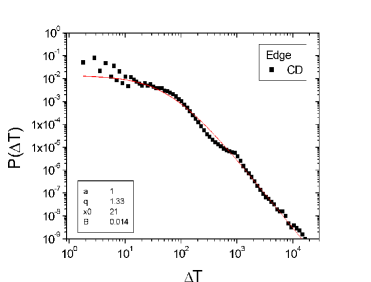
Return-Time to Edges. In contrast with the return times to nodes, the situation is entirely different from the point of view of edges on the same network. The results are shown in Fig. 8. We find a pronounced difference between the random and navigated diffusion in the tails of the distributions. In both cases, however, a unique functional form can be found. For larger the distributions of the return times to edges can be fitted with a exponential form, which is often related to non-ergodic behaviour in dynamical systems [28] :
| (6) |
In the case of random diffusion, shown in Fig. 8a, the distribution is very close to the exponential form, which corresponds to the limit of Eq. (6). In fact, we find in the case of random diffusion, whereas in the case of edge-preferred CD navigation , compatible with non-ergodic dynamic behaviour.
 |
 |
6 Conclusions and Discussion
We have performed an analysis of the diffusive dynamics on a scale free network with a power-law connectivity distribution but without any other form of structural inhomogeneity. Using the transport of information packets, where the diffusion rules can be modified in various ways by adjusting the navigation of packets at nodes, we were able to show that several dynamical effects appear to be related to the the microscopic diffusion rules. Our approach indicates that these findings will be relevant to more realistic transport problems on networks, which are very different from simple random-walks.
In particular, we pinpointed the importance of not just topological but also dynamic preference to the occurrence of dynamic scaling. We implemented navigation rules that involve preferences between links, which is possible on topologically inhomogeneous scale-free networks. The edge-preferential navigation rules appear to dynamically homogenize the network (at large connectivity nodes) and yield new dynamical phenomena. We focused on two types of scaling behaviour that can be obtained from the point of view of individual structural elements, nodes and edges of the network, and are potentially related to each other: Scaling of noise and flow fluctuations, on one hand, and scaling of return-time distributions, on the other. While the noise fluctuations and/or return times at nodes have been studied extensively on different types of networks [8, 9, 10, 1], our work presents the first systematic study of the fluctuations of flow on edges and return times to edges, and a comparison with the quantities obtained at nodes within the same dynamics. Owing to the different roles that nodes and edges play in these diffusion processes on an inhomogeneous network, these comparative studies lead to the conclusion that certain types of preferential behaviour in either nodes or edges is necessary for the occurrence of scaling. The scaling is characterized by the exponents and and the parameter .
In particular, no scaling behavior was found in the fluctuations of flow and in the return times to edges for random diffusion. On the other hand, when edge-preferred navigation is turned on, both a non-trivial scaling of the flow fluctuations and a power-law tail in the return-times to edges is observed. The differences in node connectivities, studied in regular, random graph, and the scale-free structures, leads to differences in the noise fluctuations both in random diffusion and in CD navigated diffusion. Accordingly, we find non-trivial distributions of the return times to nodes, that are power-law (up to a finite-size cut-off), in agreement with theoretical predictions [27, 19]. The exponents, however, depend on the navigation rules. Only in the case of random diffusion do the return times scale with a power which is determined by the network’s connectivity distribution.
Furthermore, we show that the scaling properties of noise fluctuations are non-universal, with both the topological inhomogeneity but also details of the dynamics playing a role in the emergent scaling behaviour. In addition to a well pronounced dependence on the width of the time window, that was also observed in other studies [9, 10, 1, 11], we found that navigation rules effect the universality of noise fluctuations. Again, we found a qualitative difference between the scaling properties at nodes and at edges. A unique scaling exponent is always found in case of noise fluctuations at nodes, whereas in our navigated diffusion the flow fluctuations at edges are bi-universal.
Finally, we have demonstrated that by looking beyond the random walk dynamics on sparse topologies, one may find a number of new dynamical phenomena, that are both interesting from the point of theory, but also practically important for many real transport processes on networks.
Acknowledgments: We acknowledge support from Programme P1-0044 of the Ministry of Higher Education, Science and Technology of the Republic of Slovenia, the British Council Partnerships in Science Project 22/2006 and the EC Marie Curie Early Stage Training Programme NET-ACE (MEST-CT-2004-6724).
References
- [1] B. Tadić, G. J. Rodgers, and S. Thurner. Transport on Networks: Flow, Jamming and Optimization. Int. J. Bifurcation and Chaos, 17:No. 7, 2007.
- [2] B. Tadić and S. Thurner. Information super-diffusion on structured networks. Physica A, 332:566–584, 2004.
- [3] B. Tadić, S. Thurner, and G. J. Rodgers. Traffic on complex networks: Towards understanding global statistical properties from microscopic density fluctuations. Phys. Rev. E, 69:036102, 2004.
- [4] R. Guimerà, A. Arenas, A. Díaz-Guilera, and F. Giralt. Dynamical properties of model communication networks. Phys. Rev. E, 66:026704, 2002.
- [5] R. Guimerà, A. Díaz-Guilera, F. Vega-Redondo, A. Cabrales, and A. Arenas. Optimal network topologies for local search with congestion. Phys. Rev. Lett., 89:248701, 2002.
- [6] R. V. Sole and S. Valverde. Information transfer and phase transitions in a model of internet traffic. Physica A, 289:595–605, 2001.
- [7] M. Šuvakov and B. Tadić. Transport on homogeneous planar graphs with scale-free loops. Physica A, 372:354–361, 2006.
- [8] M. Argollo de Menezes and A.-L. Barabási. Fluctuations in Network Dynamics. Phys. Rev. Lett., 92:028701, 2004.
- [9] J. Duch and A. Arenas. On the universality of the scaling of fluctuations in traffic on complex networks. Phys. Rev. Lett., 96:218702, 2006.
- [10] B. Tadić. Structure of Flow and Noise on Functional Scale-Free Networks. Prog. Theor. Phys., Suppl., 162:112–120, 2006.
- [11] Z. Eisler and J. Kertesz. Scaling theory of temporal correlations and size dependent fluctuations in the traded value of stocks. Phys. Rev. E, 73:046109, 2006.
- [12] J. Živković, B. Tadić, N. Wick, and S. Thurner. Statistical Indicators of Collective Behavior and Functional Clusters in Gene Expression Networks of Yeast. Europ. Physical Journal B, 50:255–258, 2006.
- [13] B. Tadić and G.J. Rodgers. Packet Transport on Scale-Free Networks. Advances in Complex Systems, 5:445–456, 2002.
- [14] R. Albert and A.-L. Barabasi. Statistical Mechanics of Complex Networks. Review of Modern Physics, 74:47–111, 2002.
- [15] S.N. Dorogovtsev and J.F. Mendes. Evolution of Networks: From Biology to the Internet and WWW. Oxford University Press, 2003.
- [16] B. Tadić and S. Thurner. Search and topology aspects in transport on scale-free networks. Physica A, 346:183–190, 2005.
- [17] B. Tadić. Adaptive random walks on the class of Web graphs. European Physical Journal B, 23:221–228, 2001.
- [18] B. Kujawski, B. Tadić, and G.J. Rodgers. Local information- based algorithms for packet transport in complex networks. In V.N. Alexnandrov et al., editor, ICCS 2006, volume 3993 of Lecture Notes in Computer Science, pages 1024–1031, Berlin, 2006. Springer.
- [19] J. D. Noh and H. Rieger. Random Walks on Complex Networks. Phys. Rev. Lett., 92:118701, 2004.
- [20] A. Corral. Long-term clustering, scaling, and universality in the temporal occurrence of earthquakes. Phys. Rev. Lett., 92:108501, 2004.
- [21] A. Corral. Mixing of rescaled data and Bayesian inference for earthquake recurrence times. Nonlinear Processes in Geophysics, 12:89–100, 2005.
- [22] A. Corral. Universal Earthquake-Occurrence Jumps, Correlations with Time, and Anomalous Diffusion. Phys. Rev. Lett., 97:17850, 2006.
- [23] M. Boguna and A. Corral. Long-Tailed Trapping Times and Levy Flights in a Self-Organized Critical Granular System. Phys. Rev. Lett., 78:4950–4953, 1997.
- [24] R. Sánchez, D. E. Newman, and B. A. Carreras. Waiting-Time Statistics of Self-Organized-Criticality Systems. Phys. Rev. Lett., 88:068302, 2002.
- [25] L. Sabatelli, S. Keating, J. Dudley, and P. Richmond. Waiting time distributions in financial markets. European Physical Journal B, 27:273–275, 2002.
- [26] J. W. Lee, K. E.Lee, and P. A. Rikvold. Waiting-time distribution for a stock-market index. Journal of Korean Physical Society, 48:123–126, 2006.
- [27] A.J. Bray and G.J. Rodgers. Diffusion in a sparsely connected space: A model for glassy relaxation. Phys. Rev. B, 38:11461–11470, 1988.
- [28] C. Tsallis. Possible generalization of Boltzmann-Gibbs statistics. J. Stat. Phys., 52:479–487, 1988.