Formation of optimal-order necklace modes in one-dimensional random photonic superlattices
Abstract
We study the appearance of resonantly coupled optical modes, optical necklaces, in Anderson localized one-dimensional random superlattices through numerical calculations of the accumulated phase. The evolution of the optimal necklace order shows a gradual shift towards higher orders with increasing the sample size. We derive an empirical formula that predicts and discuss the situation when in a sample length the number of degenerate in energy resonances exceeds the optimal one. We show how the extra resonances are pushed out to the miniband edges of the necklace, thus reducing the order of the latter by multiples of two.
Wave interference phenomena play a crucial role in transport properties of various physical systems from periodic soukoulis to disordered Sheng ; tigg . Among these, originally studied for electronic systems, Anderson localization seems the more intriguing one Anderson . It predicts a phase transition form metallic-like conductivity to an insulating regime, when the transport can come to halt with increasing the randomness. On the other hand, in a one-dimensional (1D) disordered system, such a transition happens when the sample size extends beyond the so-called localization length . In such conditions, the wavefunctions become localized within an extension and decay exponentially with distance . Being essentially an interference phenomenon, Anderson localization has been studied as for electromagnetic and acoustic waves localization , as well as for degenerate atomic gases degas . Very recently, Anderson localization of optical waves in the microwave regime has been demonstrated in experiments on 1D random multilayer dielectric stacks necklace1 ; necklace2 .
Initially, it has been widely accepted that the conductivity (transmittivity) of a disordered chain is mainly supported by states which are closer situated to the sample center note1 . Later, this was questioned, since for long enough specimen, the states in the center possess significantly reduced probability to support a two-step hopping transport through these states. In late 80’s, Pendry p87 and Tartakovskii et al. tart , independently, argued that the conductivity in such systems should be dominated by so-called necklaces – few homogeneously distributed through the sample states, degenerate in energy, and coupled resonantly to delocalize and extend through the chain. The number of resonant states forming a necklace, was calculated to scale as , while the probability of their occurrence was shown to drop as , thus predicting them to be increasingly improbable events in long samples p87 . Therefore, for a certain sample length, a trade-off between the expected number and their occurrence probability would determine the optimal order of the necklace.
In this Letter we study the appearance of optical necklaces in finite 1D random superlattices through numerical calculations of the accumulated phase and follow the evolution of the optimal necklace order when increasing the sample size. We suggest an empirical formula which predicts the optimal necklace order and discuss the situation when in a sample length the number of degenerate in energy resonances exceeds . We show that the extra resonances, which are spaced by a distance less than the optimal one for a certain sample length, are coupled strongly enough to split and be pushed out to the miniband edges of the necklace, thus reducing the order of the latter by multiples of two.
We studied random binary multilayer stacks composed by layers of and -type dielectric materials (refractive indices chosen to be and ). Positionally random sequences were generated by giving equal weights to each type of layer. Two types of random multilayer stacks were investigated. In one type, the physical thicknesses and of the constituent layers were generated randomly through the sequence, thus a complete randomness was achieved. For the other type, and were chosen to be resonant at some wavelength (quarter-wave layers), therefore, the condition was considered. The quarter-wave condition makes the system not perfectly random and, in particular, maximizes the constructive interference effects at the resonant wavelength.
In general, in a 1D dielectric multilayer stack, the phase suffers a shift each time it meets a resonance. Therefore, the phase measurement is a valid tool to isolate the spectrum singularities in either periodic prbmatteo or random systems necklace2 . This way, in Ref. necklace2 , localized states and, more importantly, optical necklaces have been identified through interferometric measurements on Anderson localized 1D random superlattices. When degenerate in energy states couple weakly to form a necklace note2 , the accumulated phase increases smoothly through the transmission band built up by these latter, summing up to . On the contrary, when strong coupling occurs, the phase suffers single jumps through well defined spectrally separate peaks.
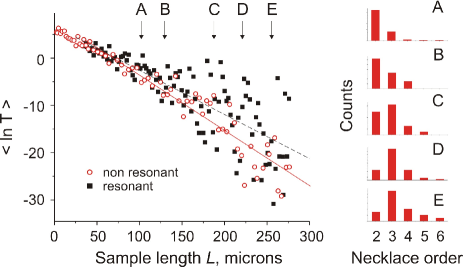
Hence, through this study, the order of the necklaces has been assigned to the multiples of in the smoothly changing phase shift through the transmittance band. Firstly, random structures, with non-resonant layer thicknesses, were studied and their transmission spectra were calculated through a standard transfer matrix method pAdv . In Fig. 1 the logarithm of the integrated transmission over a wide spectral range (m), averaged over 200 realizations per point, is plotted versus the sample thickness (open circles) note3 . We observe, firstly, that decreases as , as it is expected in the diffusive regime Sheng , where the states are still extended. Over about 30 m a smooth transition from extended to localized regime occurs and the sample transmission drops linearly with further increase in the sample thickness. The localization length of m is obtained from the slope of .
In order to study the properties of optical necklaces, one has to go through many realizations of disorder, because of their nature to be extremely rare events. For this, we decided to look for necklaces in binary multilayer stacks with resonant quarter-wavelength layers. We were motivated by the fact that, due to the resonant layer condition, these provide much higher probability to possess many resonances at wavelength.
As it is seen from Fig. 1, the transmission of such realized samples (full squares) shows a clear deviation from the one of fully random system. Namely, the higher-on-average transmission in this case is supported by much frequent occurrences of optical necklaces at and becomes more pronounced for thicker samples. We have verified the order of the necklaces in a small frequency window around the resonant wavelength for five different sample lengths. For this, 300 realizations per each chosen thickness have been studied and the necklaces have been identified through the calculated phase. The right panels in Fig. 1 report the counts of different order necklaces. We observe that at smaller thicknesses (panel A, m) the major number of necklaces is of second order and fewer third order ones occur. With increasing sample size, the number of second order necklaces diminishes and the third order ones firstly start to dominate at m, obtaining a maximum at m. With a further increase in sample size (panel E, m) higher orders shoulder starts to rise in the necklace counts histogram, indicating that the samples become enough thick to fit more than three degenerate resonances.
The order of the necklace, which fits optimally inside the sample length to have the highest and most compact transmission band, can be empirically calculated as
| (1) |
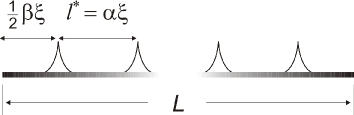
where stand for the floor-function and denote the greatest integer part of the expression inside. Here, the parameter counts the distance (in the units of ) between two neighboring resonances efficiently coupling to form a necklace, while considers the coupling of first and last resonances to the environment (see Fig. 2). In reality, the step function of Eq. 1 considers the order of the most frequent necklace from the histogram of all observed orders. In our case, a reasonable fit to the numerical results was found with and .
The power law scaling of the order of necklaces in disordered systems and the very low probability of the higher orders occurrence predicts a trade-off scenario, which should reduce the number of actually observed ones p87 . In the following, we address this issue to understand how this reduction happens and reveal interesting physical picture of the phenomenon.
Let us consider the case of an optimal th order necklace stretching through sample length . The most compact and, in the meanwhile, high-transmission band formed by this should occur when resonances, degenerate in energy, are distributed homogeneously through the sample to favor similar coupling between neighboring states. This situation is an ideal one and is very improbable for higher order necklaces. Since the resonances occur randomly in the depth of the sample, it becomes more probable that some of them will appear at a distance closer than the optimal separation between two neighboring cavities. When this happens, the spatially close resonances couple strongly and a larger mode repulsion pushes them farther from the miniband center.
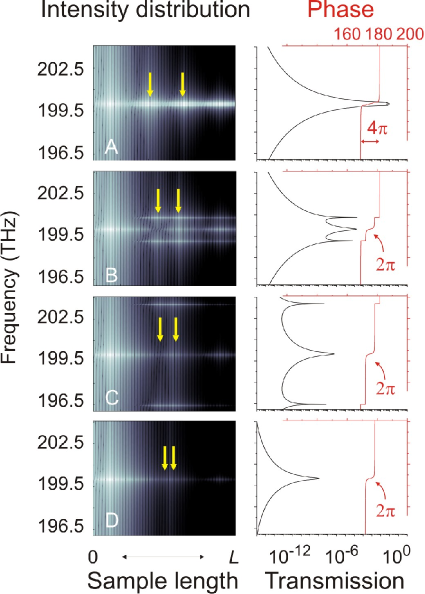
We examine the dynamics of such a situation on an example of a periodic photonic structure, where for simplicity four resonant cavities are coupled through Bragg sequences in such a way that a high transmission band of an artificially built necklace is formed. The choice of a periodic structure allows us to manipulate the spatial positions of various cavities, which is an impossible task for random systems. Figure 3 shows the light intensity distribution through the photonic structure (left panels) and the corresponding transmission spectrum together with the phase (right panels). In Fig. 3A the ideal situation is presented, when the resonances are distributed homogeneously through the sample. A high transmission miniband is formed (left panel, black line) through which the phase (red) suffers a smooth increase by .
Next, we move spatially the two central cavities closer to each other. The intensity distribution plot in Fig. 3B shows the effect of stronger coupling between these two resonances: two well defined resonances (symmetric and anti-symmetric modes) rise out of the miniband core due to the mode repulsion and the channel intensity decreases. The transmission of the miniband peak drops by four orders of magnitude, and the smooth change in the phase now sums up to . If we move these cavities closer (Fig. 3C,D), the peak transmission drops down to . Note that when excluding the two central cavities (while maintaining the same sample length) the transmission drops further down by almost three orders of magnitude to have a peak transmission of .
The intensity map in Fig. 3D contains an interesting feature, to which we would like to draw a special attention. We observe three maxima instead of two through the original transmission miniband, while the phase counts always a jump. We stress, that the central intensity maximum is not due to a resonance present at , but is built by the overlap integral of the transmission lines of the symmetric and anti-symmetric states. Therefore, it is correct to consider the necklace at to be of second rather than of third order one.
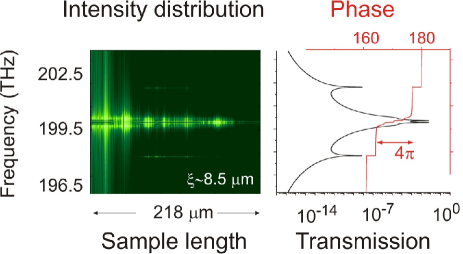
In order to catch such a situation in a random system, we have performed a number of realizations of a layer sample (m-thick). In Fig. 4 we show such an event. In the right panel six well-resolved intensity maxima are observed, while the smooth change of the phase sums up to . The intensity distribution map, and, therefore, the electric field profile at the miniband center frequency shows many bright and other less intense clumps, but the real number of resonances, directly involved in the light transport through the miniband is less and can be exactly counted through the phase variation.
Thus, when the number of randomly built degenerate cavities exceeds the optimal order of the necklace for a certain sample length, the extra cavities couple strongly to be pushed out to the edges of the miniband, reducing the order of the necklace state and its peak transmission. We stress that this reduction is always a multiple of two, independently on the fact whether even or odd number of extra cavities are coupled strongly. This is because a strong coupling of even or odd number of cavities results in a dip or a peak in the spectral line at the resonant wavelength. Therefore, at , only multiples of are filtered out from the phase jump. Nevertheless, the extra cavities play an important role in the formation of necklaces, since their non-zero overlap reduces the reflectivity of inter-cavity regions and contributes positively to link the resonant tunneling transport through the necklace miniband.
Along this, in a fully random system, another interesting situation can happen. Suppose, that next to a necklace band centered at (call ), for simplicity, two other degenerate states, resonant at some wavelength (or ), are formed. If these are coupled strongly enough, it can happen that a fortuitous mode splitting will push either the symmetric or the antisymmetric mode to fit into the band width of . In the case, when the original necklace at is week, the new state can positively contribute to enhance the necklace transmission, thus increasing the order of by one. This is to say that the phase shift will count only one more resonance, but still the intensity map will show extra nods, since the new resonance will appear with a double clump. We note, that in a random sample with resonant layers, such a situation cannot occur: the transmission spectrum in this case is always symmetric against , therefore, the described contribution to the necklace will occur from both sides () and consequently will result in a back repulsion of degenerate modes out of the necklace band.
To conclude, we address through this study some peculiarities of the formation of optical necklaces, resonantly coupled degenerate modes, in one-dimensional random multilayer systems. We stress the importance of using the phase-jump method to reveal the exact order of necklaces, in contrast to counting intensity or electric field clumps through the necklace. We show how the extra resonances are filtered out from the necklace when in a sample length the number of degenerate in energy resonances exceeds the optimal one.
We acknowledge helpful discussions with Lorenzo Pavesi, Diederik Wiersma, Georg Pucker and Pierluigi Bellutti.
References
- (1) Photonic Crystals and Light Localization in the 21st Century edited by C.M. Soukoulis (Kluwer, Dordrecht, 2001).
- (2) See, e.g., Ping Sheng, Introduction to Wave Scattering, Localization, and Mesoscopic Phenomena (Academic Press, New York, 1995).
- (3) Wave Scattering in Complex Media: From Theory to Applications, edited by B. A. van Tiggelen and S. E. Skipetrov (Kluwer, Dordrecht, 2003).
- (4) P.W. Anderson, Phys. Rev. 109, 1492 (1958).
- (5) S. John, Phys. Rev. Lett. 53, 2169 (1984); P.W. Anderson, Philos. Mag. B 52, 505 (1985); K. Arya, Z. B. Su, and J. L. Birman, Phys. Rev. Lett. 57, 2725 (1986); A. Lagendijk, M. P. v. Albada, and M. P. v.d. Mark, Physica (Amsterdam) 140A, 183 (1986).
- (6) H. Gimperlein, S. Wessel, J. Schmiedmayer, and L. Santos, Phys. Rev. Lett. 95, 170401 (2005); C. Fort et al., ibid. 95, 170410 (2005).
- (7) J. Bertolotti, S. Gottardo, D. S.Wiersma, M. Ghulinyan, and L. Pavesi, Phys. Rev. Lett. 94, 113903 (2005).
- (8) J. Bertolotti, M. Galli, R. Sapienza, M. Ghulinyan, S. Gottardo, L.C. Andreani, L. Pavesi, D.S. Wiersma, Phys. Rev. E 74, 035602 (R) (2006).
- (9) This was motivated by the fact that the probability for a particle to be transmitted by hopping in and out of the sample is the highest for the states originating in the chain center.
- (10) J. B. Pendry, J. Phys. C 20, 733 (1987).
- (11) A. V. Tartakovskii et al., Sov. Phys. Semicond. 21, 370 (1987).
- (12) M. Galli, D. Bajoni, F. Marabelli, L.C. Andreani, L. Pavesi, and G. Pucker, Phys. Rev. B 69, 115107 (2004); M. Ghulinyan, M. Galli, C. Toninelli , J. Bertolotti , S. Gottardo , F. Marabelli , D.S. Wiersma, L. Pavesi , L. Andreani, Appl. Phys. Lett. 88, 241103 (2006).
- (13) We refer to a necklace, when the coupling between constituent states is weak enough to result in a mode repulsion, smaller than the full width at half maximum of individual modes.
- (14) J. B. Pendry, Adv. Phys. 43, 461 (1994).
- (15) As discussed in Ref. necklace1 , assuming ergodicity, one can consider the wavelength average of the transmission spectrum, to avoid ensemble averages, since for the latter many realizations are required.