Dispersion anomalies induced by the low-energy plasmon in the cuprates
Abstract
We discuss the characteristic effects of the electron plasmon interaction resulting from the 1 eV plasmon, which is a universal feature in the cuprates. Using the framework of a one-band tight binding model, we identify signatures of this low energy plasmon in the electronic structure of metallic overdoped Bi2212 as well as half-filled insulating SCOC. The electron-plasmon interaction is found to yield renormalizations near the Fermi energy in reasonable accord with experimental observations, and to produce dispersion anomalies at higher energies.
pacs:
79.60.-i, 71.38.Cn, 74.72.-h, 71.45.GmQuasiparticle dispersions near the Fermi energy in the cuprates are renormalized (reduced) by a factor of Arun3 in comparison to the band theory predictions based on the conventional LDA picture, interrupted by the appearance of low energy ‘kinks’ or dispersion anomalies in the 50-70 meV energy range, which arise from the coupling of the electronic system with phononspkink and/or magnetic modesmkink . Interestingly, the ‘spaghetti’ of various hybridized and unhybridized Cu and O bands starting around 1 eV in the cuprates seems to remain more or less unrenormalized.Ale1 Recalling that opticalBoz and electron energy loss spectroscopy (EELS) experimentsHedLee ; WZD have shown the presence of dispersive plasmons in the cuprates lying at 1 eV, we explore the effects of such a low energy plasmon in this Letter. The plasmon is found to induce renormalizations in the low energy regime in both the metallic and the insulating cuprates, which are in substantial accord with the corresponding experimental results. We emphasize that plasmons in 3D materials typically lie at 10 eV and therefore have little influence on the electronic states in the 0-1 eV range.
We approach the problem within the framework of a one-band tight-binding model and consider the limiting cases of a metal with the example of overdoped Bi2Sr2CaCu2O8 (Bi2212)Ale ; Non and the insulator with the example of half-filled Sr2CuO2Cl2 (SCOC)RonK . The dielectric functions computed via the random phase approximation (RPA) yield loss functions and the associated plasmon dispersions in both Bi2212 and SCOC, which are in reasonable accord with the corresponding EELS data. The generic effects of the electron-plasmon interaction on the electronic structure and how the low energy plasmon in the metal and the insulator induces characteristic dispersion anomalies and renormalizations of the spectrum are then delineated via a first order calculation of the electronic self energy.
We discuss first the metallic case of overdoped Bi2212. Here the magnetic gap has collapsed fully and we take the bare electronic dispersion to be given by a one-band tight-binding model fitted to the LDA-based band structure of Bi2212 in the vicinity of the Fermi energy () as followsArun3 :
| (1) |
where for or , is an integer, and is the in-plane lattice constant. Hopping parameters appropriate for Bi2212 (neglecting bilayer splitting)Arun3 are: =360 meV, meV, =35 meV, . We model the dynamic dielectric function, , in the formHedLee ; static
| (2) |
where and the dispersion and damping of the plasmon in Bi2212 obtained from EELS data are given byHedLee : , , . Notably, due to the large broadening, the experimental plasmon peak lies at a lower energy than the bare value . Using the bare dispersion of Eq. 1 and the dielectric function of Eq. 2, it is straightforwardMah to obtain the first order correction to the electronic self energy due to the screened Coulomb interactionFootnote . The formulas can also be derived from those for the insulator (Eqs. 5-11 below) by letting the magnetic gap .
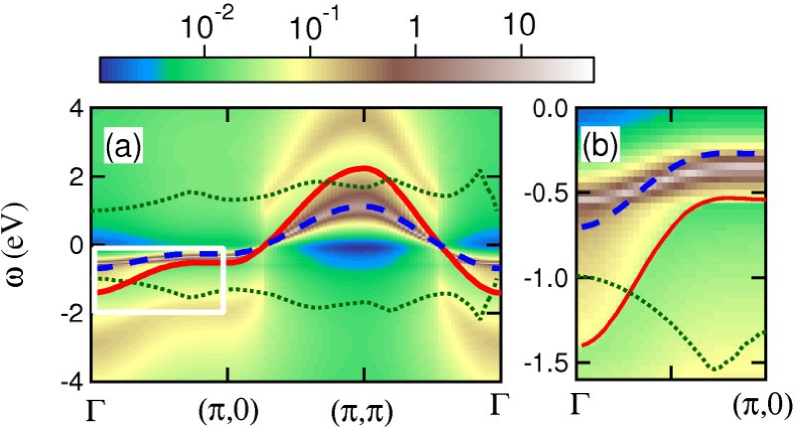
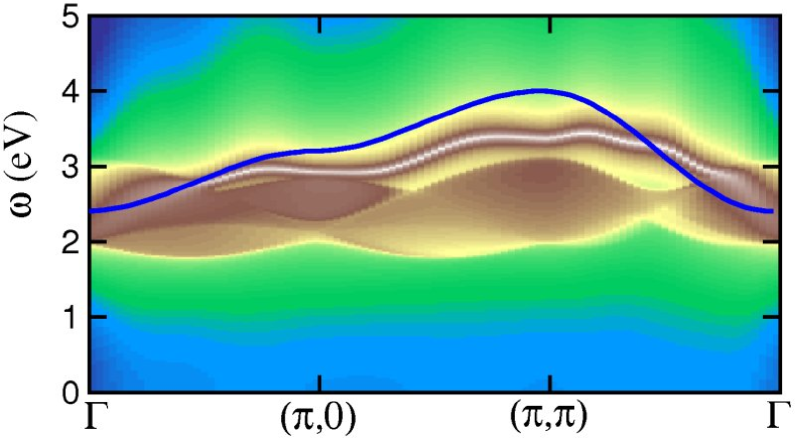
Figure 1 displays the spectral density in the overdoped metallic case where effects of the electron-plasmon interaction are included. We consider the low energy region along shown in (b) first. A region of high spectral intensity depicted by the thin white trace in (b) can be seen clearly (note logarithmic scale), indicating that the LDA band continues to persist in the presence of the plasmon, albeit with some renormalization. An average factor of is seen to more or less describe the renormalization of the LDA band as seen by comparing the dashed blue line with the whitish trace of high intensity. The value so determined is in substantial accord with the corresponding experimental value of ,Arun3 indicating that the plasmon constitutes a substantial part of the bosonic dressing of the electron. Moreover, the spectral weight spreads out from the renormalized band towards the bare band (red line), giving the resulting yellowish trace the visual appearance of a ’waterfall’ terminating around the point. These results bear some resemblance to ’waterfall’-like anomalies reported recently in the ARPES spectra from the cuprates over the 0.4-0.8 eV energiesAle ; Non . However, the waterfall-like features induced by the plasmon and those reported in ARPES differ significantly insofar as their location in energy and momentum is concerned, and therefore, on the face of it, the plasmon would not seem to provide an explanation of the recent ARPES results. We return to comment further on this point below.
We now turn to Fig. 1(a) which exposes effects of the plasmon over a wider energy scale. Here we see that the plasmon induces ’plasmaron’ featuresHedLund – a new ’shadow’ band lying 1.5 eV below the bare dispersion via the plasmon emission process along the filled portion of the LDA bands along the to and the to lines. A similar shadow band associated with plasmon absorption appears 1.5 eV above the unfilled part of the LDA band along the to and to lines. At low energies, the plasmon dresses the electrons, making them heavier and renormalizing their dispersion. In contrast, at high energies, the plasmon becomes progressively less effective in dressing the electrons which move with ever increasing speeds, even though the electronic states are still broadened by plasmon emission effects.
We now demonstrate that the experimentally observed plasmon dispersion in Bi2212 is in fact described reasonably well by the band structure of Eq. 1, consistent with the results of Ref. SharK . For this purpose, we directly evaluate the dielectric function from the bare charge susceptibility and the Coulomb interaction via
| (3) |
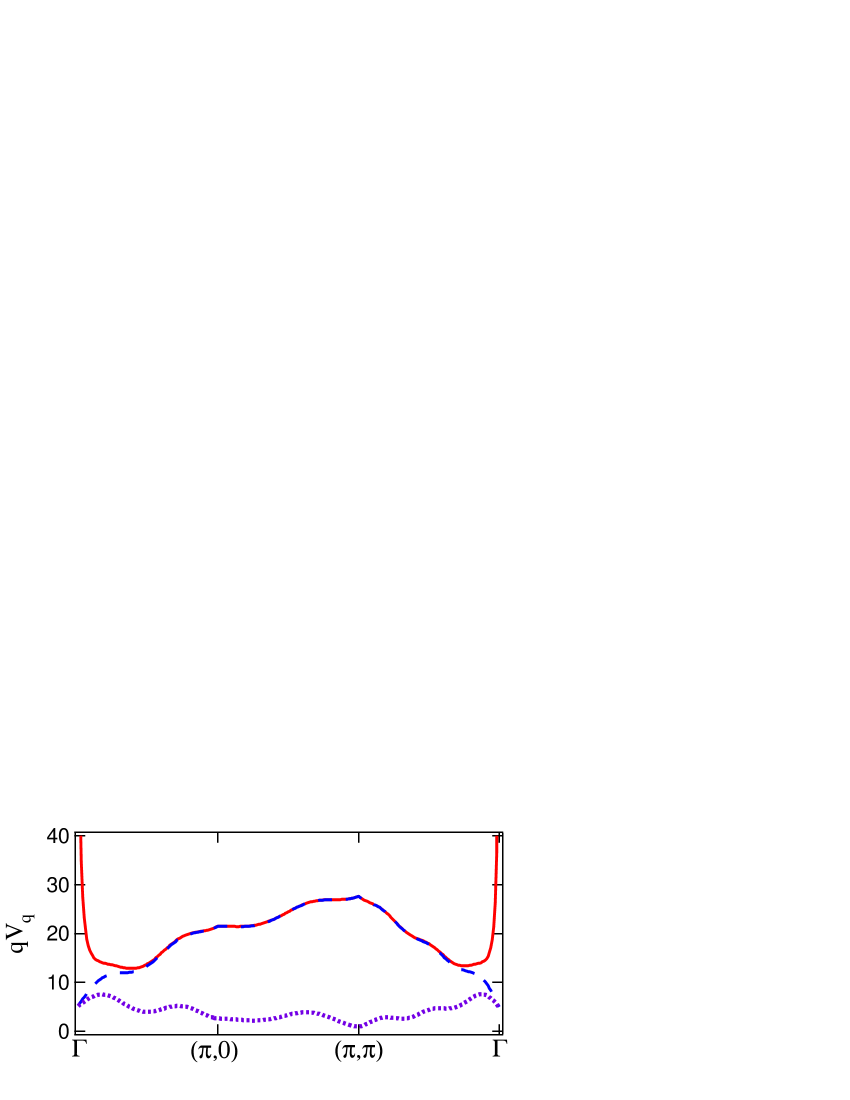
is calculated straightforwardly within the RPA approximation where the band structure of Eq. 1 is renormalized by a factor of Z=0.28 to account for the renormalization observed in ARPES experiments on Bi2212. The treatment of the long-range Coulomb interaction for the correlated electronic system in a layered structure requires some care and we model as an on-site Hubbard 2 eV termfoot0 plus a contribution screened by the background dielectric constant at other lattice sites. is then obtained via a lattice Fourier transform by summing the contributions of all in-plane Cu terms for ( being the in-plane lattice constant) and approximating the remaining in-plane as well as interplane contributions for by a continuum in order to recover the correct limit of . Fig. 2 shows along high symmetry lines in the Brillouin zone (BZ). is seen to display a crossover from 3D behavior to 2D behavior for , where is the distance between successive CuO2 planes.
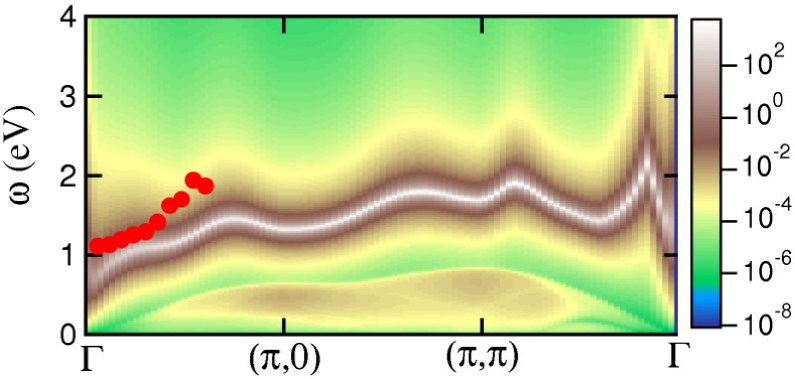
The use of and in Eq. 3 yields the dielectric function based directly on the band structure of Eq. 1. The plasmon dispersion is found from the peak of the EELS spectrum, which is proportional to the loss function Im , plotted in Fig. 3. The theoretically predicted plasmon energy given by the maximum of the loss function (white trace in the figure) is compared to the available experimental results in Bi2212 (red dots). Given that the calculation is not self-consistent, the agreement is seen to be reasonable. Notably, our calculations assume purely in-plane excitations ().foot6
We consider next the more challenging case of insulating SCOC, where a magnetic gap is present and it has not been clear how the EELS spectraWZD are related to the plasmon excitation. As in the metallic case, the starting point is the dispersion of Eq. 1, except that the hopping parameters are chosen to fit the LDA-based bands in SCOC: =420 meV, meV, =52 meV, meV. The correlated band structure is modeled by introducing an on-site Hubbard term =2 eV and treating the system as a uniform half-filled antiferromagnetfoot7 with saturated (staggered) moment . The band structure of Eq. 1 then splits into upper and lower magnetic bands with gap . The dielectric response given by Eq. 2 in the metallic case is modified strongly at low frequencies and our analysis indicates that the dielectric function in the insulator can be modeled as
| (4) |
where .foot3 Taking =2 eV and the same as in Eq. 2, the EELS dataWZD on SCOC can be fitted to Eq. 4 with . Again, the broadening shifts the peak in Im from its expected position ; the experimental peak can be fit to a similar -dependence, but with . Note that is not very different in metallic Bi2212 and insulating SCOC, so that most of the shift in the position of the plasmon peak in the loss function is due to the gap .
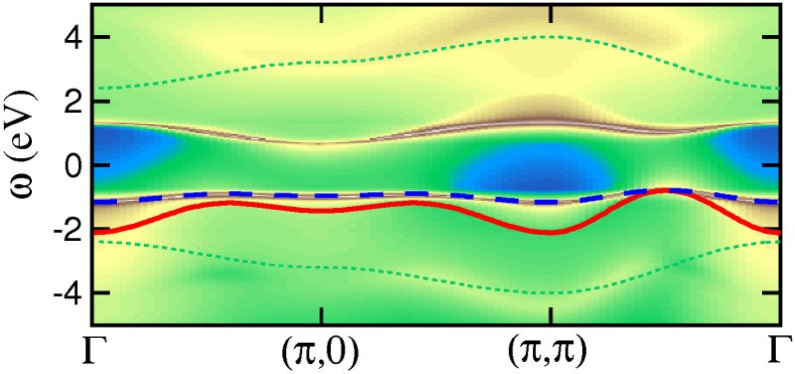
The spectral density for the dressed Green function in the insulator is shown in Fig. 4. The results are similar to those of Fig. 1 for Bi2212 in that the dressed lower magnetic band in Fig. 4 displays the waterfall effect and that it is renormalized in comparison to the bare band (compare red line with dashed blue line). The renormalization of the low energy spectrum by a factor of in SCOC due to the plasmon in Fig. 4 is again comparable to the corresponding experimental value of = 0.64.
Finally, we consider briefly the calculation of the loss function and the self-energy in the insulating system. With two bands involved in this case, the formalism is less familiar than the one-band metallic case, and therefore, an overview of the relvant results is appropriate. [The metallic case can be recovered by taking the limit .] The RPA expression for the charge susceptibility in the insulator is
| (5) |
where the prime means summation over the magnetic Brillouin zone only,
| (6) |
is the Fermi function,
| (7) |
with the 1(2) going with the -(+) sign, ,
| (8) |
and . The preceding equations have been applied previously to the Hubbard modelChuF ; Kamp , but we have extended their usage to include the long-range Coulomb interaction.
In the presence of a gap, the electronic self energy becomes a tensor with indices 1(2) corresponding to the lower (upper)magnetic bandVH ; Mah :
| (9) |
| (10) |
where
| (11) |
and has the same form as , but with and interchanged.
The loss function in SCOC computed from Eqs. 5 and 3 is shown in Fig. 5. The experimentally observed plasmon dispersion (solid line) is seen to be in good accord with the theoretical prediction. A comparison of Figs. 3 and 5 reveals how the gap in the underlying spectrum of the insulator shifts the plasmon energy in SCOC to higher values with little weight at energies below 2 eV in contrast to the metallic case of Bi2212.
The present results have significant implications for the low energy physics of the cuprates and provide a route for connecting this physics to the spectrum at higher energy scales as one encounters the venerable ‘spaghetti’ of Cu and O related bands spread typically over 1-8 eV binding energies. We have shown that the plasmon induces band renormalizations at low energies in the metallic case of Bi2212 as well as the insulating case of SCOC, and that these renormalization effects are in substantial accord with the corresponding experimental values. Our results clearly establish the importance of the plasmon in the bosonic dressings of the low energy quasiparticles in the cuprates.
There have been several recent calculations of electronically-induced kinks, but these are generally very weakSrVO3 or confined to a restricted doping rangeKFul . The plasmon by contrast is robust and produces strong kink-like features which extend over several eVs, due to the large broadening of the plasmonfoot5 . While these characteristic features of the electron-plasmon interaction are reminiscent of those reported in very recent ARPES experiments on several families of cupratesRonK ; Ale ; Non , they fall at too high an energy scale. Possible candidates for the intermediate waterfall scale include the acoustic branch of the plasmons and high-energy magnetic excitations. The extent to which low energy plasmons are involved in an electronic mechanism of superconductivity remains unclear, although such suggestions have been made in the literatureacplas .
In conclusion, we have shown that the low-energy plasmon, which is a universal feature of the cuprates, produces renormalizations and dispersion anomalies in the electronic structure. Our study indicates that the plasmon is a very significant player for understanding the physics of the cuprates.
Acknowledgments: We thank B. Barbiellini for important discussions. This work is supported by the US DOE contract DE-AC03-76SF00098 and benefited from the allocation of supercomputer time at NERSC and Northeastern University’s Advanced Scientific Computation Center (ASCC).
References
- (1) R.S. Markiewicz et al., Phys. Rev. B72, 054519 (2005).
- (2) A. Lanzara et al., Nature (London) 412, 510 (2001); X.J. Zhou, et al., Phys. Rev. Lett. 95, 117001 (2005).
- (3) A. Kaminski et al., Phys. Rev. Lett. 86, 1070 (2001); P.D. Johnson et al., Phys. Rev. Lett. 87, 177007 (2001); S.V. Borisenko et al., Phys. Rev. Lett. 90, 207001 (2003); A.D. Gromko et al., Phys. Rev. B68, 174520 (2003).
- (4) K. McElroy et al., Bull. A.P.S. 51, 141 (2006).
- (5) I. Bozovic, Phys. Rev. B42, 1969 (1990).
- (6) N. Nücker et al., Phys. Rev. B39, 12379 (1989); M.R. Norman et al., Phys. Rev. B59, 11191 (1999); L. Hedin and J.D. Lee, Phys. Rev. B64, 115109 (2001).
- (7) Y.Y. Wang et al., Phys. Rev. Lett. 77, 1809 (1996).
- (8) J. Graf et al., cond-mat/0607319, Phys. Rev. Lett. (to be published).
- (9) W. Meevasana et al., cond-mat/0612541.
- (10) F. Ronning et al., Phys. Rev. B71, 094518 (2005).
- (11) The static , calculated in RPA, screens the exchange potential, leading to a real, nearly -independent self-energy which is presumably already incorporated in the LDA calculation.
- (12) J.D. Mahan, “Many-Particle Physics” (2d Ed.) (Plenum, New York, 1990). The present Eq. 11 describes only the component ; a second, smaller component, (Eq. 5.1.25 of Mahan) has also been included in the numerical calculations.
- (13) This is similar to the GW approximation scheme. Going beyond the simplest GW toward full self-consistency is complicated by the need to include vertex corrections. See F. Aryasetiawan and O. Gunnarsson, Rep. Prog. Phys. 61, 237 (1998) for a review.
- (14) L. Hedin and S. Lundqvist, in Solid State Physics, Vol. 23, ed. by F. Seitz, D. Turnbull, and H. Ehrenreich, (Academic, N.Y., 1969), p. 1.
- (15) A.C. Sharma and I. Kulshrestha, Phys. Rev. B46, 6472 (1992).
- (16) In the overdoped metal, possible renormalization of is neglected in the charge response, and it is assumed that there is no magnetic order.
- (17) The role of acoustic plasmons is thus underestimated. Our preliminary calculations suggest that this is not a serious limitation, but this point bears further attention.
- (18) While applicability of the RPA to hole doped cuprates remains a matter of debate, we note that is considerably below the criterion for a Brinkman-Rice instability [W.F. Brinkman and T.M. Rice, Phys. Rev. B2, 4302 (1970)].
- (19) The value of is estimated from the limit of the calculated . For simplicity, the -dependence of is neglected.
- (20) A.V. Chubukov and D.M. Frenkel, Phys. Rev. B46, 11884 (1992).
- (21) A.P. Kampf, Phys. Rev. B53, 747 (1996).
- (22) G. Vignale and M.R. Hedayati, Phys. Rev. B42, 786 (1990).
- (23) I.A. Nekrasov et al., Phys. Rev. B73, 155112 (2006).
- (24) Y. Kakehashi and P. Fulde, J. Phys. Soc. Japan 74, 2397 (2005).
- (25) The broadening is associated with the plasmon entering into the particle-hole continuum, and can be reproduced by adding a small to the bare Green’s function.
- (26) J. Ruvalds, Phys. Rev. B35, 8869 (1987); V.Z. Kresin and H. Morawitz, Phys. Rev. B37, 7854 (1988).