Parametric polariton amplification in semiconductor microcavities
Abstract
We present novel experimental results demonstrating the coherence properties of the nonlinear emission from semiconductor microcavities in the strong coupling regime, recently interpreted by parametric polariton four-wave mixing. We use a geometry corresponding to degenerate four-wave mixing. In addition to the predicted threshold dependence of the emission on the pump power and spectral blue shift, we observe a phase dependence of the amplification which is a signature of a coherent polariton wave mixing process.
pacs:
71.35.Gg, 71.36.+c, 42.70.Nq, 42.50.-pIn high finesse semiconductor microcavities with embedded quantum wellscargese , the photon and exciton confinement and the large excitonic oscillator strength make it possible to reach the strong coupling regime or normal mode coupling. As a result, the degeneracy at resonance between the exciton mode and the photon mode is lifted and the so-called vacuum Rabi splitting takes placeweisbuch . The resulting two-dimensional eigenstates, called cavity polaritons, are mixed photon-exciton states that have a number of attractive features. They are considered as potential candidates for Bose-Einstein condensation because of the occurrence of strong polariton-polariton scattering into the small states. The purpose of this paper is to report on novel properties of cavity polaritons in the nonlinear regime, that are a direct proof of the coherent nature of the polariton-polariton interaction.
The emission intensity of these systems has been shown to undergo a giant amplification when the intensity of the driving field is increased above some threshold, both under non resonantcao ; lesidang ; bloch and resonant laser excitationsavvidis ; huang ; houdre ; stevenson . Several mechanisms were proposed to explain this behavior, including stimulated exciton phonon scattering and stimulated exciton exciton scattering, raising a lot of controversyimmamoglu ; tassone ; kira . In particular, experiments using a resonant pump at a specific angle and measuring the amplified emission or the gain on a probe laser at normal incidence savvidis ; houdre ; stevenson , are in good agreement with a recent theoretical model based upon coherent polariton four-wave mixing ciuti . A strong amplification is observed when the angle is chosen in order to ensure energy and in-plane momentum conservation for the process where two pump polaritons (with momentum ) are converted into a signal polariton () and an idler polariton ().
The experiments involving resonant excitation have been performed in a non-degenerate configuration, in which the signal, idler and pump beams have different energies and momenta. An alternative configuration ensures the double energy and momentum resonance : it is the one where , with the energy of the pump laser being resonant with the polariton energy. In this paper, we present experimental results obtained in this configuration. The amplified emission, which now contains both signal and idler, is observed in the direction of the reflected pump beam. The “degenerate” configuration allows us to highlight new features of the polariton parametric interaction. To analyze the characteristics of the emission in detail, a highly sensitive homodyne detection is used. As in the non-degenerate case, a marked threshold is observed when the pump intensity is increased and the associated shift is found to be in agreement with ref. ciuti . Degenerate four-wave mixing has been studied by several authors kuwata ; quochi in semiconductor microcavities, however in different regimes where the giant amplification on the lower polariton branch did not occur.
Moreover, it is well known that in this geometry optical parametric amplification is phase sensitiveyariv . Using a single mode cw laser as a pump, we have been able to investigate for the first time the phase dependence of the giant emission. If it was due to stimulation by the lower polariton occupation numberstevenson , a phase insensitive amplification would be observed, as in a laser-like amplifieroptamp . We have observed that the amplification depends strongly on the phase of the pump laser. This result brings in a crucial argument in favor of the interpretation of the amplified emission as originating primarily from coherent polariton four-wave mixing in the case of resonant pumping. Let us note that the case of non resonant pumpingbloch where there is no phase reference in the system corresponds to a very different problem which requires a specific approach.
We use high finesse GaAs/AlAs microcavity samples containing either one or two InGaAs quantum wells with low indium content. The samples are described respectively in refs.houdre (sample 1) and nmc (sample 2). These high quality samples exhibit very narrow polariton linewidth, on the order of 100-200 eV (half-width at half-maximum) at 4 K. The microcavities are wedged, allowing one to change the cavity thickness by moving the laser excitation spot on the samples. The beam of a single mode cw Ti:sapphire laser with a linewidth of the order of 1 MHz is focused onto the sample at normal incidence. The laser light is circularly polarized. The laser spot has a diameter of 80m.
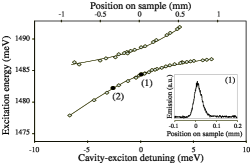
First the positions of the two polariton branches are determined by studying the reflection of the driving laser at very low intensity ( 1 mW, corresponding to 10W/cm2). For sample 2, this yields the diagram shown in Fig. 2, where the energies of the reflectivity minima have been plotted as a function of their positions on the sample. A similar diagram has been obtained for sample 1, with a smaller vacuum Rabi splitting.
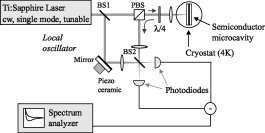
The light emitted by the microcavity is detected in the direction normal to the sample by means of a homodyne detection systemyamamoto ; yuen . For this purpose the emitted light is mixed with a local oscillator on a photodetector (Fig. 1). The emitted light of interest copropagates with the laser beam and has the same very small divergence angle (0.4∘), ensuring the conservation. An additional laser beam, the local oscillator, is mixed with the pump and signal beam on a beamsplitter. The beams coming from the beamsplitter are focused on two photodetectors. The frequency spectrum of the photocurrents is analyzed with an RF spectrum analyzer. The reflected laser and the light scattered at the laser frequency yield a large peak at zero frequency which is filtered out. The signal given by the spectrum analyzer can be shownyuen to be proportional to the beat signal between the local oscillator and the light emitted by the sample, i.e. luminescence. For an incoherent emission, the spectrum analyzer measures a broad signal, that appears on top of the background quantum noise (shot noise).
In a first set of experiments, the local oscillator is the laser beam reflected by the microcavity. The phase difference between the detected signal and the local oscillator is fixed, since the emitted light and the reflected laser follow exactly the same path. This scheme is well adapted to investigate the amplification threshold and the line shift. In a second set of experiments, we have used an independent local oscillator beam, split off from the pump laser. One of the mirrors on the path of the local oscillator is mounted on a piezoceramic, which allows us to vary its phase relative to the signal beam. This provides a tool to explore all the quadrature components for the emitted light. Let us stress that without homodyne detection the emitted light would be extremely difficult to distinguish from the scattered and reflected laser light.
We first describe the results concerning the emission threshold and the line shift, using the first experimental scheme. In order to study the emission resonances we had to use a specific method. The possible frequency scan of the detection system on each side of the laser line is of the order of a few tens of MHz, that is in the 100 neV range, much smaller than a typical photoluminescence spectrum. To investigate the emission, the frequency of the spectrum analyzer is kept fixed, while either the laser frequency or the position on the sample is scanned. Therefore, the detected polaritons have an energy extremely close to the ones excited by the pump laser. The emission lineshape obtained with the homodyne detection can be studied in the vicinity of the polariton resonance branches either by scanning the laser energy (“vertical” scan in Fig. 2) for fixed positions on the sample or by scanning the position of the laser on the sample (“horizontal” scan in Fig. 2) at fixed laser frequencies. Since it is difficult to scan a single mode laser continuously over ranges that are of the order of the polariton linewidth, we chose the second procedure. The position scan amounts to varying the detuning between the polariton and the laser at a fixed laser frequency. An example of such a signal is shown in the inset of Fig. 2 for very low laser intensity.

At very low driving intensity, the emission exhibits maxima for the same laser frequencies and positions on the sample as the reflectivity minimastanley . We have studied the height and position of the emission resonance as a function of the driving laser intensity. Figure 3 shows the maximum intensity versus the pump laser intensity for two different positions on the lower polariton branch of sample 2 (points (1) and (2) in Fig 2), corresponding to two different laser frequencies. The emission intensity exhibits a marked threshold. Below threshold the emitted intensity has linear dependence on the intensity of the driving laser, as is expected from thermal luminescence. Above threshold, the emitted intensity increases very fast with the driving intensity. The threshold takes place at very low excitation intensities. It is as low as 2 mW of incident laser power over a 80 m spot (20 W/cm2). The threshold is lowest for values of the cavity-exciton detuning close to zero. As shown in Fig. 3, it is higher for point (2) where the exciton content of the polariton is lower. All the considered pump intensities correspond to exciton densities that are below the polariton bleaching density. This was verified by checking the presence of vacuum Rabi splitting in reflectivity for these intensities. No nonlinear emission was observed on the upper polariton branch in the same range of laser powers.
We have also studied the shift of the emission curve as a function of the laser intensity. We find that the position on the sample of the maximum of the emission curve varies linearly with the intensity of the driving laser below threshold. The curves shift to the left of the unperturbed lower branch resonance in Fig. 2, which is equivalent to a blue shift in energy. The sign of the shift is consistent with a non-linearity coming from polariton-polariton scattering, which is repulsive. The measured value of the shift at threshold for point (1) in the level diagram is 0.24 meV, in good agreement with the value of about twice the polariton linewidth meV predicted by ref.ciuti . The linewidth (HWHM) was measured independently using the reflectivity resonances. These results are consistent with those of previous experiments, obtained in the non-degenerate geometry.
In the case of degenerate operation, with the signal and idler having the same energies and wavevectors, the parametric amplifier is expected to be phase-dependent. Using homodyne detection, we are able to explore this property, in contrast to other authors. As in the experiment performed in ref.houdre , thermally excited polaritons constitute the probe that seeds the parametric process and that is amplified through interaction with the pumped polaritons. Having no average phase, the former can be considered as a superposition of random polariton fields with equal mean amplitudes and phases spread over 2. For each value of the local oscillator phase, the emission having a specific phase is singled out by the homodyne detection. Scanning the local oscillator phase allows us to identify whether some quadrature components are amplified in a preferential way.
Well below threshold, as expected, all quadrature components are equivalent. Starting a little below threshold, one observes an oscillation of the homodyne signal as a function of the local oscillator phase. A typical recording is shown in Fig. 4 (inset), at zero cavity-exciton detuning for sample 1. This clearly demonstrates the phase dependence of the polariton field typical of degenerate parametric amplificationyariv . The polariton-polariton interaction that is at the origin of the observed amplification is a coherent one, which can be identified with polariton four-wave mixing. Indeed, the Hamiltonian annihilating two pump polaritons and creating two identical signal photons is of the form , with the interaction energy. Then the semi-classical evolution equation for contains a gain term proportional to , which implies a well defined phase relationship between the pump field and the amplified polariton quadrature. An amplification originating from population effects, as in a laser, would be phase independent.
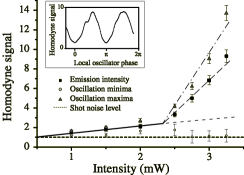
The amplitude of the oscillation grows rapidly with the pump field above threshold. In Fig. 4, we show the maxima and minima of the oscillations as a function of the driving laser power for sample 1, obtained at fixed laser frequency and by shifting the sample in order to compensate for the energy shift (the threshold is different from the one obtained with sample 2 for a similar position, but the overall behaviors are very much the same for the two samples). The level of thermal luminescence in the absence of nonlinear process, extrapolated from its value below threshold is also shown. It can be seen that the oscillation minimum goes well below the level of thermal luminescence, indicating a strong de-amplification of thermal polaritons. This effect is also a specific feature of parametric interaction. If de-amplification is efficient enough, squeezing of the emission below the shot noise level could be achieved. De-amplification down to the shot noise level, i.e. to the vacuum noise is obtained here. The quadrature component of the emitted field along the mean field of the pump laser (called emission intensity in Fig. 3 and 4), that is measured using the first experimental scheme, undergoes intermediate amplification.
In conclusion we have presented new results on parametric amplification in semiconductor microcavities. Using homodyne detection in a degenerate configuration, we have been able to show evidence for specific features of polariton four-wave mixing in the microcavity. The amplification threshold and the shift of the emission line observed in other experiments have been obtained in a configuration very different from that of other authors. We have shown for the first time the phase dependence of the amplification process in the degenerate configuration and the occurrence of de-amplification, demonstrating the coherent origin of the process. Since in such nonlinear interactions amplification and squeezing originate from the same physical effect, this opens the way to the possibility of squeezing in semiconductor microcavity devices walls ; messin . Further investigations are necessary to assess the feasible level of squeezing.
Acknowledgments. This work was performed with the support the European Commission (TMR ERMFMRX CT 96 00066) and of French DGA-DRET and CNRS (Ultimatech and Telecommunications). G. K. acknowledges support from NSF AMOP.
References
- (1) H. Benisty et al., Confined Photon Systems (Springer 1999)
- (2) C. Weisbuch et al., Phys. Rev. Lett. 69 3314 (1992); R. Houdré et al., Phys. Rev. Lett. 73 2043 (1994)
- (3) H. Cao et al., Phys. Rev. A 55 4632 (1997)
- (4) Le Si Dang et al., Phys. Rev. Lett. 81 3920 (1998); F. Boeuf et al., Phys. Rev. B 62 R2279 (2000)
- (5) P. Senellart and J. Bloch, Phys. Rev. Lett. 82 1233 (1999)
- (6) P. G. Savvidis et al., Phys. Rev. Lett. 84 1547 (2000)
- (7) R. Huang et al., Phys. Rev. B 61 R7854 (2000)
- (8) R. Houdré et al., Phys. Rev. Lett. 85 2793 (2000); the structure of sample 1 is as described in this reference, except that it has only one quantum well.
- (9) R.M. Stevenson et al., Phys. Rev. Lett. 85 3680 (2000)
- (10) A. Immamoglu and R.J. Ram, Phys. Lett. A 214 193 (1996)
- (11) F. Tassone and Y. Yamamoto, Phys. Rev. B 59 10830 (1999)
- (12) M. Kira et al., Phys. Rev. Lett. 79 5170 (1997)
- (13) C. Ciuti et al., Phys. Rev. B 62 R4825 (2000)
- (14) M. Kuwata-Gonokami et al., Phys. Rev. Lett. 79 1341 (1997)
- (15) F. Quochi et al., Phys. Rev. B 159 R15594 (1999)
- (16) A. Yariv, Quantum electronics (John Wiley, New-York, 3rd edition, 1989), chap. 17
- (17) Yi Mu and C.M. Savage, J. Opt. Soc. Am. B 9 65 (1992); M.O. Scully and M.S. Zubairy, Quantum Optics (Cambridge University Press, 1995), chap. 21
- (18) J. Rarity and C. Weisbuch, Microcavities and Photonic Bandgaps (Kluwer, Dordrecht,1996), p 43-57
- (19) Y. Yamamoto and T. Kimura, IEEE J. Quant. Electron, QE-17 (1981); H van de Stadt, Astron. Astrophys. 36 341 (1974)
- (20) H.P. Yuen and V.W.S. Chan, Opt. Lett. 8 177 (1983)
- (21) R.P. Stanley et al., Phys. Rev. B 55 R4867 (1997)
- (22) D.F. Walls and G.J. Milburn, Quantum optics (Springer 1994), chap. 5
- (23) G. Messin et al., J. Phys.: Condens. Matter 11 6069 (1999); H. Eleuch et al., J. Opt. B: Quantum Semiclass. Opt. 1 1 (1999)
- (24) A correction is included to account for the non negligible value of the reflected field compared to the local oscillator.