Also at ]Physics Department, Kazan State University, Kazan 420008 Russia ††thanks: Corresponding author
Spectroscopy of the parametric magnons excited by 4-wave process
Abstract
Using a Magnetic Resonace Force Microscope, we have performed ferromagnetic resonance (FMR) spectroscopy on parametric magnons created by 4-wave process. This is achieved by measuring the differential response to a small source modulation superimposed to a constant excitation power that drives the dynamics in the saturation regime of the transverse component. By sweeping the applied field, we observe abrupt readjustement of the total number of magnons each time the excitation coincides with a parametric mode. This gives rise to ultra-narrow peaks whose linewith is lower than of the applied field.
The detailed understanding of the non-linear (NL) regime of the magnetization dynamics is important both from a fundamental point of view Slavin and Tiberkevich (2006) but also for applications in spintronic devices Prinz (1999). Interest resides in the exact nature of the parametric modes that are excited above the supercriciality threshold. Recent experiments performed on a yttrium iron garnet (YIG) film have shown that these parametric magnons can form a Bose-Einstein condensate Demokritov et al. (2006) under high power pumping. It was also demonstrated that their energy decay rate to the lattice is substantially diminished compared to the long wavelength modes de Loubens et al. (2005), which are usually studied by FMR In this paper, it will be shown that it is also possible to measure the FMR spectrum of these parameric magnons despite the fact that these high -vector spin-waves do not overlap with the homogeneous microwave field. This is achieved by saturating the dynamics of the mode that couples to the microwave. Any additional power that is injected in the spin system flows directly towards the excitation of these parametric magnons. Since each parametric mode has a different feedback influence on the saturation, it is possible, by sweeping an external parameter, to detect the point where the transfer from one parametric mode to another takes place. But the induced effects are small and detecting them requires both a sensitive and precise measurement setup.
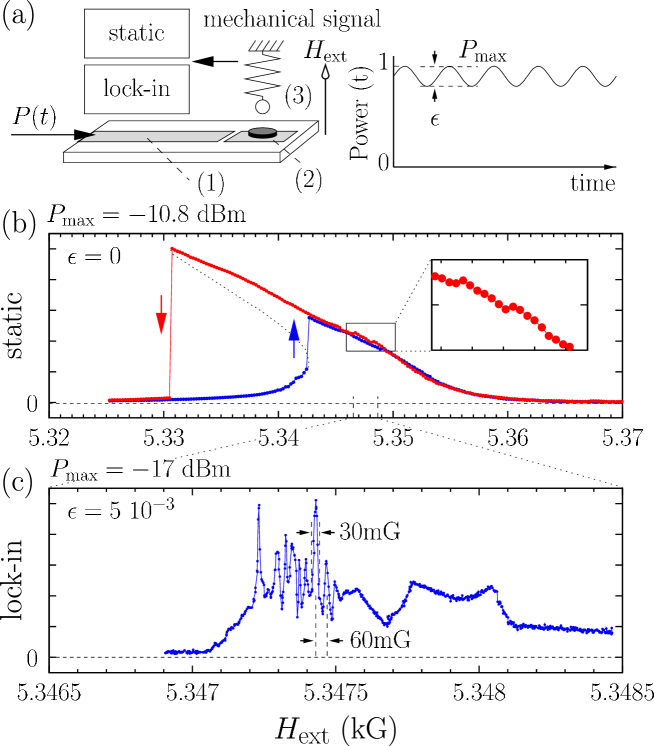
Our detection of the dynamical response uses a mechanical-FMR setup working at room temperature Zhang et al. (1996); Charbois et al. (2002a). This scheme is inspired by local probe techniques. The static component of the disk magnetization, , is coupled through the dipolar interaction to a magnetic probe attached at the end of a soft cantilever, whose deflection is monitored. Exciting the sample at a fixed frequency, spectroscopy is achieved by recording the cantilever motion as a function of the perpendicular dc applied field, , which is produced by a NMR electromagnet. The variation of force on the cantilever is proportional to the total number of magnons excited at resonance, , with . Further details about the mechanical-FMR experiment can be found in Ref.Naletov et al. (2003).
Driving the dynamics of ferromagnets in the NL regime requires to cant the magnetization, , away from its equilibrium axis by an angle exceeding a couple of degrees. Only powerful HF source can produce such large excitation amplitude An et al. (2004). Improvement of the efficiency can be gained with microstrip cavities, where the HF energy is concentrated in smaller volume. A schematic of our setup is shown in Fig.1(a). It comprises a mm wide Au stripeline fabricated by U.V. lithography and deposited on a mm thick alumina substrate whose bottom layer is a conducting ground plane. An impedance matched cavity (half-wavelength) is created by etching a 32m gap across the stripe. The HF source is tuned at the cavity frequency (GHz) set by the length (mm) of the isolated segment. The sample is a m thick YIG single crystal. The YIG film is ion milled into a disk of diameter m and placed at the center of the cavity. The homogeneous external static field , well above the saturation field, is applied parallel to the disk axis.
This work concentrates on the 4-magnons coupling term in the equation of motion of the magnetization. It becomes the dominant term once the premature saturation regime of the microwave susceptibility is achieved Suhl (1957). From previous experiments on the same sample de Loubens et al. (2005), we have established that the saturation threshold occurs at excitation power above -35dBm for our setup. Fig.1(b) shows the static deflection of the cantilever as a function of when dBm. The trace corresponds to the lineshape of the uniform mode Charbois et al. (2002b) in the foldover regime. Hysteretic behaviors are a standard signature of NL effects, where the eigen-frequency of the resonance depends on the amplitude of the excitation L’vov (1994). Foldover effects in magnetic materials have been explained by Anderson and Suhl in 1955 Anderson and Suhl (1955). The features of interest are the tiny steps observed in the wings of the resonance (see insert of Fig.1(b)). These jumps are not random. They are reproducible and occur regularly in field.
A more detailed picture can be obtained by measuring the differential response. We detect here the response to a source modulated excitation around the saturation regime. The power level follows the time dependence , where the modulation frequency is set at the resonance frequency of the cantilever. This frequency is much lower than all the damping rates of the spin system. In this case, the differential part of the mechanical signal is amplified by , the quality factor of the mechanical resonator. Fig.1(c) is the pattern recorded by a lock-in when the modulation amplitude is 0.5% () of the maximum power, dBm. It corresponds to a source modulation of less than 50nW in amplitude. The spectrum shown here is a zoom on a 2G sweep of in the reversible region of the static signal. We observe about ten ultra-narrow lines (width 30mG) regularly spaced every 60mG. Such sharp peaks resemble the parametric excitations observed by Jantz and Schneider in 1975 in the subsidiary absorption of YIG films Jantz and Schneider (1975) (3-wave process). To the best of our knowledge, this is, however, the first time that they are observed at resonance.
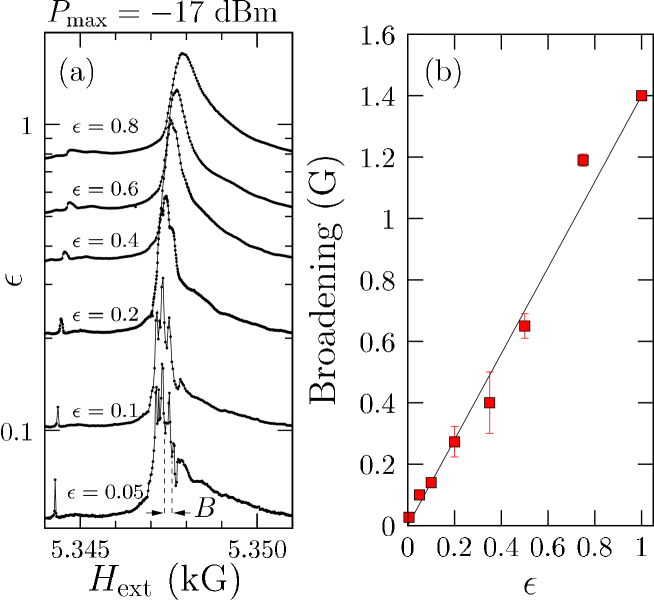
The striking characteristics of these peaks is their narrowness. This 30mG broadening is much smaller than the FMR linewidth G measured in the linear regime on the same sample Klein et al. (2003). Further insight can be obtained by looking at the shape of the signal (see Fig.2a) for different modulation depth, , at constant maximum power . Fig.2b shows that the broadening of the parametric peaks is clearly proportional to . Foldover effects establish a coupling between the HF power and the resonance frequency. Thus source modulation in the NL regime produces also a frequency modulation. But in FMR, there is no difference between frequency modulation and a modulation of the applied field, since both are coupled by the gyromagnetic ratio. Fig.1c can thus been seen as the differential characteristics of Fig.1b, where the depth of modulation is proportional to . At very low eventually the intrinsic broadening should be seen. Although a NMR electromagnet with a precision in has been used, the fact that extrapolates linearly down to the smallest value of reached by our setup, suggests that the intrinsic part of the broadening has not been measured here.

For completeness, we show in Fig.3 how the instability region evolves when the dc bias is increased at constant . We observe an increase of the applied field window, where parametric peaks occur. The size of the window follows monotically the amplitude of the dc power i.e how far we depart from the supercriticality threshold.
In the following, we propose an analytical framework to account for the main features observed experimentally. Saturation phenomena can be caused by a multitude of nonlinear processes: nonlinear dissipation, nonlinear phase mechanism, nonlinear energy feedback effect. In many cases several of these mechanisms, as well as nonlinear frequency shift, need to be accounted simultaneously for the correct description of the phenomenon. The most probable limiting mechanism in the case of perpendicular pumping is the nonlinear energy feedback. This mechanism is described by a 4-magnons interaction in the Hamiltonian of the system. It represents second-order parametric excitation of the pair of plane spin waves (, ) by the uniform precession (). Suhl showed in 1957, the equations of motion for the amplitudes of the plane spin waves have the form:
| (1) |
where is its energy decay to the lattice (the index must allow for -dependent relaxation rates de Loubens et al. (2005); Hoeppe and Benner (2005)). The equation for the amplitude of the uniform precession is given by
| (2) |
where the last term is the excitation field . The term describes nonlinear feedback effect of all the parametric waves on the uniform precession. This term gives effective nonlinear dissipation for . In the following, we will be looking at harmonics solution where all the spin-waves precess synchronously: .
As one can see from Eq. (1), an instability (exponential growth of the population) occurs if the effective damping of at least one parametric mode becomes negative:
| (3) |
Growth of will create effective damping for the unifrom mode (through the term in Eq. (2)), which will reduce to its threshold value:
| (4) |
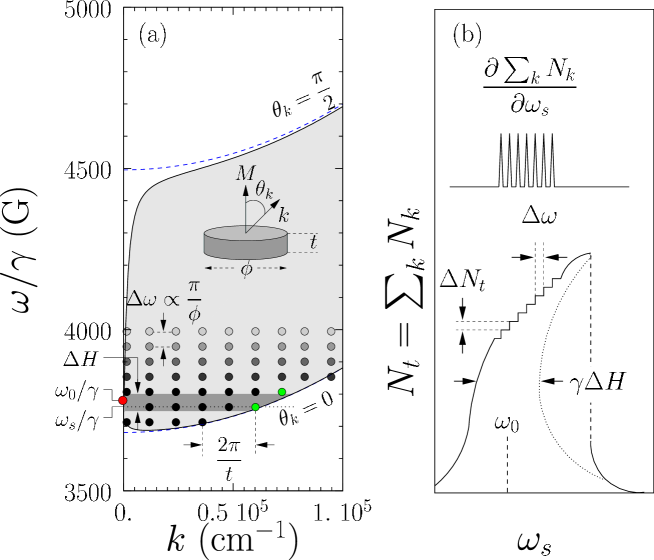
Determination of the mode that will grow unstable depends on the coupling , which is maximum G) for propagating parallel to the magnetization direction Suhl (1957). As shown on the magnon manifold drawn in Fig.4, these longitudinal SW have a wave-vector , where is the exchange constant and is the transverse depolarization factor. For our disk, it corresponds to a standing spin-wave confined across the thickness with about 5 nodes along it. In this model, the threshold power is given by the analytical formula, and the calculated value mOe agrees with the the onset of saturation measured experimentally de Loubens et al. (2005).
Sweeping the bias magnetic field (or ) changes the nature of the parametric mode that grows unstable, as the minumum in Eq. (4) occurs for different value of . Finite size-effects introduce a discretisation in -space of all the SW. The frequency separation between two nearby normal mode is about , where corresponds to the quantification of the -vector along the largest sample dimension. The parametric modes have thus a principal wavector , with a small additional component in the disk plane. We find numerically Oe, a predicted separation twice as large as what is observed experimentally in Fig.1(c). The value of however depends strongly on the angle of propagation of the degenerate magnons. A deviation of about 7° of their propagation direction compare to the normal of the disk will be enough to explain the discrepancy.
The amplitude of the steps can also be estimated analytically with an approximated model. Assuming that only one pair of parametrically coupled waves dominates all the others, then its amplitude can be infered from Eq. (2). If the mode is excited, then its amplitude will grow to the level:
| (5) |
that provide the effective damping to fix at the level given by Eq. (4). The number of magnons in the majority mode changes abruptly with the change of the excited mode due to the sweep of the magnetic field. In the differential graphs this will lead to a singularity at the points, where the transfer from one excited mode to another takes place. In reality, due to the presence of the thermal noise and other nonlinear processes (that are ignored here) one will observe a sharp (intrinsically broaden) peak at the points where the transfer from one excited mode to another occurs.
To see this more clearly, let us assume that coupling coefficients of all modes are the same, . Then the changes of the parametrically excited modes (say, modes 1 and 2) will be at such a magnetic field, that (see Eq. (4).
Assuming that and we can write and, approximately,
| (6) |
where is the supercriticality parameter of the microwave magnetic field.
Thus, the total number of spin wave modes differ by
| (7) |
which will give small ”steps” (of the order of 1% of ) in the behavior of at different ”integral” characteristics and ultranarrow peaks at ”differential” characteristics of vs. . These analytical findings are in good agreement witht the experimental observed in Fig.1.
In conclusion, we have achieved FMR spectroscopy of parametric magnons. The observed linewidth of 30 mG corresponds to a lifetime of the order of 2s, which should be compared with the spin-lattice relaxation rate ns usually observed in the lineare regime Klein et al. (2003). Such long lifetime starts to become comparable to the one found in nuclear magnetic resonance using shimmed magnets. This result opens up the possibility of making ultra-stables Yig Tuned Oscillators or ultra-sensitive absolute magnetic field detectors using these parametric resonances.
References
- Slavin and Tiberkevich (2006) A. N. Slavin and V. S. Tiberkevich, Phys. Rev. B 74, 104401 (pages 4) (2006), URL http://link.aps.org/abstract/PRB/v74/e104401.
- Prinz (1999) G. A. Prinz, J. Magn. Magn. Mater. 200, 57 (1999).
- Demokritov et al. (2006) S. O. Demokritov, V. E. Demidov, O. Dzyapko, G. A. Melkov, A. A. Serga, B. Hillebrands, and A. N. Slavin, Nature 443, 430 (2006), URL http://www.nature.com/doifinder/10.1038/nature05117.
- de Loubens et al. (2005) G. de Loubens, V. V. Naletov, and O. Klein, Physical Review B (Condensed Matter and Materials Physics) 71, 180411 (pages 4) (2005), URL http://link.aps.org/abstract/PRB/v71/e180411.
- Zhang et al. (1996) Z. Zhang, P. C. Hammel, and P. E. Wigen, Appl. Phys. Lett. 68, 2005 (1996).
- Charbois et al. (2002a) V. Charbois, V. V. Naletov, J. Ben Youssef, and O. Klein, Appl. Phys. Lett. 80, 4795 (2002a).
- Naletov et al. (2003) V. V. Naletov, V. Charbois, O. Klein, and C. Fermon, Appl. Phys. Lett. 83, 3132 (2003).
- An et al. (2004) S. Y. An, P. Krivosik, M. A. Kraemer, H. M. Olson, A. V. Nazarov, and C. E. Patton, J. Appl. Phys. 96, 1572 (2004).
- Suhl (1957) H. Suhl, J. Phys. Chem. Solids 1, 209 (1957).
- Charbois et al. (2002b) V. Charbois, V. V. Naletov, J. Ben Youssef, and O. Klein, J. Appl. Phys. 91, 7337 (2002b).
- L’vov (1994) V. S. L’vov, Wave turbulence under parametric excitation (Springer, Berlin, 1994).
- Anderson and Suhl (1955) P. W. Anderson and H. Suhl, Phys. Rev. 100, 1788 (1955).
- Jantz and Schneider (1975) W. Jantz and J. Schneider, Phys. Stat. Sol. (a) 31, 595 (1975).
- Klein et al. (2003) O. Klein, V. Charbois, V. V. Naletov, and C. Fermon, Phys. Rev. B (Rapid Comm.) 67, 220407 (2003).
- Hoeppe and Benner (2005) U. Hoeppe and H. Benner, Physical Review B (Condensed Matter and Materials Physics) 71, 144403 (pages 7) (2005), URL http://link.aps.org/abstract/PRB/v71/e144403.