Effect of oxygen isotope substitution and crystal micro-structure on magnetic ordering and phase separation in
Abstract
The crystal and magnetic structures of the specified CMR manganite system have been studied as a function of across the metal-insulator (MI) transition, and of the oxygen mass (16O, 18O). We quantitatively show how the polaronic narrowing of the carrier bandwidth and the crystal lattice micro-strains control the volume fractions of the mesoscopic ferro- and antiferromagnetic clusters. A well-defined dip in the transition temperatures and the suppression of all the types of long range ordering seen near the MI-transition at indicate a key role of the quenched disorder for the formation of the long-scale phase separated state.
pacs:
75.47.Gk, 61.12.Ld, 75.30.-m,I Introduction
The presence of large Zhao et al. (1996) or giant oxygen isotope effects Zhao et al. (1997); Babushkina et al. (1998) in the colossal magnetoresistance (CMR) manganese oxides (A is rare earth element, A′ is Ca, Sr, Ba) is now well established and it is proven to be an intrinsic property of these systems. Due to the strong electron-phonon coupling mediated by the Jahn-Teller effect the substitution of by can significantly change the effective exchange interaction between neighboring Mn ions Gor’kov and Kresin (2004). In case of double exchange (DE) type of interaction the increase in the oxygen mass strongly reduces the effective charge carrier bandwidth, thus shifting the system towards insulating state, while the standard superexchange with large Hubbard energy gap is not supposed to be affected by the oxygen mass. Thus the value of the isotope effect on the metallic and insulating states of the above systems can reveal the underlying interatomic and electron lattice interactions responsible for particular magnetic, charge and orbital ordering, which are strongly coupled together because of the 3d-electron anisotropy and the mixed valence. The low bandwidth manganite family (LPCM hereafter) has the fixed optimal hole doping and variable A-cation radius that is linearly connected with the Pr-concentration . The principal effect of decreasing is a decrease in Mn-O-Mn bond angle, which leads to the decrease in the electron transfer integral between the Mn-ions. The metal-insulator (M-I) boundary lays at the Pr-concentration between and Hwang et al. (1995); Babushkina et al. (1999). The metallic state is conditioned by the well known double exchange and it is ferromagnetic (FMM), e.g. for Wollan and Koehler (1955); Huang et al. (1998). The magnetic structure of the insulating state can be both antiferromagnetic (AFMI) with the pseudo-CE type magnetic structure Cox et al. (1998); Balagurov et al. (2001a) and ferromagnetic for the Pr-concentrations close to . The AFMI state is a Mott insulator state with the charge ordering of the ions similar to the case of , whereas the origin of the genuine ferromagnetic insulating phase (FMI) is not completely understood and it is characterized by a non-ordinary kind of orbital/charge ordering Fisher et al. (2003); Papavassiliou et al. (2003); Kajimoto et al. (2004); Pissas et al. (2005). The LPCM system can be converted from the metallic to insulating state by the isotope substitution Babushkina et al. (1998); Balagurov et al. (1999). Similar giant isotope effect was observed in Zhao et al. (1997). The complete suppression of the ferromagnetic transition temperature cannot be attributed to a solely polaronic narrowing of the bandwidth within the DE model Zhao et al. (1996); Gor’kov and Kresin (2004), but requires an inhomogeneous phase separated state, which was indeed directly observed by different experimental techniques in Balagurov et al. (2001a); Tokunaga et al. (2004) and in the similar series Uehara et al. (1999); Littlewood (1999). The neutron diffraction study Balagurov et al. (1999) has shown that the increase in the oxygen mass completely converts the dominating FMM metallic phase into the insulating charge ordered AFMI one in LPCM with . The presence of the long scale percolate phase separation in the manganites itself has been attracting special experimental and theoretical attention. There are two main concepts of the mesoscopically inhomogeneous state in the manganites. One standpoint is that the intrinsic quenched disorder enhances the fluctuations of the competing orders near the original bi-critical point Burgy et al. (2001, 2004); Alonso et al. (2002); Blake et al. (2002); Akahoshi et al. (2003); De Teresa et al. (2005). In another approach, the lattice distortions and the long-range strain Littlewood (1999); Ahn et al. (2004); Podzorov et al. (2001); Sharma et al. (2005) are the dominant factors controlling the phase separation, similar to the one observed at the martensite type structural transition. Motivated by the spectacular giant isotope effect and the problem of phase separation we have undertaken a systematic neutron and synchrotron x-ray diffraction study of a series of the samples for with and . In the paper we present the detailed data on the structure and magnetic properties of the FMM, FMI and the charge ordered AFMI phases and discuss the key parameters conditioning the giant isotope effect and the phase separation in the LPCM-system. Earlier we have performed a diffraction study with another series of samples of the same system prepared by a different chemical route Balagurov et al. (2001a), in which the effect of the oxygen isotope substitution has been studied only for one concentration . Moreover the different synthesis route used in the present study gives different microstructure parameters, which as we show below, have influence on the phase separation and hence on the oxygen substitution effect.
The paper is organized as follows. In Sec. II the details of the sample synthesis, oxygen treatment and the experimental measurements are given. In Sec. III.1 the temperature dependences of the magnetic susceptibility are analyzed. The ferromagnetic transition temperatures determined from are used as independent estimations of complementary to ones determined from the neutron diffraction measurements. In Sec. III.2 the room temperature crystal structure and microstructure parameters as a function of are compared for and -samples. In Sec. III.3 the structure parameters are analyzed as a function of temperature between 15 K and 1200 K across the orbital order-disorder transition at K. In Sec. III.4 we show the evolution of the orbital and charge order as a function of doping . In Sec. III.5 the data on the temperature dependence of the magnetic state and the spatial phase separation are presented. The magnetic transition temperatures and the magnetic ground state (the phase fractions, ordered magnetic moments) are obtained as a function of doping and the oxygen mass. Sec. III.6 explains the connection between the phase separation and the lattice micro-strains (static variance of metric parameters). In Sec. III.7 the suppression of all types of ordering near critical concentration is discussed. This effect can be well interpreted in the theoretical model Burgy et al. (2001, 2004), which assumes the presence of compering states and quenched disorder near .
II Samples. Experimental
The crystal structure parameters of a LPCM sample for given depend not only on but also on the sample preparation procedure. For example, the spontaneous orthorhombic strain, thermal displacement parameters (reflecting also the local static disorder), the lattice micro-strains decrease as a function of annealing time and of the cooling time through the high temperature pseudocubic-orthorhombic structural transition. Thus, a precise study of a real LPCM system as a function of and the oxygen mass can be done only within a series of samples prepared and thermally treated at the very identical conditions. The samples, which are denoted as “O-series”, were calcined at temperatures 1270-1570 K for 100h from , , oxides and with 3 intermediate grindings. These samples we call “as-prepared”. The final - and -samples were obtained via respective oxygen isotope exchange in closed quartz tubes in parallel under the controlled gas pressure slightly above 1 bar at 1270 K during 40h and then cooled down to 290 K with the rate 30 K/h. The -samples had 80% of -isotope, measured by the weight gain after the oxygen exchange. The control weighing of the -sample gave the same mass within accuracy %. The mass of each sample was about 2 g. The oxygen content in all the samples was determined by the thermogravimetric hydrogen reduction Conder et al. (2002) and amounted to 3.003(5). The samples with and 0.95 were prepared only with . One of the samples which has been studied earlier Balagurov et al. (1999); Balagurov et al. (2001a, b), was also oxygen treated in the same way as all the samples from the O-series. This sample is from a series prepared by a synthesis from the aqueous solutions of the respective metals nitrates (denoted as “N-series”).
The magnetic susceptibility was measured in zero external field with amplitude of the field 10 Oe and frequency 1 kHz using Quantum Design PPMS station. Neutron powder diffraction experiments were carried out at the SINQ spallation source of Paul Scherrer Institute (Switzerland) using the high-resolution diffractometer for thermal neutrons HRPT Fischer et al. (2000a) ( Å, high intensity mode ), and the DMC diffractometer Fischer et al. (2000b) situated at a supermirror coated guide for cold neutrons at SINQ ( Å). All the temperature scans were carried out on heating. X-ray synchrotron diffraction at room temperature was done at the Material Sciences beam line (MS, SLS/PSI). The refinements of the crystal and magnetic structure parameters were carried out with FULLPROF Rodriguez-Carvajal (1993) program, with the use of its internal tables for scattering lengths and magnetic form factors.
III Results and discussion
III.1 Magnetic susceptibility
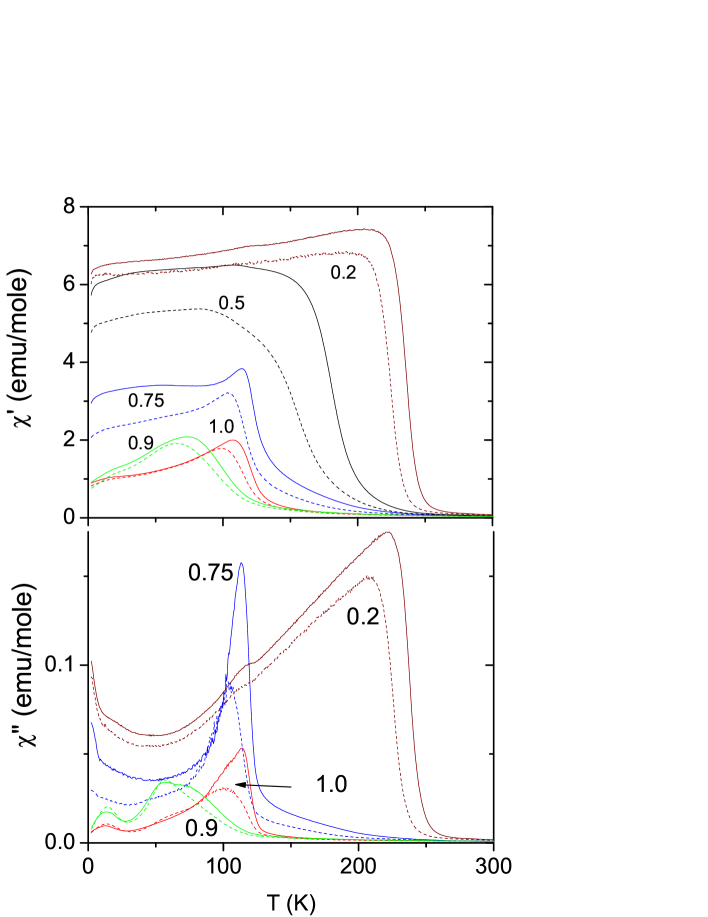
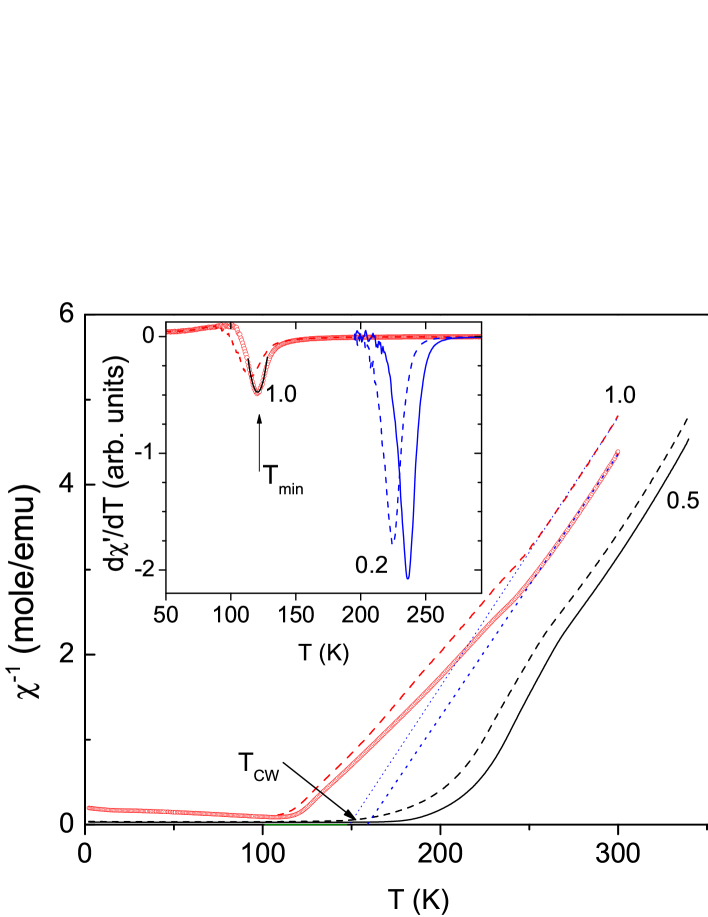
The main use of the magnetic susceptibility data for the purposes of the present work is the determination of the ferromagnetic transition temperatures, complementary to the NPD data. The as a function of temperature is shown in Fig. 1 for several selected samples [since the are quite similar for the samples with close values of Pr-concentrations, not all the -curves are shown to avoid the plot overload]. This plot nicely illustrates the systematic decrease in the magnetic transition temperatures as a function of the oxygen mass. All the samples show (Fig. 2) the ferromagnetic type of the Curie-Weiss susceptibility at high temperatures. The slope of the becomes non-linear below K due to the presence of the antiferromagnetic correlations which are developed as the temperature decreases down to the Néel temperature K. The Curie-Weiss temperatures were determined from the fit of the high temperature susceptibility to in the temperature range ( K) depending on content. The Curie-Weiss temperatures amounted to K for the -samples for . They are in agreement with the ferromagnetic transition temperatures determined from NPD only for and , while for the higher Pr-content is significantly higher than . In the -substituted samples the is decreased similar to the change in , implying smaller effective electron transfer integral which mediates the ferromagnetic coupling for the heavier oxygen ion. The Curie-Weiss constant allows estimating the paramagnetic Mn-spin value . The experimental values of amounted to emu/mol depending on the -content that correspond to the effective spin , instead of the expected value of 3.7 for the given ratio. The enhanced value of the Curie-Weiss constant is a typical feature of the ferromagnetic manganite system and is attributed to the formation of the ferromagnetic clusters well above Franck et al. (2002); De Teresa et al. (1997). The quantitative analysis of as a function of is difficult because the Curie-Weiss constant value depends on the temperature interval used for the fit and the large variation of the . The imaginary part of the susceptibility shows a maximum at a temperature very close to for all (Fig. 1). The maximum is caused by the absorption due to the ferromagnetic domains formation with sufficiently short relaxation times close to , where is the external field frequency. This maximum is asymmetric and can be very broad, so the temperature of the maximum cannot be used for quantitative estimation of the . A good way of the evaluation of the ferromagnetic transition temperature is the analysis of the derivative of the magnetic susceptibility which has a well defined minimum as shown in the insert of Fig. 2. The temperature of the minimum will be taken as an independent, complementary to the NPD data, estimation of .
III.2 Crystal structure and microstructure
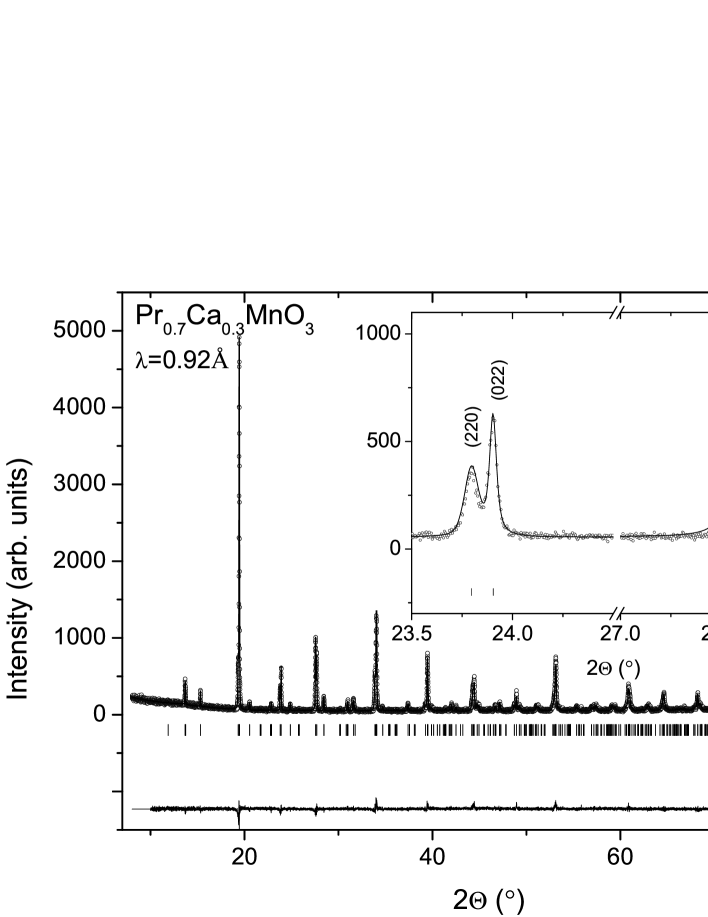
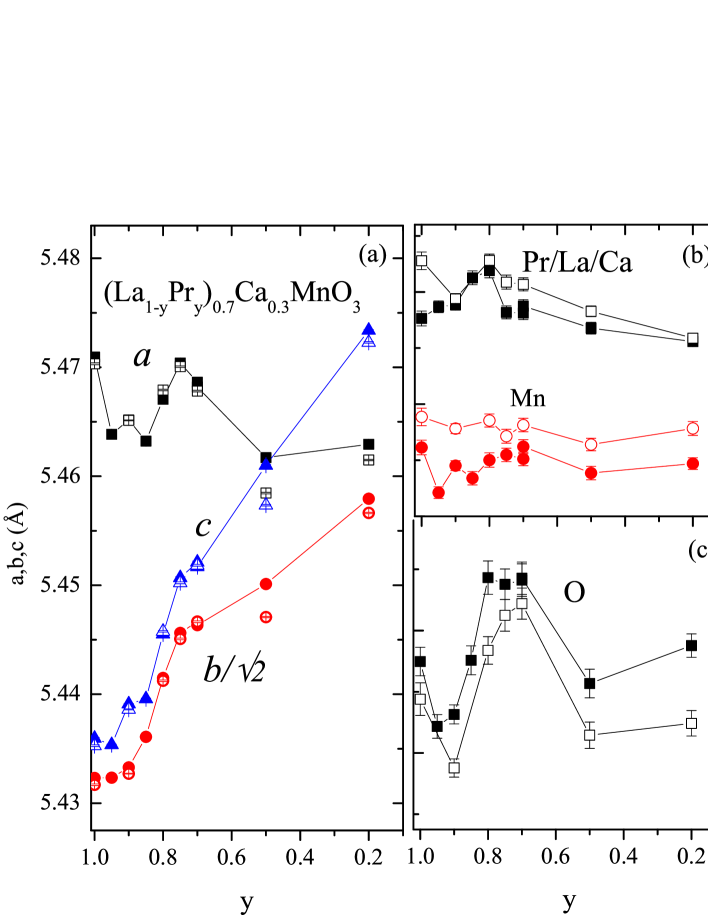
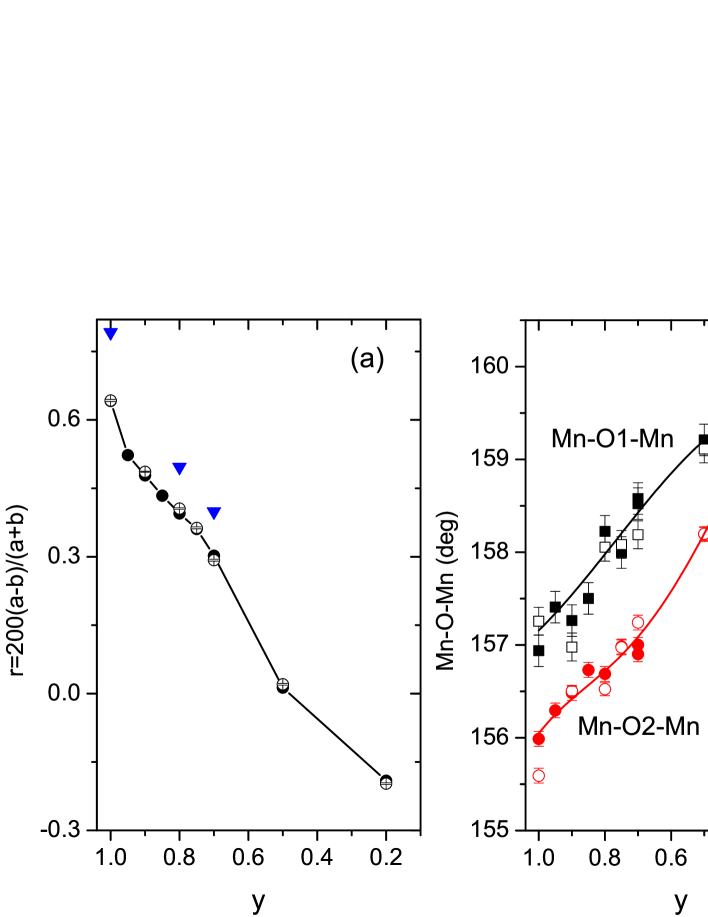
The crystal structure for all the compositions at all temperatures is well refined in single phase in the orthorhombic space group with the standard for these compounds structure model (see e.g. Balagurov et al. (2001b)). In general, the low temperature state is spatially mesoscopically phase separated, but the lattice constants of the phases are too close to each other and the two phase refinement is not reliable. However, there are cases where the structure separation is explicitly visible, e.g. in the system () the metrics of the phases are sufficiently different and both phases can be identified in the neutron diffraction experimentBalagurov et al. (2005). The examples of the x-ray synchrotron diffraction pattern and the neutron diffraction pattern and their refinements are shown in Fig. 3 and Fig. 4, respectively. All the room temperature ( K) crystal structure parameters except for the thermal displacement parameter do not depend on the oxygen mass within the accuracy 0.2%. The lattice constants, which are determined with the best accuracy (Fig. 5(a)) are slightly systematically smaller for the -samples: for the unit cell volume is 0.2% smaller, for the the volumes match within 0.02%. The only structure parameter which is noticeably and systematically changed by the oxygen isotope substitution is the thermal displacement parameter . The oxygen thermal parameter is slightly decreased, while the Mn and A-cation ones are pronouncedly increased as a function of oxygen mass (Fig. 5(b,c)). These changes agree with the expected behavior of the , where is the atom mass, the is averaged over the phonon density of states Lovesey (1987). The parameter should increase as a function of an average atom mass provided that the elastic force constants are not changed. Hence the thermal parameters of Mn and A-cation should increase, while the oxygen -value behavior cannot be simply predicted because both and are changing. Figure 6 illustrates systematic distortion of the structure as a function of the Pr-concentration . The Mn-O-Mn bond angles are systematically decreased conditioning the change from the metallic to insulating state at the concentration above . At the same time the orthorhombic strain is substantially increased with the increase in . The values of strain for the “as-prepared” samples (also shown in the Fig. 6a) are significantly larger stressing the point that the systematic study of the present system as a function of and the oxygen mass is only possible within a series of samples prepared and treated in identical way.
The microstructure of the samples was obtained from the analysis of the Bragg peak broadening (anisotropic in general) as a function of scattering angle () by the following procedure. The Bragg peaks were described by the pseudo-Voight distribution function with the Gaussian () and Lorentzian () components. The total peak width was calculated from the individual components using a 5th order polynomial approximation as described in Ref. Thompson et al. (1987) and implemented in the FULLPROF code Rodriguez-Carvajal (1993). The angular dependence of the peak width was approximated by the Cagliotti-type function and for the Gaussian and Lorentzian components respectively. All the widths correspond to the full width at half-maximum (FWHM) and the angles are measured in radians. , , and were fixed to the values given by the instrumental resolution function. and are the Rietveld refined Gaussian and Lorentzian components related to the sample micro-strains. and are the refined components related to the finite size broadening. The total widths both for the micro-strain () and the finite size () broadening were calculated from the individual Gaussian and Lorentzian refined components by means the above mentioned 5th-order polynomial approximation. The apparent sizes () are connected with the broadening by well-known Debay formula . The micro-strains or the static fluctuations of crystal lattice constants are determined from the variance of the metric parameters (,,) of the reciprocal space. The square of the reciprocal distance for a Bragg reflection with Miller indices () for the orthorhombic singony reads . The variance of is related to the widths of the diffraction peaks as . General description of the anisotropic peak broadening is given in Ref. Stephens (1999). In our case we consider the isotropic micro-strains , where stands for , or lattice constants, and an additional micro-strain along -axis that have the contributions to the reciprocal distance variance and , respectively. The presence of the anisotropic broadening is nicely illustrated by the two doublets shown in the insert of Fig. 3.
The sample related peak broadening is comparable with the resolution of neutron diffraction instrument HRPT, therefore we have performed a comparative ultra-high resolution synchrotron x-ray diffraction study of several samples at room temperature. The examples of the reduced sample related peak widths as a function of scattering vector are shown in the insert of Fig. 4. The width includes the isotropic micro-strains and the finite size broadening components. One can see that the experimental broadening is dominated by the micro-strain effect, which gives a constant term to , whereas the finite size effect gives a term. The apparent sizes are larger than Å giving a relatively small contribution to the broadening (assuming increases the refined micro-strain values by less than 10%). The micro-strains refined from the neutron and synchrotron data agree within the statistical error bars. This implies that in spite of lower resolution of the neutron diffraction data ( and for the synchrotron x-ray and neutrons respectively) we can reliably extract the microstructure parameters from the NPD data. The lattice micro-strains allow us to characterize the amount of quenched disorder and the presence of the charge ordering as discussed in the following sections.
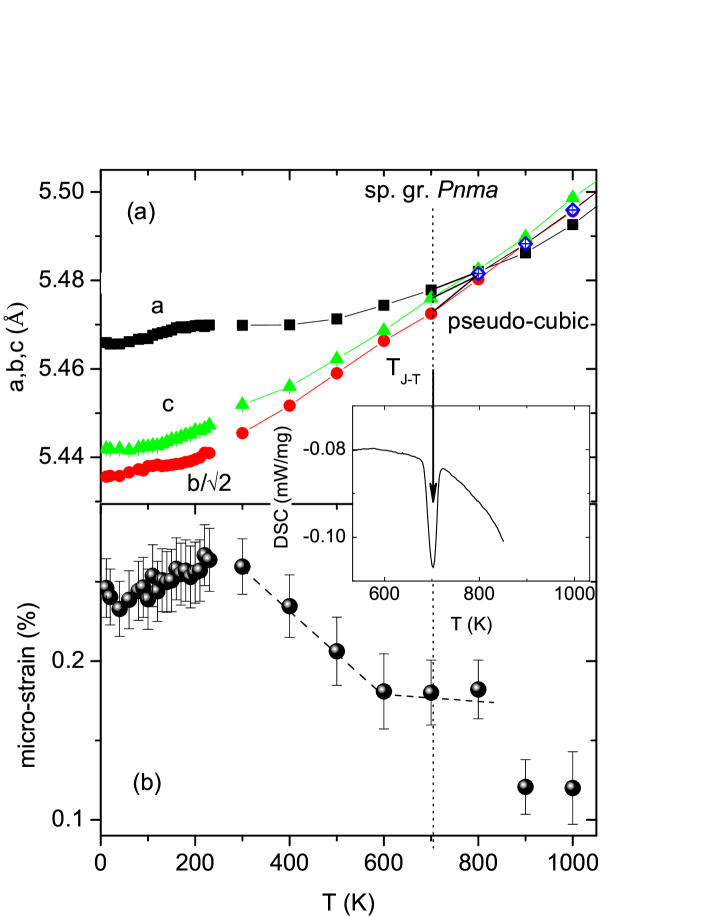
There are two transitions in associated with the changes in the crystal structure. The first transition at high temperature is a fist order isostructural phase transition from the pseudo-cubic to the orthorhombic orbital ordered structure similar to the one observed in the stoichiometric Rodriguez-Carvajal et al. (1998). The second transition at lower temperature is related to the charge ordering of the Mn-ions and is accompanied by the lowering symmetry to the monoclinic one and the unit cell doubling along the orthorhombic -axis. We have studied the crystal structure of several compositions of LPCM up to the high temperatures across the transition to the pseudocubic phase.
III.3 Orbital order-disorder transition
The study the crystal structure of LPCM up to the transition to the pseudocubic phase allowed us to get a wide range of the changes in the crystal structure, which helped to understand the temperature behavior of the crystal structure at low temperature. Figure 7 shows the crystal lattice constants and the isotropic micro-strain parameter in the LPCM sample with y=0.75. The latent heat at the transition temperature (insert in Fig. 7) points to the first order phase transition. Above the transition the crystal structure is metrically cubic and the refinement in the profile matching mode in the cubic metrics gives the same quality of the fit () with the lattice constant shown by rhombs in Fig. 7a. In addition, the octahedron gets regular above the transition. The structure is thus becoming pseudo-cubic. This has inspired us to search for a possible alternative cubic crystal structure description, similar to the attempt undertaken in Rodriguez-Carvajal et al. (1998). The diffraction pattern at 800 K is indexed in the cubic cell with Å. The list of possible space groups with their numbers in brackets, which does not contradict the set of observed diffraction peaks contains seven possibilities: (198), (208), (195), (200), (207), (215) and (221). Our trial structure solutions (carried out with the program FOX Favre-Nicolin and Cerny (2002)) did however fail to find a suitable candidate structure model. As it was actually pointed out in Rodriguez-Carvajal et al. (1998), the failure could have been predicted by the even earlier studies by Glazer Glazer (1975), who did not deduce any primitive cubic space group for the structure with lattice constant for the distorted perovskite which could have originated from the coherent octahedra tilts.
The micro-strain value is markedly increased below the transition temperature (Fig. 7b). The lattice constant mismatch in the adjacent crystal domains and/or twins naturally creates the internal micro-strains below the transition . This is important to note because the phase separation at low temperature depends on the value of the micro-strains, which will be inevitably present in the LPCM system due to this structure transition.
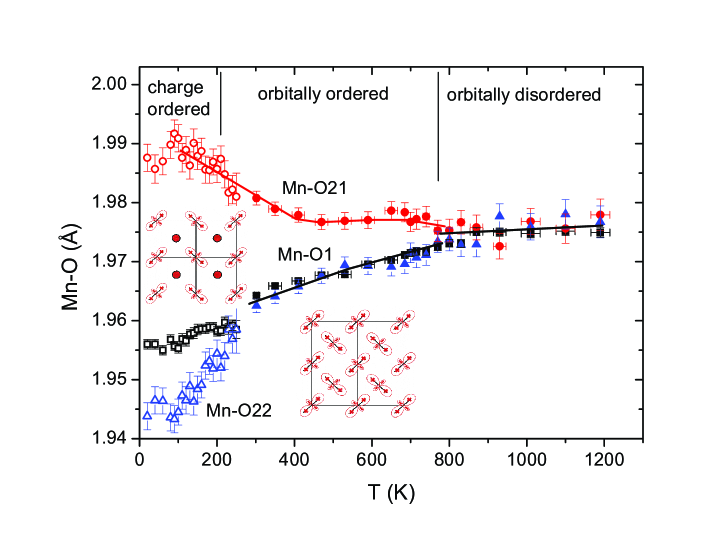
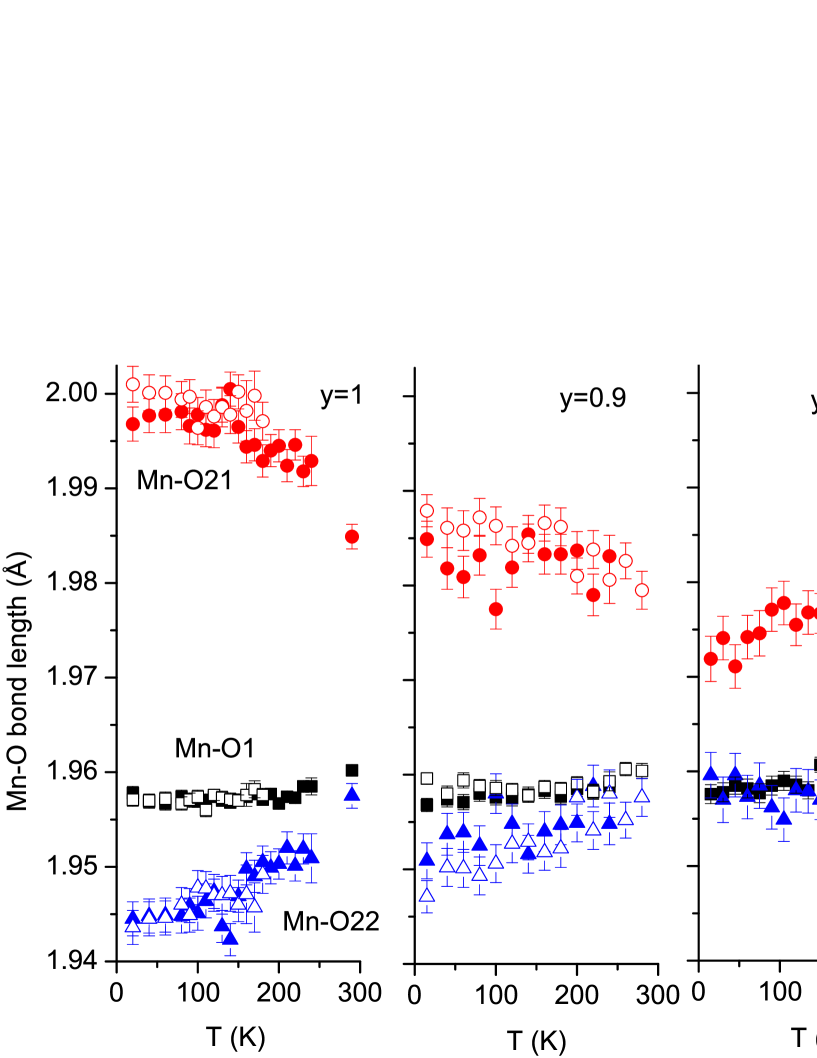
Figure 8 shows the bond lengths between manganese and oxygen atoms in the -octahedra as a function of temperature. Mn-O1 is the bond directed to the oxygen in the position shifted along -direction with respect to the Mn-atom. Mn-O21 and Mn-O22 are the bonds to the oxygen atoms located roughly in the plane. The transition at is a Jahn-Teller type of transition connected with the lifting up of the orbital degeneracy. The filling of the orbitals can be determined from the value of an angle , which is the polar angle in the plane of normal coordinates Kanamori (1960). The coordinates are given by the distortion of the octahedron , , where , , are the short, medium and long Mn-O bond lengths, respectively. One can see from the Fig. 8 that above all three bonds are equal, implying that both -orbitals are equally populated. Below the transition two of them remain equal (), that gives the angle . This angle corresponds to the complete filling of the -orbital or for another choice of axes to equivalent - or - orbitals [they are related to each other by rotation in the -plane]. In the structure it corresponds to the antiferrodistorsive type of orbital ordering (OO) schematically shown in the Fig. 8. It is interesting to compare with the case of , where below the transition the -orbital is % filled, while above the transition the angle amounted to (), which also corresponds to the equal filling of the orbitals Rodriguez-Carvajal et al. (1998). In the later case the -type of the octahedron distortions remain in the high-temperature phase due to the interactions between the distortions. In our case the interaction between the Jahn-Teller active ions is weakened due to the dilution by 30% of the statistically distributed ions and thus the octahedron behaves like a free molecule with equally populated -orbitals. The difference in the in-plane bond lengths Mn-O2 in the OO state at room temperature is an order of magnitude smaller in the case of LPCM (cf. Å vs. Å). This abrupt decrease in the bond length mismatch as a function of the fraction is an additional evidence of the cooperative nature of the Jahn-Teller effect. In the where the ratio of is “50:50” the -octahedron remains almost regular at room temperature Radaelli et al. (1997).
III.4 Charge order transition
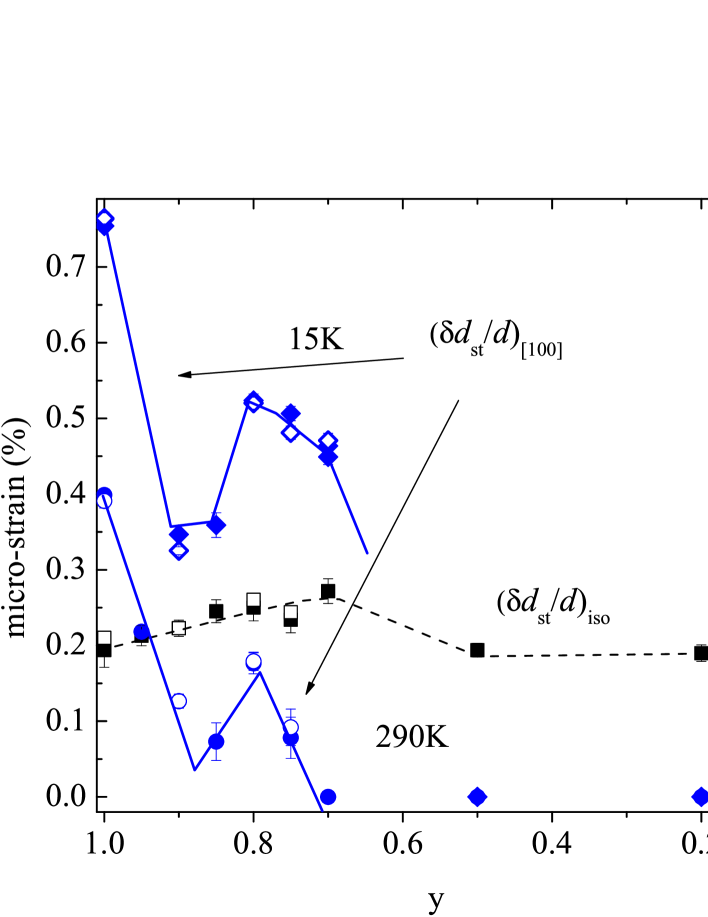
The LPCM system undergoes a transition to the charge ordered state (CO) at Cox et al. (1998); Balagurov et al. (1999). The transition is revealed by the appearance of weak superstructure peaks reflecting the doubling of the unit cell along -axis and the lowering of the symmetry probably to the monoclinic one similar to the case of Radaelli et al. (1997). However, the deviations from the average structure are small and do not allow a reliable detection of the charge ordering. Better structure indicators of the CO-transition are the increase in the Mn-O bond lengths mismatch and the appearance of the anisotropic lattice micro-strains in the CO state. One can see (Fig. 8) that below K the two equal Mn-O bond length become different. We believe that this is a manifestation of the charge ordering which is schematically shown as insert in Fig. 8. This type of and orbital ordering in the plane is dictated by the Goodenogh-Kanamori rules and the low temperature magnetic structure (PCE). In Ref. Cox et al. (1998) there was proposed that in the sites shown with the -type orbital are fully occupied by , while those shown by circles are occupied by with the ratio . Since the structure is described in the average space group the atom positions are averaged over the symmetry elements of . The orbital ordering in the charge ordered phase would give roughly equal average in-plane Mn-O2 bond length. However, even in an ideal case of CO in the in-plane Mn-O2 bond lengths become different in the CO-phase at low temperature in the -description Radaelli et al. (1997). The in-plane Mn-O2 bond length mismatch in the LPCM is larger apparently due to the larger fraction. An evident indicator of the charge ordering is the mismatch of the short Mn-O22 and Mn-O1 bond lengths. In the antiferrodistorsive OO state all the -orbitals are in the -plane, while below the CO-transition the -orbitals located at “” sites should be oriented perpendicular to the -plane to stabilize the ferromagnetic coupling between the neighboring planes along -axis of the PCE-type antiferromagnetic structure. This is reflected as a decrease in the short Mn-O22 with respect to the Mn-O1 bond below K (Fig. 8). Figure 9 shows the temperature dependences of the bond lengths as a function of Pr-concentration . One can see that the difference of the Mn-O1 and Mn-O22 bond lengths is drastically decreased near , reflecting the suppression of the charge ordering. In the metallic predominantly ferromagnetic state () CO is suppressed as well. Another parameter which can be considered as a structure indicator of the CO state is the anisotropic micro-strain along -axis, along which the doubling of the unit cell occurs in the CO phase. This implies that the CO/OO is not perfectly homogeneous as in purely “50:50” composition but there is a distribution of domains with different extent of CO thus leading to the dispersion of the lattice constant . The anisotropic micro-strain is pronouncedly increased on cooling for , but has a nonzero value at room temperature 290 K as shown in Fig. 10. A remarkable feature of is a local minimum around pointing to a suppression of the CO concomitantly with the suppression of the AFM and FM ordering as discussed below. The isotropic micro-strain value (also shown in Fig. 10) doesn’t exhibit any peculiarity at ruling out any kind of sample effect.
III.5 Magnetic state
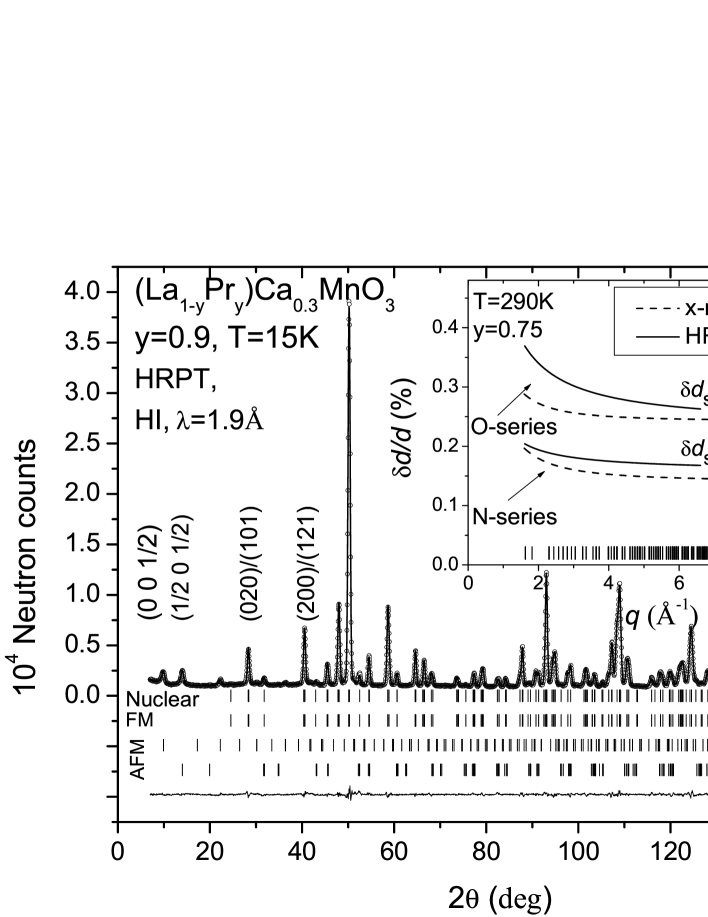
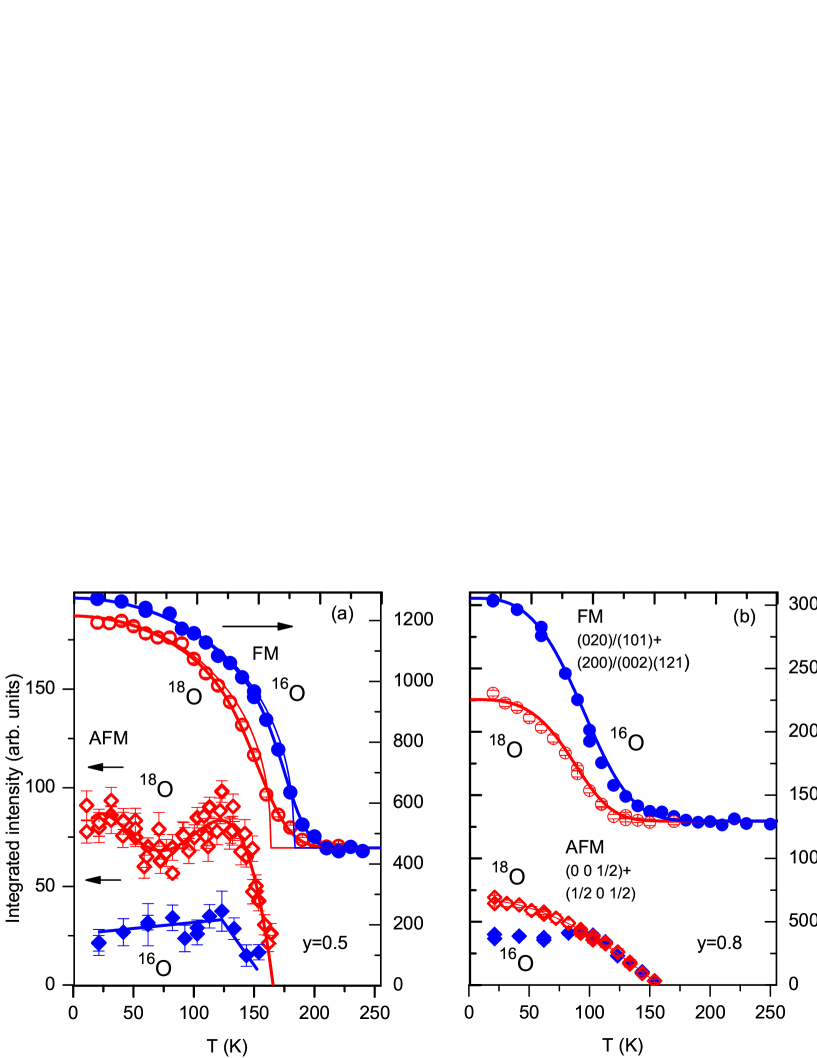
The temperature dependences of the magnetic Bragg peak intensities allow accurate determining of the transition temperatures to the AFM and FM states (, ). A typical diffraction pattern is shown in Fig. 4, where the tick rows indicate the nuclear and magnetic phases. The magnetic structure consists of AFM pseudo-CE component with Mn-spin directed along and FM component in -plane similar to the one reported in Cox et al. (1998); Balagurov et al. (2001a). In addition, the Pr-spins also get ferromagnetically ordered parallel to the FM-component of Mn-spins. The refined low temperature magnetic moments are presented in Table 2. Figure 11 shows several examples of the temperature dependences of the selected magnetic Bragg peaks . The and samples for each -concentration were prepared in the same amounts and measured in the identical experimental conditions and thus the integrated intensities shown in Fig. 11 were normalized only to the neutron monitor (number of incoming neutrons). Above 100K the samples with are in purely AFM state that is not affected by the oxygen substitution. The Neel temperatures are the same and the whole sample volume is occupied by the AFM phase, as illustrated by Fig. 11b. The ferromagnetic phase is suppressed by the increase in the oxygen mass that is reflected by the splitting of the AFM integrated intensities for the and samples roughly below 100K.
One sees that the AFM transition is very well defined by the abrupt vanishing of the respective Bragg peaks. The ferromagnetic state is destroyed in a more smoother way. Some fraction of the sample volume remains ferromagnetic above the transition as one can see from the smeared shape of the FM Bragg peak intensities near . To determine the transition temperatures in an unbiased systematic way we performed least-square fits of the experimental in assumption of the Gaussian distribution of the transition temperatures and a phenomenological power-low function for the spontaneous magnetization:
| (1) |
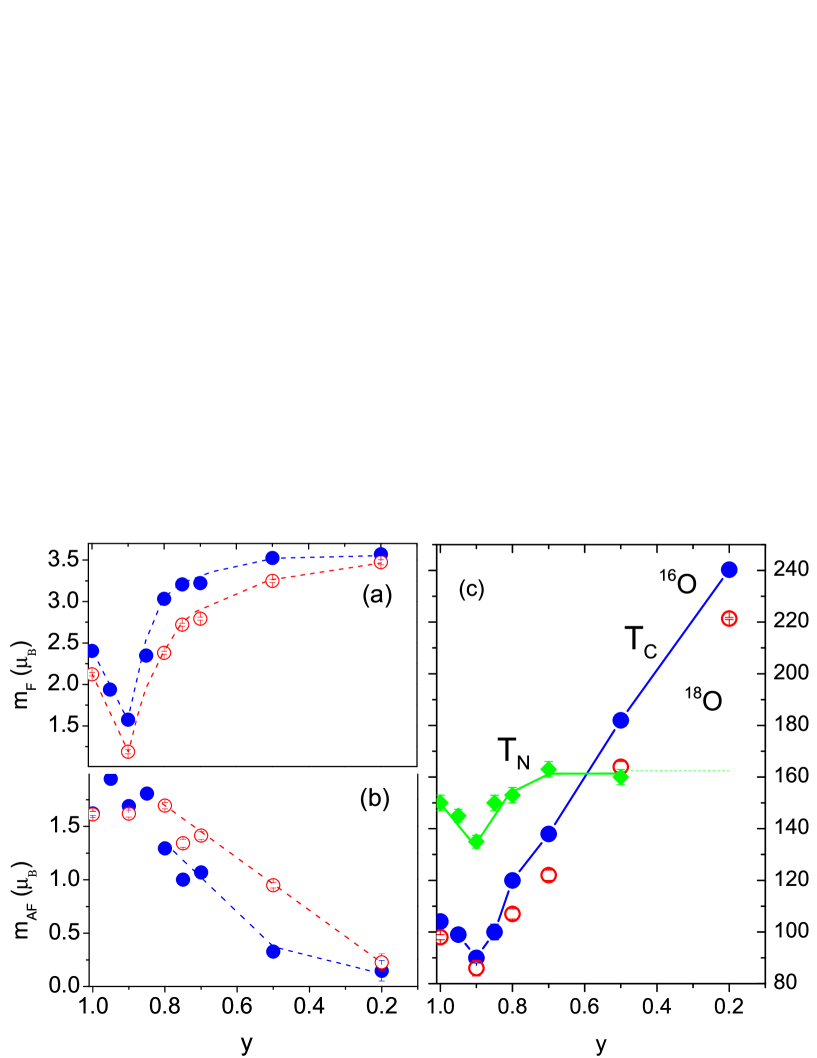
where is a step-like Heaviside function, and are the mean transition temperature and r.m.s. variance, respectively. are are the refinable parameters. For the compositions with the parameters and were fixed as indicated in Table 2. Otherwise, the fit parameters got unreasonable values. To reduce a number of the refined parameters the experimental curves for and -samples were processed in one combined fit with the same parameters , and . The results of the fits of the ferromagnetic to the formula (1) are shown by thick lines in Fig. 11. For comparison, the thin lines for the sample with show the calculated curves deconvoluted from the Gaussian smearing. The magnetic transition temperatures are summarized in the Table 2 and in Fig. 12. The Curie temperatures are in reasonable agreement with the ones determined from the magnetic susceptibility data that are also given in the Table 2. One can see from the Fig. 12 that the isotope substitution has a large effect on the , whereas the Néel temperature is invariant as one would expect for the double exchange type of FM and the superexchange AFM interactions, respectively.
The AFM phase has been detected at all concentrations, including . for the sample with was not determined, because the AF-fraction is very small [the effective AFM moment at K is ] and the temperature scan would require extremely long measurements. For , the AF ordering precedes appearance of the FM phase with the temperature lowering. The FM phase appears spatially separated, reducing the sample volume occupied by the AFM phase and thus reducing the slope of the roughly below . The sizes of the FM- and AFM-domains are mesoscopically large ( Å) estimated in the similar way as described in Ref. Balagurov et al. (2001a). The same effect of phase separation is present for , where (Fig 11a) implying that there are two characteristic energy scales connected with the ferromagnetism. One () is given by the double exchange mechanism with the strong dependence on . The second characteristic temperature is about 130 K where the phase redistribution in favor of the FM state is triggered on.
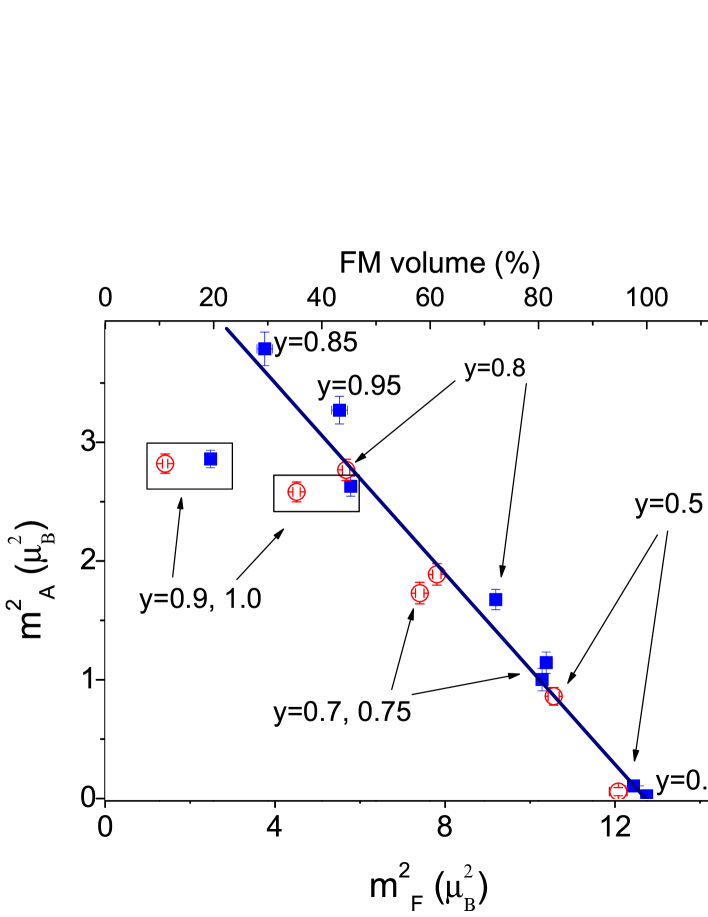
Figure 12 shows the effective FM and AFM magnetic moments of Mn-ions at base temperature (10-15 K) as a function of . is the average value of the moments for two sublattices and presented in Table 2. The effective moment is proportional to the product of the real moment and square root of the volume occupied by the ordered phase. Since the crystal structure is well refined in a single phase approximation one cannot determine from a single diffraction measurement whether the magnetic state is a homogeneous one. However, it becomes possible from the analysis of the values of the effective magnetic moments for all the concentrations for both and -samples. Figure 13 shows for all the samples with the Pr-concentration as a parameter. The line is a least-square fit to the linear function for all except and with . This linear relation is virtually possible only in assumption of the phase separated state. Otherwise, one would have to suppose quite unreasonable sizes of the magnetic moment as a function of and the oxygen mass. This linear function assumes that the magnetic moments in the AFM and FM phases keep the constant values , over the whole phase diagram, but the phase volumes are synchronously redistributed as indicated by top- and right- axes of Fig. 13. The size of the FM moment well corresponds to the average spin value of ions 3.7 , whereas the AFM moment is substantially lower. It can be connected with a “defect” charge ordering that causes a frustration in the magnetic exchange between the neighboring planes. With the help of the Fig. 13 one can disentangle the effect of the FM/AFM volume redistribution (the points slide along the straight line) and the effect of the suppression of the magnetic ordering (the points lay below the line). The increase in the oxygen mass simply shifts the balance between the phases towards the AFM one for the “metallic” part of the phase diagram (), similar as the increase in does, implying that the effect of the isotope substitution is the polaronic narrowing of the bandwidth. The FM phase is metallic and if its volume decreases below the percolation limit % Gor’kov and Kresin (2004) then the sample should become an insulator. In the “insulating” part of the diagram () the system behavior is very different. Firstly, the ferromagnetic phase is not any more metallic because its fraction, e.g. in the sample with is far above a percolation threshold corroborating the insulating character of the FMI phase. Secondly, the increase in the oxygen mass suppresses only the FMI phase, both and the effective magnetic moment, leaving the AFM phase fraction intact. One can speculate that the FMI cannot be converted to the AFM phase because it is already insulating and thus the further decrease in the electron transfer integral doesn’t necessarily shift the system towards the AFM state. We suppose that those spins that stop contributing to the FM phase become disordered thus reducing the effective moment. However we cannot distinguish whether a spatially separated disordered phase is formed or some spins inside the ferromagnetic host get frustrated. The presence of the isotope effect on the FMI is remarkable itself, because it rules out an ordinary superexchange mechanism of FMI. This has been noted in Ref. Fisher et al. (2003) where the isotope effect on was found in insulating , and the genuine FMI state was proposed to appear due to some CO/OO superstructure or density wave giving an energy gap which is much smaller than the Hubbard on-cite repulsion.
III.6 Effect of micro-strains on phase separation
The specific low temperature FM/AFM volume fractions shown in Fig. 13 do not represent themselves universal for LPCM system values that depend only on . Earlier we studied virtually the same series of samples only with (N-series)Balagurov et al. (2001a), but prepared by the different chemical route than the one explained in section II. The phase redistribution process in the N-series samples (Fig. 8 of Ref. Balagurov et al. (2001a)) triggered at about on cooling goes much “easier” leaving predominantly (%) FM ground state for , while in the O-series samples the FM fraction is decreased to 73% for . The increase in the oxygen mass leads to a complete phase volume redistribution in favor of the AFM phase in the N-series sample with Balagurov et al. (1999). In the case of the O-series samples, the phase balance is also definitely shifted towards the AFM state (Fig. 13), but none of the -sample shows purely AFM ground state. We have repeated the oxygen treatment and oxygen isotope exchange with the N-series sample in the same way as we did with the samples of the present O-series, including the back exchange and got essentially the same results as in Babushkina et al. (1998); Balagurov et al. (1999). It is believed that the qualitative difference between the two series originates from smaller grain sizes of the starting reagents in case of the N-series that could give different micro-structure of the sample crystallites. We have undertaken a quantitative micro-structure comparison of two exemplary samples with from each series also using ultra high resolution synchrotron x-ray diffraction (as described in sec. III.2). Both samples are well refined with the close values of structure parameters. The noticeable difference between the samples from the different series is their micro-structure. The insert of Fig. 4 shows the -dependence of the reduced peak broadening in the two samples from both series. One can see that the broadening is larger in the O-series sample. The main contribution to comes from the micro-strain effect amounted to % and % for the N- and O-series sample respectively. Inside the O-series the isotropic micro-strain varies only slightly as shown in the Fig. 10. Thus, the key difference between the two series of the LPCM-samples conditioning their different ground states originates from the different values of motivating to propose that the phase separation is favored by the micro-strains. The value of the micro-strains can be considered as a quantitative measure of the disorder in the crystal lattice. Many studies of the epitaxial films of manganites have demonstrated that the relative fractions of the FM/AFM phases can be strongly modified by both morphology and strains of the films (e.g. Wu et al. (2003)). The strong micro-strain dependence of the phase separated volume fractions in our case suggests that the value of the micro-strains in the bulk material should also be considered as an additional parameter governing the formation of the phase separated state.
III.7 Suppression of ordering near
The Curie temperature is decreased as a function of Pr-concentration due to the smooth decrease in the Mn-O-Mn bond angle (Fig. 6b), but near the critical concentration one can see a local minimum (Fig. 12c), which is unexpected from the behavior of crystal structure parameters. The Néel temperature has a pronounced minimum at , as well. The total volume fraction occupied by both FM and AFM ordered phases decreases by 25% at in comparison with the other samples (Fig. 13). The charge ordering that is concomitant to the antiferromagnetic PCE-type ordering is also suppressed near the critical concentration (section III.4).
The suppression of the magnetic transition temperatures and the ordered phase volumes at strongly resembles the phase diagram calculated in Ref.Burgy et al. (2001). The authors of Ref. Burgy et al. (2001, 2004) have shown that introducing of the quenched disorder into an Ising system with two competing ordered states gives an effect of a suppression of the ordering temperatures and mesoscopic phase separation in the vicinity of the bi-critical point. The experimental situation in our case is more complicated. Instead of two phases there are three distinct phases: AFMI phase and concomitant CO phase, FMM metallic phase for and FMI insulating phase for . The phases, which would correspond to the phases separated by the critical point are the FMM metallic from one side and both FMI and AFM insulating phases from another side of MI transition. In the spirit of the above model one would expect that there is also a phase separation into the FMM and FMI phases near , which are indistinguishable from the present experimental data. The quenched disorder in the LPCM-system is naturally present due the dispersion of the A-cation radius amounting to Å near (this value would nominally correspond to quite large Pr-concentration spread ). However, since the radii of the Pr and Ca ions are almost the same the dispersion limits to zero for , while the phase separated state is still present. The role of the quenched disorder can play the Jahn-Teller strain from centres as proposed in Ref. Argyriou et al. (2004). In addition, the quenched disorder can originate from the chemically inhomogeneous distribution of the A-cations given by the sample preparation procedure.
We cannot exclude also that the lattice distortions and the long-range strain Littlewood (1999); Ahn et al. (2004) can be the reason for the phase separated state. We note that the suppression effect was not found in a detailed study of similar system Blake et al. (2002), where all transition temperatures were continuous through the critical point. The later system has almost the same average A-cation radius but much larger ( times) variance , which could be a possible reason of the different behavior. We suppose that to compare the different manganite systems with respect to the effect of the suppression of the ordering near one should also compare the extent of quenched disorder, which can be quantitatively characterized by the value of the isotropic micro-strains.
IV Conclusions
The magnetic and crystal structures have been studied in the series of samples as a function of the Pr-concentration ( 0.2, 0.5, 0.7, 0.75, 0.8, 0.85, 0.9, 0.95, 1.0) across the metal-insulator (MI) transition around and as a function of the oxygen mass (, ). The ground magnetic state is mesoscopically separated into antiferromagnetic insulating (AFM) and ferromagnetic (FM) phases for all values of . The ordered magnetic moments of the Mn-ions keep the constant values , over the whole phase diagram, whereas the phase fractions are changing as a function of . The conductivity in the “metallic” part of the phase diagram () is metallic because the FM phase is metallic and its fraction is above the percolation threshold. In the “insulating” domain () the fraction of the FM phase is significantly above the percolation threshold (e.g. for it amounts to 46%) implying that the FM phase is insulating for .
The increase in the oxygen mass has effect on both the values of and the phase fractions. The Curie temperatures of both metallic and insulating FM phases are decreasing in a similar way suggesting that the origin of the ferromagnetism in the insulating state should be connected with a slow electron hopping process similar to the double exchange as discussed in Fisher et al. (2003). The Néel temperature is not affected by the oxygen mass as expected for the AFM superexchange. The increase in the oxygen mass always suppress the FM phase fraction. However, the effect is different for the metallic and insulating FM phase. For , the oxygen substitution acts similar to the increase in , namely the FM phase volume fraction is decreased by the same amount as the AFM volume fraction is increased. For the ferromagnetic insulating phase is suppressed but the AFM phase is not changed at all. Thus, the narrowing of the bandwidth due to the decrease in the A-cation radius and the polaronic narrowing act very differently in the “insulating” part of the phase diagram.
The ratio between the AFM and FM phase fractions is not uniquely a function of the effective bandwidth given by and the oxygen mass, but is also affected by the value of internal micro-strains that favor the formation of the phase separated state. We propose that the value of the micro-strains can be used as a universal quantity characterizing the extent of the quenched disorder, which can have different origins in the manganites.
The phase diagram of has a critical concentration at , where both Néel and Curie transition temperatures, the ordered phase volumes as well as the charge ordering concomitant to the AFM phase are suppressed. This finding together with the presence of the phase separated state strongly support the theoretical study of the competition between two ordered states in the presence of quenched disorderBurgy et al. (2001, 2004), implying that the quenched disorder plays a key role in the formation of the phase inhomogeneous state in manganites.
Acknowledgements
This study was partially performed at Swiss neutron spallation SINQ and Swiss light source SLS of Paul Scherrer Institute PSI (Villigen, PSI). We acknowledge A. Kaul, O. Gorbenko and N. Babushkina for granting us the sample LPCM75 we used in our previous study Balagurov et al. (1999); Balagurov et al. (2001a, b), L. Keller for the help in neutron diffraction measurements. We thank V. Kabanov for the helpful discussions. The study was supported by the RFBR (grant N06-02-16032).
References
- Zhao et al. (1996) G. M. Zhao, K. Conder, H. Keller, and K. A. Muller, Nature 381, 676 (1996).
- Zhao et al. (1997) G. M. Zhao, H. Keller, J. Hofer, A. Shengelaya, and K. A. Muller, Solid State Comm. 104, 57 (1997).
- Babushkina et al. (1998) N. A. Babushkina, L. M. Belova, O. Y. Gorbenko, A. R. Kaul, A. A. Bosak, V. I. Ozhogin, and K. I. Kugel, Nature 391, 159 (1998).
- Gor’kov and Kresin (2004) L. P. Gor’kov and V. Z. Kresin, Phys. Rep. 400, 149 (2004).
- Hwang et al. (1995) H. Y. Hwang, S. W. Cheong, P. G. Radaelli, M. Marezio, and B. Batlogg, Phys. Rev. Lett. 75, 914 (1995).
- Babushkina et al. (1999) N. A. Babushkina, L. M. Belova, A. N. Taldenkov, E. A. Chistotina, D. I. Khomskii, K. I. Kugel, O. Y. Gorbenko, and A. R. Kaul, J. Phys.-Cond. Matt 11, 5865 (1999).
- Wollan and Koehler (1955) E. O. Wollan and W. C. Koehler, Phys. Rev. 100, 545 (1955).
- Huang et al. (1998) Q. Huang, A. Santoro, J. W. Lynn, R. W. Erwin, J. A. Borchers, J. L. Peng, K. Ghosh, and R. L. Greene, Phys. Rev. B 58, 2684 (1998).
- Cox et al. (1998) D. E. Cox, P. G. Radaelli, M. Marezio, and S. W. Cheong, Phys. Rev. B 57, 3305 (1998).
- Balagurov et al. (2001a) A. M. Balagurov, V. Y. Pomjakushin, D. V. Sheptyakov, V. L. Aksenov, P. Fischer, L. Keller, O. Y. Gorbenko, A. R. Kaul, and N. A. Babushkina, Phys. Rev. B 64, 024420 (2001a).
- Fisher et al. (2003) L. M. Fisher, A. V. Kalinov, I. F. Voloshin, N. A. Babushkina, K. I. Kugel, and D. I. Khomskii, Phys. Rev. B 68, 174403 (2003).
- Papavassiliou et al. (2003) G. Papavassiliou, M. Pissas, M. Belesi, M. Fardis, J. Dolinsek, C. Dimitropoulos, and J. P. Ansermet, Phys. Rev. Lett. 91, 147205 (2003).
- Kajimoto et al. (2004) R. Kajimoto, H. Mochizuki, H. Yoshizawa, S. Okamoto, and S. Ishihara, Phys. Rev. B 69, 054433 (2004).
- Pissas et al. (2005) M. Pissas, I. Margiolaki, G. Papavassiliou, D. Stamopoulos, and D. Argyriou, Phys. Rev. B 72, 064425 (2005).
- Balagurov et al. (1999) A. M. Balagurov, V. Y. Pomjakushin, D. V. Sheptyakov, V. L. Aksenov, N. A. Babushkina, L. M. Belova, A. H. Taldenkov, A. V. Inyushkin, P. Fischer, M. Gutmann, et al., Phys. Rev. B 60, 383 (1999).
- Tokunaga et al. (2004) M. Tokunaga, Y. Tokunaga, and T. Tamegai, Phys. Rev. Lett. 93, 037203 (2004).
- Uehara et al. (1999) M. Uehara, S. Mori, C. H. Chen, and S. W. Cheong, Nature 399, 560 (1999).
- Littlewood (1999) P. Littlewood, Nature 399, 529 (1999).
- Burgy et al. (2001) J. Burgy, M. Mayr, V. Martin-Mayor, A. Moreo, and E. Dagotto, Phys. Rev. Lett. 87, 277202 (2001).
- Burgy et al. (2004) J. Burgy, A. Moreo, and E. Dagotto, Phys. Rev. Lett. 92, 097202 (2004).
- Alonso et al. (2002) J. L. Alonso, L. A. Fernandez, F. Guinea, V. Laliena, and V. Martin-Mayor, Phys. Rev. B 66, 104430 (2002).
- Blake et al. (2002) G. R. Blake, L. Chapon, P. G. Radaelli, D. N. Argyriou, M. J. Gutmann, and J. F. Mitchell, Phys. Rev. B 66, 144412 (2002).
- Akahoshi et al. (2003) D. Akahoshi, M. Uchida, Y. Tomioka, T. Arima, Y. Matsui, and Y. Tokura, Phys. Rev. Lett. 90, 177203 (2003).
- De Teresa et al. (2005) J. M. De Teresa, P. A. Algarabel, C. Ritter, J. Blasco, M. R. Ibarra, L. Morellon, J. I. Espeso, and J. C. Gómez-Sal, Phys. Rev. Lett. 94, 207205 (2005).
- Ahn et al. (2004) K. H. Ahn, T. Lookman, and A. R. Bishop, Nature (London) 428, 401 (2004).
- Podzorov et al. (2001) V. Podzorov, B. G. Kim, V. Kiryukhin, M. E. Gershenson, and S. W. Cheong, Phys. Rev. B 64, 140406(R) (2001).
- Sharma et al. (2005) P. A. Sharma, S. B. Kim, T. Y. Koo, S. Guha, and S. W. Cheong, Phys. Rev. B 71, 224416 (2005).
- Conder et al. (2002) K. Conder, G. M. Zhao, and R. Khasanov, Phys. Rev. B 66, 212409 (2002).
- Balagurov et al. (2001b) A. M. Balagurov, V. Y. Pomjakushin, D. V. Sheptyakov, V. L. Aksenov, N. A. Babushkina, L. M. Belova, O. Y. Gorbenko, and A. R. Kaul, Eur. Phys. J. B 19, 215 (2001b).
- Fischer et al. (2000a) P. Fischer, G. Frey, M. Koch, M. Koennecke, V. Pomjakushin, J. Schefer, R. Thut, N. Schlumpf, R. Buerge, U. Greuter, et al., Physica B 276-278, 146 (2000a).
- Fischer et al. (2000b) P. Fischer, L. Keller, J. Schefer, and J. Kohlbrecher, Neutron News 11, 19 (2000b).
- Rodriguez-Carvajal (1993) J. Rodriguez-Carvajal, Physica B 192, 55 (1993).
- Franck et al. (2002) J. P. Franck, I. Isaac, G. Zhang, J. E. Gordon, C. Marcenat, R. Lortz, C. Meingast, F. Bouquet, R. A. Fisher, and N. E. Phillips, Journal of Superconductivity 15, 571 (2002).
- De Teresa et al. (1997) J. M. De Teresa, M. R. Ibarra, P. A. Algarabel, C. Ritter, C. Marquina, J. Blasco, J. Garcia, A. D. Moral, and Z. Arnold, Nature 386, 256 (1997).
- Balagurov et al. (2005) A. M. Balagurov, I. A. Bobrikov, V. Y. Pomyakushin, D. V. Sheptyakov, N. A. Babushkina, O. Y. Gorbenko, M. S. Kartavtseva, and A. R. Kaul’, JETP Lett. 82, 594 (2005).
- Lovesey (1987) S. W. Lovesey, Theory of neutron Scattering from Condensed matter (Oxford Univ. Press, 1987), vol. 1, p. 112.
- Thompson et al. (1987) P. Thompson, D. E. Cox, and J. B. Hastings, J. Appl. Cryst. 20, 79 (1987).
- Stephens (1999) P. W. Stephens, J. Appl. Cryst. 32, 281 (1999).
- Rodriguez-Carvajal et al. (1998) J. Rodriguez-Carvajal, M. Hennion, F. Moussa, A. H. Moudden, L. Pinsard, and A. Revcolevschi, Phys. Rev. B 57, R3189 (1998).
- Favre-Nicolin and Cerny (2002) V. Favre-Nicolin and R. Cerny, Journal of Applied Crystallography 35, 734 (2002).
- Glazer (1975) A. M. Glazer, Acta Crystallographica A 31, 756 (1975).
- Kanamori (1960) J. Kanamori, J. Appl. Phys. 31, S14 (1960).
- Radaelli et al. (1997) P. G. Radaelli, D. E. Cox, M. Marezio, and S. W. Cheong, Phys. Rev. B 55, 3015 (1997).
- Wu et al. (2003) T. Wu, S. B. Ogale, S. R. Shinde, A. Biswas, T. Polletto, R. L. Greene, T. Venkatesan, and A. J. Millis, J. Appl. Phys. 93, 5507 (2003).
- Argyriou et al. (2004) D. N. Argyriou, U. Ruett, C. P. Adams, J. W. Lynn, and J. F. Mitchell, New Journal of Physics 6, 195 (2004).
| Oxygen | ND; | ||||||||
| 0.2 | - | 240.3(1); | 236(2) | 0111fixed | 0.06(18) | 0.23(5) | 3.57(2) | 011footnotemark: 1 | |
| 0.2 | - | 221.4(4); | 224(2) | 011footnotemark: 1 | 0.23(8) | 0.26(7) | 3.46(3) | 011footnotemark: 1 | |
| 0.5 | 160(3) | 183(2); | 180(2) | 14(2) | 0.36(5) | 0.29(7) | 3.53(2) | 011footnotemark: 1 | |
| 0.5 | 160(3) | 164(2); | 155(2) | 19(2) | 0.95(3) | 0.91(4) | 3.25(2) | 011footnotemark: 1 | |
| 222a=2 and b=0.66 are fixed in formula (1) | 0.7 | 163(3) | 138(2); | 122(2) | 30(3) | 1.11(5) | 1.03(4) | 3.22(2) | 0.48(2) |
| 22footnotemark: 2 | 0.7 | 163(3) | 122(2); | 116(2) | 29(3) | 1.41(4) | 1.33(3) | 2.79(2) | 0.64(3) |
| 0.75 | - | - ; | 122(2) | - | 1.03(5) | 0.97(5) | 3.21(2) | 0.52(2) | |
| 0.75 | - | - ; | 116(2) | - | 1.34(4) | 1.29(3) | 2.72(2) | 0.63(3) | |
| 22footnotemark: 2 | 0.8 | 153(3) | 120(1); | 120(2) | 23(2) | 1.30(4) | 1.28(3) | 3.03(2) | 0.49(2) |
| 22footnotemark: 2 | 0.8 | 153(3) | 107(2); | 114(2) | 16(3) | 1.63(3) | 1.66(2) | 2.38(2) | 0.57(3) |
| 22footnotemark: 2 | 0.85 | 150(3) | 100(3); | 116(2) | 35(4) | 1.82(3) | 1.79(3) | 2.34(4) | 0.35(6) |
| 22footnotemark: 2 | 0.9 | 135(3) | 90(2); | 99(2) | 21(3) | 1.63(3) | 1.75(2) | 1.58(2) | 0.39(3) |
| 22footnotemark: 2 | 0.9 | 135(3) | 86(3); | 94(2) | 17(4) | 1.62(3) | 1.74(2) | 1.19(3) | 0.63(4) |
| 22footnotemark: 2 | 0.95 | 145(3) | 99.0(9); | 117(2) | 17(1) | 1.96(3) | 1.93(4) | 1.94(5) | 0.39(7) |
| 22footnotemark: 2 | 1.0 | 150(3) | 104.1(8); | 120(2) | 14(2) | 1.63(3) | 1.61(3) | 2.40(2) | 0.53(2) |
| 22footnotemark: 2 | 1.0 | 150(3) | 98(1); | 115(2) | 15(2) | 1.62(3) | 1.60(3) | 2.12(2) | 0.61(2) |