Place Eugène Bataillon, 34095 Montpellier Cedex 5, France
Stress transmission in wet granular materials
Abstract
We analyze stress transmission in wet granular media in the pendular state by means of three-dimensional molecular dynamics simulations. We show that the tensile action of capillary bonds induces a self-stressed particle network organized in two percolating “phases” of positive and negative particle pressures. Various statistical descriptors of the microstructure and bond force network are used to characterize this partition. Two basic properties emerge: 1) The highest particle pressure is located in the bulk of each phase; 2) The lowest pressure level occurs at the interface between the two phases, involving also the largest connectivity of the particles via tensile and compressive bonds. When a confining pressure is applied, the number of tensile bonds falls off and the negative phase breaks into aggregates and isolated sites.
pacs:
45.70.-nGranular Systems and 83.80.FgGranular solids1 Introduction
The particle-scale origins of the strength and flow properties of dry granular materials has been a subject of intensive research since several decades. It is now generally admitted that the scale-up of particle interactions to the macroscopic scale is more subtle than initially expected because of mediation by a disordered microstructure with a rich statistical behavior Herrmann98 ; Roux01 . Considerable work has thus been devoted to characterize the microstructure and its manifestations in the form of highly inhomogeneous distributions of interparticle forces and fluctuating particle velocities Oda72 ; Christoffersen81 ; Rothenburg89 ; Jaeger96 ; Calvetti97 ; Mueth98 ; Kuhn99 ; Roux00 ; Troadec02 ; Radjai02 ; Yang02 . The bimodal character of the force network Radjai98 , exponential probability functions of strong forces (force chains) Coppersmith96 ; Radjai96 ; Mueth98 ; Majmudar05 , and clustering of dissipative contacts are recent examples of this non trivial phenomenology Staron02 . Insightful analogies have also emerged with other fields such as jamming transition in colloidal matter Cates98 ; Liu01 ; Dauchot05 ; Corwin05 , slow relaxation in glassy materials Knight95 , and fluid turbulence Radjai02 .
Most of our present knowledge on the subject excludes, however, cohesive bonding between particles. Although one expects strong similarities due to the common granular microstructure, the presence of cohesion brings about new mechanisms that tend to transform the nature of the problem. At the macroscopic scale, the shear strength needs to be described in terms of the Coulomb cohesion in addition to the internal angle friction Wood90 . On the other hand, the interplay between cohesive bonds, friction and rotation frustration of the particles leads to novel features such as particle aggregation that control static and dynamic properties of the material Castellanos01 ; Fillot06 . A well-known example is the wet sand where small amounts of water affect significantly the bulk behavior Hornbaker97 ; Halsey98 ; Richefeu06 . The phenomena arising from cohesion are of particular interest to the processing (compaction, granulation…) of fine powders Reynolds04 ; Castellanos05 . It seems thus that a systematic investigation of the microstructure in cohesive granular media should open new scopes for modeling granular materials.
In this paper, we analyze the force network in wet granular assemblies of spherical particles. We are interested in a basic question: how cohesive grains keep together to form a self-sustained structure in the absence of confinement (no container and no confining stresses)? The packing can reach an equilibrium state as a result of attraction forces and elastic repulsion between particles without or with self-stressed structures. While the particles are balanced in both cases, the attraction force at each contact is exactly balanced by an elastic repulsion force in the first case. In contrast, in the second case all contacts are not in their equilibrium state due to steric hinderance between particles. Hence, a network of tensile and compressive forces is formed inside the packing. These self-equilibrated forces can be induced through various loading histories such as consolidation Preecha02 ; Radjai01 or differential particle swelling ElYous05 . In wet granular media in the pendular state, the self-stresses appear naturally due to the tensile action of capillary bonds bridging the gaps between neighboring particles within a debonding distance. We focus in this paper on the structure of these self-stresses induced by capillary bonds.
We use 3D molecular dynamics method in which capillary attraction between spherical particles is implemented as a force law expressing the capillary force as a function of the distance, water volume, and particle diameters. The total water volume is distributed homogeneously between particles. The packing is analyzed at equilibrium under zero confining pressure. The main goal of our analysis is to characterize the organization of particle pressures which take positive or negative values according to their positions in the network of self-equilibrated bond forces. We will see that this organization involves a genuin partition of the particles in two phases of negative and positive pressures. In the following, we first describe the simulation method and our model of capillary cohesion. In Sections 3 and 4, we study in detail the probability density functions of the forces and the connectivity of particles via tensile and compressive bonds. Then, in Sections 5 and 6 we introduce particle stresses and we analyze their distribution and correlation with the connectivity of the particles. Section 7 is devoted to the influence of external pressure. We conclude with a discussion about the main findings of this work.
2 Numerical method
We used the molecular dynamics (MD) method with a velocity Verlet integration scheme Cundall79 ; Allen87 . The force laws involve normal repulsion, capillary cohesion, Coulomb friction, and normal damping. The normal force has three different sources,
| (1) |
The first term is the repulsive contact force depending linearly on the normal distance between the particles (Fig 1(a)):
| (2) |
where is the normal stiffness. The second term represents a viscous damping force depending on the normal velocity :
| (3) |
where is the reduced mass of the particles and , is a damping rate varying in the range and that accounts for the rate of normal dissipation or the restitution coefficient between particles Shafer96 .
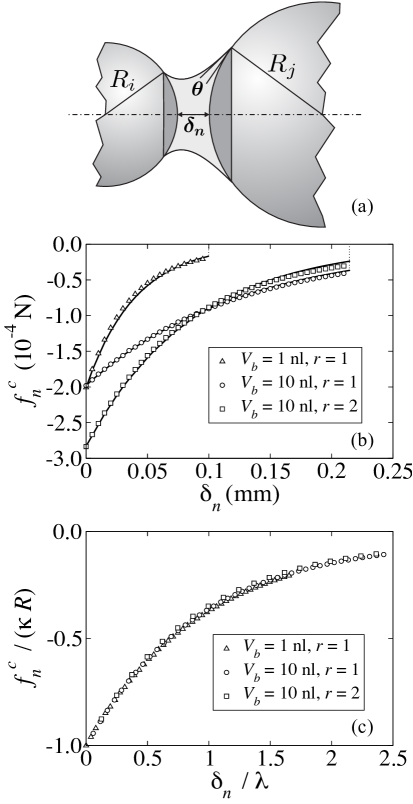
The last term in Eq. 1 is the capillary force depending on the liquid bond parameters, namely the gap , the liquid bond volume , the liquid surface tension , and the particle-liquid-gas contact angle . The capillary force can be obtained by integrating the Laplace-Young equation Erle71 ; Lian93 ; Mikami98 ; Soulie06 . However, for molecular dynamics simulations, we need an explicit expression of as a function of the liquid bond parameters. We propose the following simple form:
| (4) |
where is the geometrical mean of particle radii, and is a length scale to be discussed below. The prefactor is given by Willett00 ; Bocquet02 ; Herminghaus05
| (5) |
and is the debonding distance given by Lian98
| (6) |
The capillary bridge is stable as long as . In the simulations, the bridge is removed as soon as the debonding distance is reached, and the liquid is redistributed among the contacts belonging to the same particle in proportion to grain sizes Richefeu06 . At contact (), corresponds to the largest attraction force between two particles. In the simulations presented in this paper, we assume that particles are perfectly wettable, i.e. . This is a good approximation for water and glass beads.
The length governs the exponential falloff of the capillary force in Eq. 4. It should depend on the liquid volume , a mean radius , and the ratio . A reasonable choice is
| (7) |
where is a constant prefactor, is a function depending on the ratio , and is the harmonic mean (). When introduced in Eqs. 7 and 4, this form yields a nice fit for the capillary force obtained from direct integration of the Laplace-Young equation by simply setting and . Fig. 1(b) shows the plots of Eq. 4 for different values of the liquid volume and size ratio together with the corresponding data from direct integration. The fit is excellent for (at contact) and for small gaps.
Figure 1(c) shows the same plots of the direct data as in Fig. 1(b) but in dimensionless units where the forces are normalized by and the lengths by . We see that the data collapse indeed on the same plot, indicating again that the force and the expression of in Eq. 7 characterize correctly the behavior of the capillary bridge for . From the same data, we also checked that the geometric mean introduced in Eq. 4 provides a better fit than the harmonic mean proposed by Derjaguin for polydisperse particles in the limit of small gaps Israelachvili92 .
For the friction force , we used a viscous-regularized Coulomb law Shafer96 ; Dippel97 ; Luding98
| (8) |
where is a tangential viscosity parameter, is the coefficient of friction, and is the sliding velocity. In relaxation to equilibrium, declines but never vanishes due to residual kinetic energy. The equilibrium state is practically reached as soon as we have at all contacts. This means that the friction force is inside the Coulomb cone everywhere in the system.
| Parameter | Symbol | Value | Unit |
|---|---|---|---|
| Normal stiffness | N/m | ||
| Damping rate | - | ||
| Tangential viscosity | Ns/m | ||
| Capillary force prefactor | N/m | ||
| Gravimetric water content | - | ||
| Liquid density | kg.m-3 | ||
| Particle density | kg.m-3 | ||
| Friction coefficient | - | ||
| Time step | s |
The simulations were performed with a packing composed of spheres with diameters , , and mm, in equal numbers. The system was subjected to an isotropic pressure via six rigid walls and no gravity in order to obtain an as homogeneous state as possible. For the same reason, the friction with the walls was set to zero although wall effects can not be fully removed. The parameters used in the simulations are displayed in Table 1. The choice of the water volume has no influence on the value of the largest capillary force in the pendular state. We also note that the liquid bonds are homogeneously distributed into all gaps within the debonding distance Richefeu05b . With a gravimetric water content of , the coordination number is . Experiments show that the distribution of liquid bonds depends on the preparation protocol involving the water volume, mixing procedure, and waiting times Fournier05 ; Richefeu06 .
3 Force distributions
We start out by considering force distributions first in a system subjected to a negligibly small average compressive stress Pa. Fig. 2 displays the probability density function (pdf) of the normal forces both in tensile (negative) and compressive (positive) ranges. We observe a distinct peak centered on and two nearly symmetrical parts decaying exponentially from the center:
| (9) |
with within statistical precision for both negative and positive forces, and , where is the largest particle radius. It has been observed that in dry granular media the distribution is not purely exponential in the whole range of bond forces Radjai96 ; Mueth98 ; Majmudar05 ; vanHecke05 . Below the average force, the distribution tends to be uniform or a decreasing power law with a weak exponent Radjai99 . In the present case of wet cohesive materials, the exponential behavior extends to the center of the distribution. It is important to remark that this peak does not represent non-transmitting contacts. It rather corresponds to contacts where capillary attraction is balanced by elastic repulsion, i.e. . We will see below that this peak persists under the action of a compressive confining stress, suggesting that its presence reflects a feature of force transmission in wet granular materials.

The tensile range is cut off at corresponding to the largest capillary force. Although the confining stress is zero, positive forces as large as can be found in the system. In contrast to dry granular materials, the pdf shows a peak at which is the average force in the present case. In fact, in an unconfined assembly of dry rigid particles, no self-stresses appear and the forces vanish at all contacts. In our wet material, the presence of liquid bonds induces tensile and compressive self-stresses although the average force is zero.
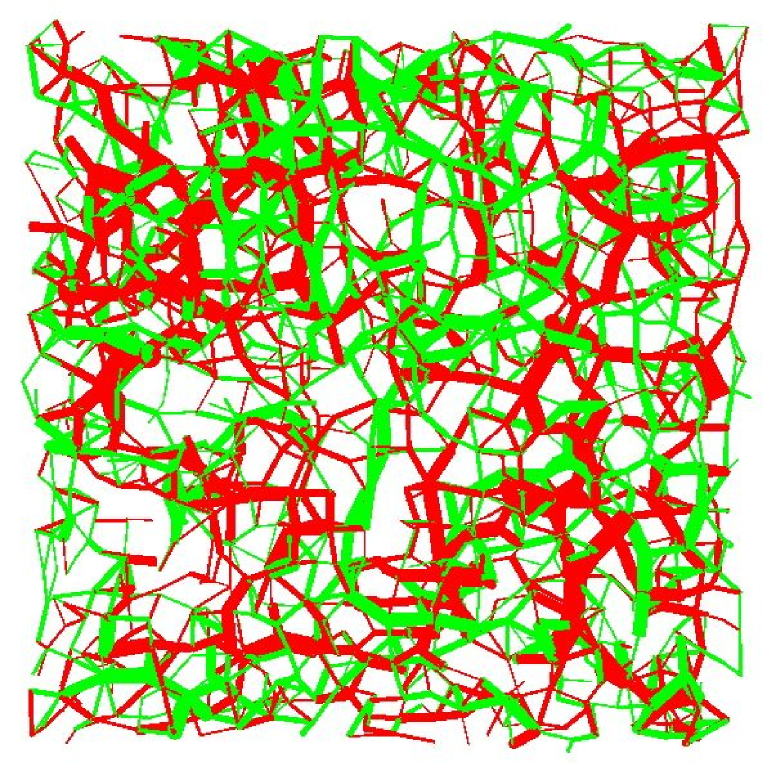
Figure 3 shows the force network in a narrow slice nearly three particle diameters thick. The tensile and compressive forces are represented by segments of different colors joining particle centers. The line thickness is proportional to the force. It is remarkable that tensile and compressive force chains can be observed although the slice is quite narrow. The bond coordination number (average number of bonds per particle) is including nearly compressive bonds and tensile bonds.
4 Connectivity of the bond network
We analyze the connectivity of the particles via capillary bonds by considering the fraction of particles with exactly compressive bonds and tensile bonds. This function is displayed in Fig. 4 as grey level map in the parameter space for our system. The map is symmetric with respect to the line , reflecting thus the symmetrical roles of compressive and tensile networks in the absence of confining stresses. A peak value of occurs at . Obviously, the condition of particle equilibrium cannot be fulfilled with and and the corresponding levels are zero on the map. The particles with and define chains of compressive bonds whereas particles with and correspond to chains of tensile bonds. But such “pure” chains are rare. At larger values of and the fractions decline basically due to geometrical hinderance between particles.
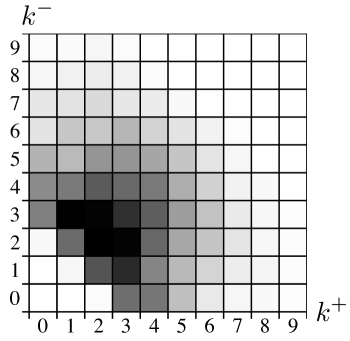
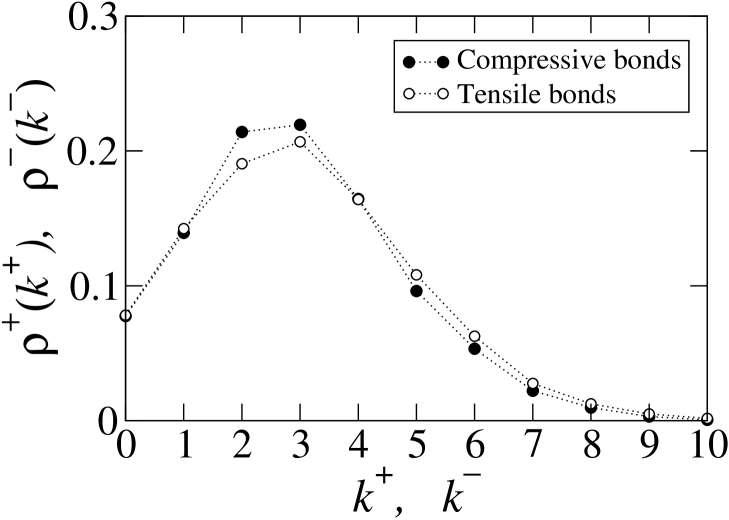
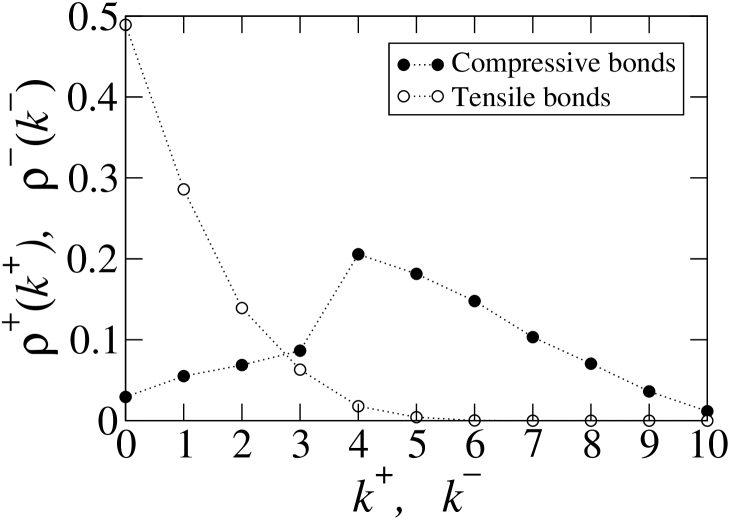
An interesting feature of the connectivity map (Fig. 4) is the existence of a population of particles involving no tensile bonds (the row ) as well as a population of particles involving no compressive bonds (the column ). Reduced connectivity functions and can be defined by summing up the function along columns and rows, respectively:
| (10) |
The plots of these functions are shown in Fig. 5. They nearly coincide as expected from the symmetry observed in Fig. 4. We have , corresponding respectively to particles in purely extensional or compressional local environments. A maximum occurs at or .
5 Particle stresses
Until now, we focussed on forces and their distributions with regard to the tensile or compressive nature of the bonds. For the description of stress transmission in our system we need, however, to characterize the inhomogeneities at the scale of particles representing the smallest entities for which the equations of motion are resolved in MD simulations. At this scale, a Cauchy stress in the sense of continuous media cannot be defined. But, it can be shown that the so-called internal moment tensor has the same properties as the Cauchy stress tensor , and its definition extends mathematically to discrete media at all scales down to the particle scale Moreau97 ; Staron05 . For a particle subjected to forces from its contact neighbors at the contact points , the internal moment tensor is given by Moreau97
| (11) |
where designs a tensorial product. The internal moment tensor is additive and independent of the origin of the coordinate frame. For a collection of particles in a control volume , the total internal moment is simply the sum of the particle moments:
| (12) |
This tensor has the dimension of a moment and it becomes homogeneous to a stress when divided by the control volume:
| (13) |
At large scales (containing a sufficiently large number of particles), the volume is well-defined and the stress tensor is equivalent to the internal moment tensor divided by this volume. However, at the particle scale, while is defined in a unique way, the choice of the volume is a matter of convenience. It is reasonable to take into account the free volume of each particle , as the sum of the volume of the particle and part of the surrounding pore space. On average, we have , where is the particle diameter and denotes the packing fraction. With this choice, the particle stress tensor takes the following form:
| (14) |
Remark that when summing this form over many particles in a control volume as in Eq. 13, each contact enters the summation two times, belonging once to particle and once to particle . Since , the contribution of the contact to stress is , a writing that involves the center-to-center vector instead of position vectors of the contact points if the origin of coordinates for each particle is chosen coincides with the center of the particle. However, we consider here only the particle stress, and at this scale, according to Eq. 14, only the position vectors of contact points are involved.

Here, we explore the particle pressures (average particle stresses) . Each particle can take on positive or negative pressures according to the nature of the forces exerted by contact neighbors. The pdf of particle pressures is displayed in Fig. 6. The pressures have been normalized by a reference pressure . The distribution is symmetric around and peaked on zero pressure, and each part is well fit by an exponential form. Obviously, the exponential shape of particle pressure distributions reflects statistically that of bond forces. In dry granular media, since the normal forces are all of the same sign (compressive) and particle pressure results from the summation of individual bond forces on a particle, the probability is expected to vanish as the pressure goes to zero. In contrast, Fig. 6 shows that the exponential shape of particle pressure distribution extends to the center of the pdf. This can be related to the fact that all normal forces are not of the same sign. On the other hand, the zero pressure corresponds to a state where a particle is balanced under the combined action of tensile and compressive forces. Since such particle states are not marginal here, they might reflect a particular organization of the stresses in the wet packing (see below).
6 Partition of particle pressures
An interesting observation about the connectivity map (Fig. 4) was the presence of particles with only tensile or only compressive bonds. In terms of particle pressures, these populations carry negative or positive pressures, respectively. However, this information is not rich enough as it does not specify the pressure levels in these populations. The question is how the particle pressure is locally correlated with the particle connectivity. For particle , the connectivity is specified by the number of compressive bonds and the number of tensile bonds. Let us now consider the set of particles such that and . The partial pressure carried by this set is the sum of particle pressures in this set divided by the total number of particles:
| (15) |
This is obviously an additive quantity so that the average stress . The function provides detailed information about the way particle pressures are distributed with respect to the bond network. In other words, this function describes the relationship between the pressure sustained by a particle and its first neighbors with which it is bonded.
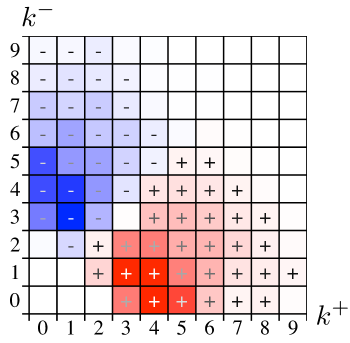
Figure 7 shows the map of partial pressures in the parameter space . Interestingly, we observe a bipolar structure of partial pressures which is antisymmetric with respect to the line within statistical precision. The pressures are positive in the range and negative in the range . Hence, the line defines the transition zone between the two parts with . This line corresponds to the largest population of particles according to the connectivity map (Fig. 4). The pressure extrema are located at for positive pressures and at for negative pressures.
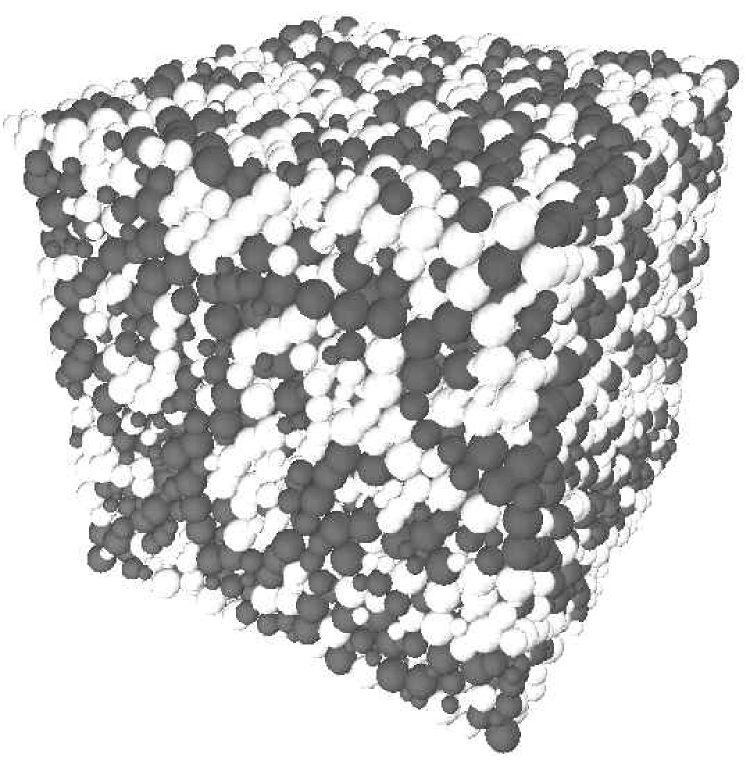
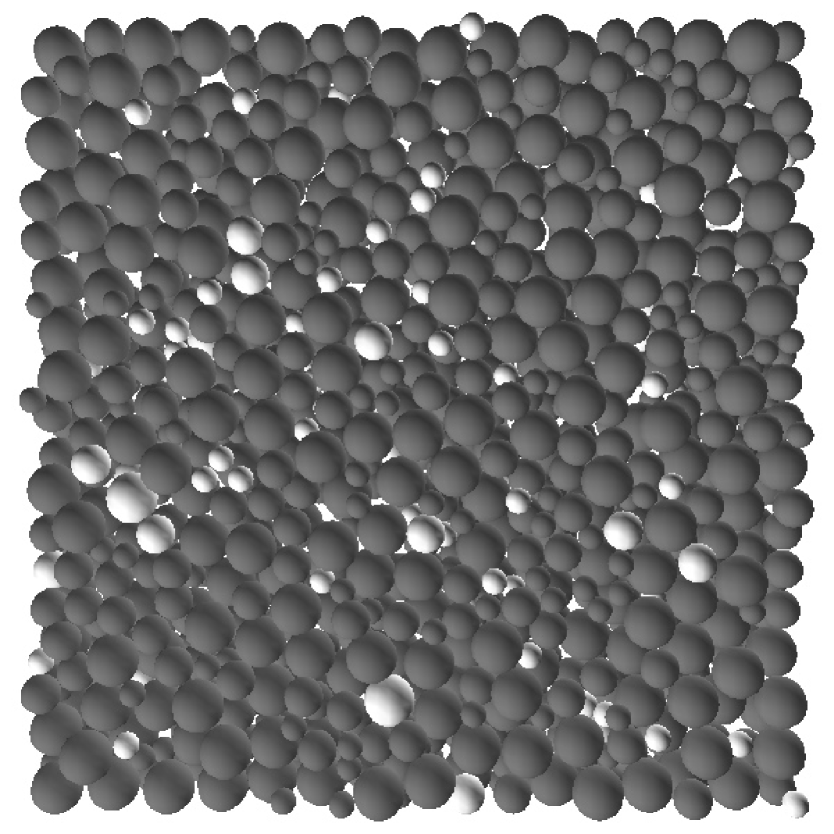
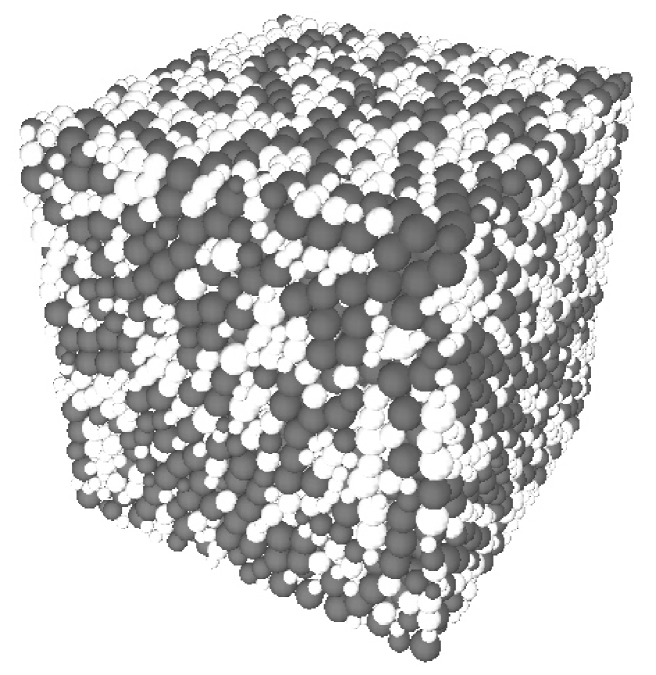
The bipolar structure of the pressure map suggests that the particles of positive and negative pressures define two separate phases throughout the system. In this picture, the population of particles along the line corresponds to the particles at the interface between the two phases. This interpretation is backed by Fig. 8 displaying the packing where the two phases are represented in black and white. The particles of either positive or negative pressure percolate throughout the system. The two phases are intimately intermingled with a large interface between them. The particles at the interface belong to the line corresponding to a fraction of particles. The morphology of the two phases is approximately filamentary with variable thickness.
The correlation between the bond connectivity and particle pressures can alternatively be determined by considering the average numbers of tensile and compressive bonds per particle, denoted and , as a function of the particle pressure . In order to evaluate these functions, we consider the set of particles with a pressure in the range , where is the pressure increment. The partial coordination numbers and are defined by
| (16) |
where is the number of particles in the set. These functions are plotted in Fig. 9 in the case . The plot of is an approximate mirror image of with respect to . Three zones can be discerned. For , we have and . This zone represents mainly the particles belonging to the bulk of the negative phase. For , we have and . The particles in this zone belong to the bulk of the positive phase. In the range , increases and declines. The intersection occurs at where . This zone corresponds to the particles located at the interface between negative and positive phases.
The above findings underline that stress transmission in wet granular media is non trivial. In particular, they support the partition of the packing into two well-defined phases both in terms of particle connectivities and in terms of particle pressures. The peculiarity of this partition is that the extrema of particle pressures are located in the bulk of each phase (Fig. 4) whereas the maximum of connectivity between particles via tensile and compressive bonds resides at their interface (Fig. 7). Along this interface, not only the bond forces are balanced on each particle, as everywhere in the packing, but the tensile and compressive bonds contribute equally in such a manner that the particle pressures are extremely low.
7 Influence of confining pressure
In the absence of a confining stress, the capillary bonds are at the origin of self-stresses or self-equilibrated forces that we analyzed in preceding sections. Hence, the observed symmetry between tensile and compressive bonds is a consequence of static equilibrium at zero confining stress. The question remains whether the partition of particle pressures, as depicted above, still holds when a wet packing is subjected to (compressive) confining stress. In practice, however, we cannot isolate self-equilibrated forces for each particle from those induced by the external stress (the actual force network being the sum of the two networks). This is because the external pressure drives the packing to a new equilibrium state with modified microstructure. Hence, the self-stresses for , i.e. before rearrangements, do not correspond to the rearranged state for . While it can be conjectured that the self-stresses in the presence of a confining pressure will display the same “bipolar” behavior as for , we consider here the force network and particle pressures without distinction between induced and self-equilibrated forces.
We applied an isotropic stress Pa to the wet packing prepared with . The packing was then allowed to relax to equilibrium under the action of the applied pressure. This level of confinement is high compared to the reference pressure (), yet not too high to mask fully the manifestations of capillary cohesion. The same packing was also compressed isotropically for Pa without capillary cohesion (dry packing).
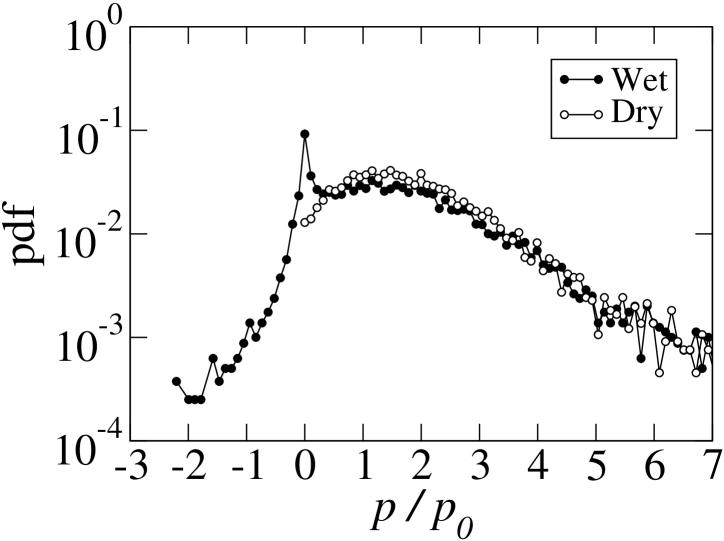
The pdf of normal forces is shown in Fig. 10 for both packings. The symmetry of the distribution around is now broken (compare to Fig. 2). The distributions are roughly exponential for both tensile and compressive forces but the exponents are different. We also note that the exponent for compressive forces is nearly the same as for the dry sample. On the other hand, although the strictly zero forces have been removed from the statistics, a distinct peak centered on zero force is present for the wet sample and absent from the dry sample. If the occurrence of this peak in the unconfined case () is attributed to the interfacial zone, its persistence in the confined case suggests that a negative pressure phase continues to coexist with the positive pressure phase (which is now the dominant phase assisted with the confining stress). This point will be analyzed below in relation to the distribution of particle pressures.
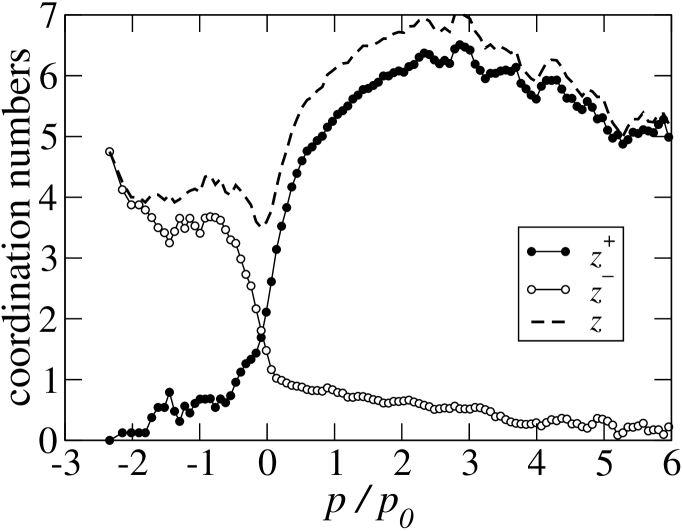
The coordination numbers for compressive and tensile bonds are and , respectively. This shows that the application of a confining pressure has transformed a fraction of tensile bonds into compressive bonds. The plots of the connectivity functions and are displayed in Fig. 11. Each function is normalized to unity as in Fig. 5 for the unconfined packing. The function decreases with from a peak at , showing that nearly half of the particles have no tensile contact at all. The function has a peak at and only a small fraction of particles have no compressive bond ().
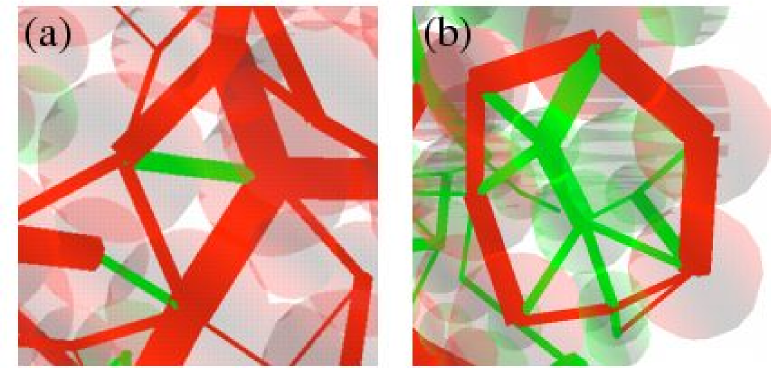
Force patterns with one or more tensile bonds correspond to various local configurations where equilibrium of the particles cannot be ensured only by compressive contacts. Typically, a tensile bond between two particles is induced by transverse particles that are forced into the space between the two particles. One example is shown in Fig. 12(a). For this reason, when a packing is subjected to a stress deviator, most tensile bonds occur along the direction of extension Richefeu06 . The upshot of tensile bonds when they are located in a purely compressive environment is thus to reinforce the shear strength. We also observe many particles with , or tensile bonds. One example is shown in Fig. 12(b) where the tensile actions of several particles creates a “cage” of compressive bonds between their neighboring particles. This kind of patterns may be locally self-equilibrated and thus form aggregates that could move as a rigid body when the packing deforms.
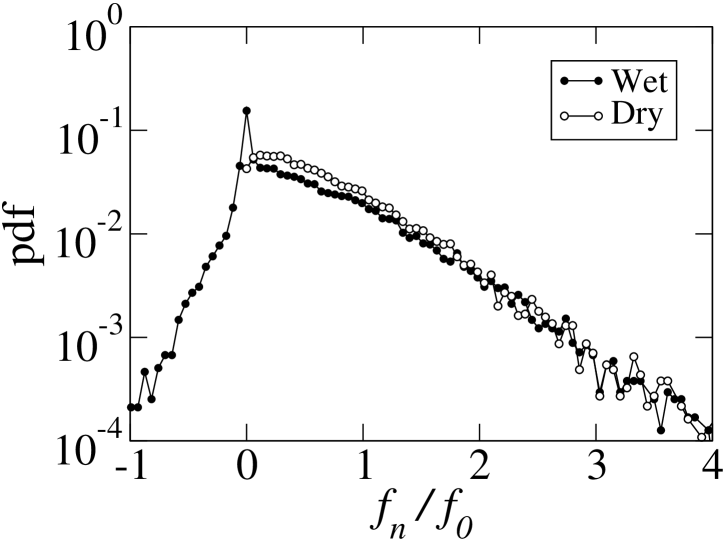
The pdf of particle pressures is shown for dry and wet samples in Fig. 13. Large positive pressures decay exponentially in both cases. In the dry case, a local maximum is observed at as a signature of the confining stress. In this range of pressures, we observe a plateau for the wet sample. In the range of negative pressures, the distribution is no more exponential. This means that the organization of tensile forces does not fulfill the conditions that underly exponential distribution of strong forces in granular media Coppersmith96 . In particular, the network of tensile forces is no more percolating throughout the packing as in the unconfined case. A map of positive and negative particle pressures in a thin layer inside the packing is shown in Fig. 14. The positive pressures are dominant and negative pressure particles are mostly isolated or appear in the form of small clusters. Although the negative pressures do not define a bulk phase any more, the peak centered on zero pressure in Fig. 13 can still be considered as a reminiscence of the interface between the two phases.
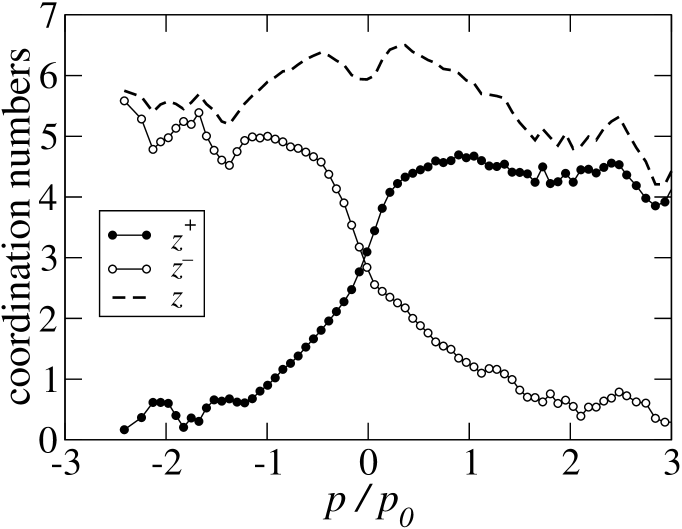
This last point appears more clearly in the plots of partial coordination numbers and as a function of the particle pressure in Fig. 15. We again discern three zones as in Fig. 9 for the unconfined packing. The peak appearing around is the effect of the confining pressure. At the same time, the level of in the range of negative pressures is reduced to (from in the unconfined packing). The intersection occurs at with .
We see that many features of stress transmission in the unconfined packing persist when a confining stress is applied. In particular, in both cases, a large class of particles of weak pressure (close to zero of either sign) is present. This class was interpreted in the unconfined case as belonging to the interface between two percolating phases. Obviously, this interface is ill-defined for Pa where the negative phase appears in the form of either isolated particles or very small aggregates. Nevertheless, our results clearly indicate that tensile bonds and negative pressures play the same role with respect to the equilibrium properties of the particles wherever they are present.
Obviously, as stated before, the molecular dynamics method cannot be used as such for the analysis of self-stresses in the presence of an external pressure. This is because in molecular dynamics, the resolution of governing equations proceeds from the knowledge of the positions of only the first neighbors of each particle and not from an explicit construction of the system of equations as in contact dynamics Moreau94 ; Jean99 An approach for the analysis of self-stresses was presented in Radjaï et al. Radjai96a using “singular value decomposition” in the framework of the contact dynamics method. However, a rough estimation of the self-stresses can be obtained by simply subtracting the mean pressure from the particle pressures. Fig. 16 displays a snapshot of the particle pressures where the pressures below and above are distinguished. The apparent clustering of particle pressures is quite comparable to that observed in Fig 8. This indicates that it is very likely that if the self-stresses were isolated from those induced by the external pressure, they would display the same nearly symmetric “bipolar” structure as that observed at zero confining pressure.
8 Conclusions
We analyzed the statistical properties of the network of self-equilibrated forces in a wet granular material by means of 3D molecular dynamics simulations. Various descriptors of the microstructure and bond force network were shown to carry the signature of an ingenious organization of particle pressures in two distinct clusters of respectively positive and negative pressures, each percolating throughout the packing. This partition is not meant as a formal distinction between negative and positive pressures but rather related to the way the two populations share the space and connect to the bond network. This “phase separation” is characterized by two interesting properties. First, the highest pressures occur in the heart of each phase, whereas the lowest pressure levels constitute the interface between the two phases. Secondly, this interface bears the largest coordination numbers via tensile and compressive bonds. In the presence of confining stresses, the same phenomenology can be expected for self-stresses although these can not be directly accessed from the force data.
It is important to remark that the homogeneity of self-stresses in our simulations results from the homogeneous distribution of capillary bonds. Obviously, the self-stresses can be more or less localized in different portions of the material or involve gradients if the liquid bonds are distributed in a nonuniform manner in the bulk. In the same way, although the boundary conditions are isotropic, the self-stresses may be locked in an anisotropic state as a result of friction and geometrical hinderance effects. In particular, if the capillary bonds are placed only in the gaps between particle pairs with privileged orientation, the self-stresses might organize into an anisotropic scheme. Such anisotropic distributions of liquid bonds may also appear as a result of handling the material. The choice of a homogeneous distribution of liquid bonds in our simulations was motivated by the requirement of representative statistics for the analysis of the system. However, it would be interesting to study the influence of the liquid distribution on the patterns of self-stresses.
The partition of self-stresses implies that the overall equilibrium of the packing is ensured by mesoscopic structures involving length scales larger than the particle size. These length scales are likely to control the size of aggregates during flow or other packing properties of cohesive granular materials. On the other hand, the effect of self-stresses on the tensile strength or Coulomb cohesion of wet granular materials is of interest to wet processing of grains in chemical engineering and merits to be studied along these lines. In the same way, the influence of solid fraction is an important aspect with evident application to compaction and consolidation of cohesive packs.
Acknowledgements.
This work was accomplished within the “granular solids” group of the LMGC. We thank F. Soulié for his help with the validation of the capillary law used in our simulations. The data were treated by means of the 3D software mgpost (www.lmgc.univ-montp2.fr/richefeu).References
- (1) H. J. Herrmann, J.-P. Hovi, and S. Luding, Physics of dry granular media - NATO ASI Series E 350 (Kluwer Academic Publishers, Dordrecht, 1998)
- (2) S. Roux and F. Radjaï, in Mechanics for a New Millennium, edited by H. Aref and J.W. Philips (Kluwer Acad. Pub., Netherlands, 2001), p. 181
- (3) M. Oda, Soils and foundations 12, 17 (1972)
- (4) J. Christoffersen, M. M. Mehrabadi, and S. Nemat-Nasser, J. Appl. Mech. 48, 339 (1981)
- (5) L. Rothenburg and R. J. Bathurst, Geotechnique 39, 601 (1989)
- (6) H. M. Jaeger and S. R. Nagel, Reviews of Modern Physics 68, 1259 (1996)
- (7) F. Calvetti, G. Combe, and J. Lanier, Mech. Coh. Frict. Materials 2, 121 (1997)
- (8) D. M. Mueth, H. M. Jaeger, and S. R. Nagel, Phys. Rev. E 57, 3164 (1998)
- (9) M. R. Kuhn, Mechanics of Materials 31, 407 (1999)
- (10) J.-N. Roux, Phys. Rev. E 61, 6802 (2000)
- (11) H. Troadec, F. Radjaï, S. Roux, and J.-C. Charmet, Phys. Rev. E 66, 041305 (2002)
- (12) F. Radjaï and S. Roux, Phys. Rev. Lett. 89, 064302 (2002)
- (13) R. Y. Yang, R. P. Zou, and A. B. Yu, Phys. Rev. E 65, 041302-1 (2002)
- (14) F. Radjaï, D. E. Wolf, M. Jean, and J. J. Moreau, Phys. Rev. Lett. 80, 61 (1998)
- (15) S. N. Coppersmith, C. Liu, S. Majumdar, O. Narayan, and T. A. Witten, Phys. Rev. E 53, 4673 (1996)
- (16) F. Radjaï, M. Jean, J. J. Moreau, and S. Roux, Phys. Rev. Lett. 77, 274 (1996)
- (17) T. S. Majmudar and R. P. Behringer, Nature (London) 435, 1079 (2005)
- (18) L. Staron, J.-P. Vilotte, and F. Radjaï, Phys. Rev. Lett. 89, 204302 (2002)
- (19) M. E. Cates, J. P. Wittmer, J.-P. Bouchaud, and P. Claudin, Phys. Rev. Lett. 81, 1841 (1998)
- (20) A. J. Liu and S. R. Nagel, Jamming and Rheology (Taylor & Francis, London, 2001)
- (21) O. Dauchot and G. Marty, Phys. Rev. Lett. 95, 265701 (2005)
- (22) E. I. Corwin, H. M. Jaeger, and S. R. Nagel, Nature 435, 1075 (2005)
- (23) J. B. Knight, C. G. Fandrich, C. N. Lau, H. M. Jaeger, and S. R. Nagel, Phys. Rev. E 51, 3957 (1995)
- (24) D. M. Wood, Soil behaviour and critical state soil mechanics (Cambridge University Press, Cambridge, England, 1990)
- (25) A. Castellanos, J. M. Valverde, and M. A. S. Quintanilla, Phys. Rev. E 64, 041304 (2001)
- (26) N. Fillot, I. Iordanoff, Y. Berthier, Journal of Tribology 126, 606 (2006)
- (27) D. J. Hornbaker, R. Albert, I. Albert, A.-L. Barabasi, and P. Schiffer, Nature (London) 387, 765 (1997)
- (28) T. C. Halsey and A. J. Levine, Phys. Rev. Lett. 80, 3141 (1998)
- (29) V. Richefeu, M. S. El Youssoufi, and F. Radjaï, Phys. Rev. E 73, 051304 (2006)
- (30) G. K. Reynolds, C. F. W. Sanders, A. D. Salman, and M. J. Hounslow, in Granular Materials: fundamental and applications, edited by S. J. Antony, W. Hoyle, and Y. Ding (RS.C, Cambridge, 2004), p. 296
- (31) A. Castellanos, Advances in Physics 54, 263 (2005)
- (32) I. Preechawuttipong, Ph.D. Thesis, Université Montpellier 2, 2002
- (33) F. Radjaï, I. Preechawuttipong, and R. Peyroux, in Continuous and discontinuous modelling of cohesive-frictional materials, edited by P. A. Vermeer, S. Diebels, W. Ehlers, H. J. Hermann, S. Luding, and E. Ramm (Springer, Berlin, 2001), p. 149
- (34) M. S. El Youssoufi, J.-Y. Delenne, and F. Radjai, Phys. Rev. E 71, 051307 (2005).
- (35) P. A. Cundall and O. D. L. Strack, Geotechnique 29, 47 (1979)
- (36) M. P. Allen and D. J. Tildesley, Computer Simulation of Liquids (Oxford University Press, Oxford, 1987)
- (37) J. Schäfer, S. Dippel, and D. E. Wolf, J. Phys. I France 6, 5 (1996)
- (38) M. A. Erle, D. C. Dyson, and N. R. Morrow, AIChE Journal 17, 115 (1971)
- (39) G. Lian, C. Thornton, and M. J. Adams, J. Colloid Int. Sci. 161, 138 (1993)
- (40) T. Mikami, H. Kamiya, and M. Horio, Chemical Engineering Science 53, 1927 (1998)
- (41) F. Soulié, F. Cherblanc, M. S. El Youssoufi, and C. Saix, Int. J. Numer. Analyt. Meth. Geomech. 30, 213 (2006)
- (42) C. Willett, M. Adans, S. Johnson, and J. Seville, Langmuir 16, 9396 (2000)
- (43) L. Bocquet, E. Clarlaix, F. Restagno, C. R. Physique 3, 207 (2002)
- (44) S. Herminghaus, Advances in Physics 54, 221 (2005)
- (45) G. Lian, C. Thornton, and M. J. Adams, Chem. Eng. Sci. 53, 3381 (2004)
- (46) J. N. Israelachvili, Intermolecular & surface forces (Academic Press, London, 1993)
- (47) S. Dippel, G. G. Batrouni, and D. E. Wolf, Phys. Rev. E 56, 3645-3656 (1997)
- (48) S. Luding, in Physics of dry granular media - NATO ASI Series E350, edited by H. J. Herrmann, J.-P. Hovi, and S. Luding (Kluwer Academic Publishers, Dordrecht, 1998), p. 285
- (49) V. Richefeu, Ph.D. thesis, Université Montpellier 2, 2005
- (50) Z. Fournier, D. Gerimichalos, S. Herminghaus, M. M. Kohonen, F. Mugele, M. Scheel, M. Schulz, B. Schulz, C. Schier, R. Seemann, and A. Shudelny, Applied Physics: Condensed Matter 17, 477 (2005)
- (51) M. van Hecke, Nature 435, 1041 (2005)
- (52) F. Radjaï, S. Roux, and J. J. Moreau, Chaos 9, 544 (1999)
- (53) J. J. Moreau, in Friction, Arching, Contact Dynamics edited by D. E. Wolf and P. Grassberger (World Scientific, Singapore, 1997), p. 233
- (54) L. Staron, F. Radjaï, and J.-P. Vilotte, Eur. Phys. J. E 18, 311 (2005)
- (55) J. J. Moreau, Eur. J. Mech. A Solids (Suppl.) 13, 93 (1994)
- (56) M. Jean, Comput. Methods Appl. Mech. Engrg. 177, 235 (1999)
- (57) F. Radjaï, L. Brendel, and S. Roux, Phys. Rev. E 54, 861 (1996)