Superlattice
Magnetophonon Resonances in Strongly Coupled InAs/GaSb
Superlattices
Abstract
We report an experimental study of miniband magnetoconduction in semiconducting InAs/GaSb superlattices. For samples with miniband widths below the longitudinal optical phonon energy we identify a new superlattice magnetophonon resonance (SLMPR) caused by resonant scattering of electrons across the mini-Brillouin zone. This new resonant feature arises directly from the superlattice dispersion and total magnetic quantisation (energetic decoupling) of the superlattice Landau level minibands.
pacs:
73.21.Cd, 73.43.QtSemiconductor superlattices (SL’s) comprise alternating layers of two or more semiconductor materials, leading to the formation of continuous energy bands in the growth direction called minibands. The reduced Brillouin zone and energy band width of the SL allows measurements that probe parameter spaces which are inaccessible in bulk semiconductors. Total quantisation of the superlattice energy scheme can be achieved by the application of a large magnetic field which suppresses inter-Landau level miniband (LLMB) scattering and allows the realisation of a ’quasi’ 1-dimensional or quantum box SL (QBSL) regime. This has led to strong interest in the SL magnetoresistance and transport characteristics Fowler et al. (2006); Patané et al. (2004); Mori et al. (2001); Henriques et al. (2004); Deacon et al. (2006). The SL miniband structure can be engineered such that in the QBSL regime optical phonon scattering is limitedNoguchi et al. (1993); Sakaki (1989) by using narrow minigap and miniband widths, leaving only weak acoustic-phonon processes to dissipate the electron energy. In this report we investigate magnetotransport properties of InAs/GaSb superlattices in the miniband transport regime. In a previous publicationDeacon et al. (2006) we investigated hot-electron magnetophonon resonance caused by the LO phonon mediated hopping between Landau Wannier-Stark states at low temperatures. In this report we study longitudinal magnetophonon resonances caused by the resonant emission/absorption of longitudinal optical (LO) phonons in the miniband transport regime for a range of SL structures at high tempertures. Through a systematic study using different miniband widths we identify a new form of magnetophonon resonance which provides evidence for the energetic de-coupling of SL Landau level minibands leading to suppression of optical phonon scattering.
I Introduction
The Bloch frequency () of a biased SL is given by where is the applied electric field and is the superlattice period. Superlattice transport at low temperatures is characterised by two regimes. At low electric fields where , where is the SL miniband width, miniband transport through extended SL states dominates. In the simple Esaki-Tsu miniband transport modelEsaki and Tsu (1970) electron drift velocity () is described by a scattered Bloch oscillator in 1-dimension, , where electron mobility , and is the scattering time. The main mechanisms which contribute to are phonon scattering, impact ionisation and interface roughness scattering. At high electric fields however causing the miniband to split into localised Wannier-Stark-ladder (WSL) statesTsu and Esaki (1994); Mendez et al. (1988); Kast et al. (2002) and consequently miniband transport is no longer the dominant process.
Despite the critical role of energy relaxation processes in superlattices the magnetophonon effectGurevitch and Firsov (1961) has only received a small amount of attention. It has been extensively studied in bulkStradling and Wood (1968); Harper et al. (1973); Nicholas (1985) and 2-dimensionalNicholas (1991) semiconductor systems, where magnetophonon resonances (MPR) are observed as magnetoresistance oscillations caused by resonant scattering of electrons by optical phonons. The dominant electron-phonon coupling in all III-V systems is with the LO phonon due to the large electric polarisation associated with these modes. Conservation of crystal momentum limits the LO phonon scattering to phonons near the Brillouin zone center such that the LO phonon energy is essentially mono-energetic.
The effects of MPR on the resistivity depend strongly on the relative configuration of the applied electric and magnetic fields. In the transverse case, (), resonant momentum relaxation causes magnetoresistance maxima to be observed at precisely the MPR resonance condition
| (1) |
where is the cyclotron frequency, is the LO phonon frequency and is an integer. At B-fields which satisfy the MPR condition strong inelastic scattering occurs between zero momentum states separated in Landau index by . In the longitudinal configuration () considered in this report the MPR is typically more complicated as direct LO phonon emission and absorption processes between zero momentum states do not relax the electron momentum in the electric-field direction. In bulk materials resonances occur due to an interplay of different indirect scattering processesHarper et al. (1973); Barker (1973). Extensive experimental observations of longitudinal MPR (LMPR) in bulk III-V systemsStradling and Wood (1968); Harper et al. (1973) reveal resistivity minima which are displaced to -fields somewhat below condition 1. Calculations for superlattices have suggested both that resistivity minimaKleinert and Bryksin (1997) should occur at fields slightly below the resonance condition and that maxima could occurShu and Lei (1994); Polyanovskii (1980) at the resonance condition. When is significantly below the LO phonon energy PolyanovskiiPolyanovskii (1980, 1983) has also suggested that transitions from the top to the bottom of the miniband will generate new superlattice magnetophonon resonances (SLMPR) at the condition
| (2) |
where resonant LO phonon scattering between areas of high density of states (DOS) at the top and bottom of the superlattice miniband enhances the current.
In contrast to the predictions of theory all experimental observations of MPR in SuperlatticesNoguchi et al. (1992); Gassot et al. (1996); Dalton et al. (2001) have assigned MPR features as resistance maxima, predominantly in samples with low and using the GaAs/AlAs system. A significant enhancement of the resonant peak intensity, compared with bulk material, has been reported and attributed to the effect of the superlattice band structure. Noguchi et al.Noguchi et al. (1992) also observed that low samples exhibited plateaus in the oscillatory part of the magnetoresistance trace which it was suggested may provide evidence for Polyanovskii’s predictions. Detailed studies by Gassot et al.Gassot et al. (1996) also assigned LMPR peaks as maxima in resistance but reported significant deviations from the predicted MPR conditions. The analysis of the GaAs/AlAs system is further complicated by the presence of resonances attributed to both the GaAs and AlAs LO phonons, which are approximately 25% different in energy.
This paper reports studies of the magnetophonon effect in the type-II InAs/GaSb system which has a low carrier effective mass (mme) allowing the study of transport at cyclotron energies considerably above the LO phonon energy ( meV). The analysis of the resonance is also simplified because the LO phonon energies of the InAs and GaSb layers are almost exactly equal. Tunnelling between adjacent superlattice layers is dominated by interband coupling and is strongly k dependant. The interband coupling to the barrier valence band states is strongly reduced for higher Landau index () LLMB’s resulting in narrower miniband widthsHales et al. (2000) () and suppressing domain formation.
Throughout this report we will refer to all experimentally observed resonances as LMPR features so as to distinguish them from the MPR condition. This is important as the longitudinal configuration typically produces resonances slightly shifted from the MPR condition.
II Experimental Method
Experiments were performed on 100 period undoped InAs/GaSb superlattices grown by MOVPE. Samples were grown on n-type InAs substrates (Carrier density cm-3 estimated from Shubnikov-de Haas measurements) with Å InAs buffer and cap layers. The ratio of InAs/GaSb () is estimated from growth rates measured using an in-situ surface photo-absorption (SPA) techniqueKlipstein et al. (1998). Samples were also characterized using X-ray diffraction (XRD) allowing calculation of the superlattice period ().
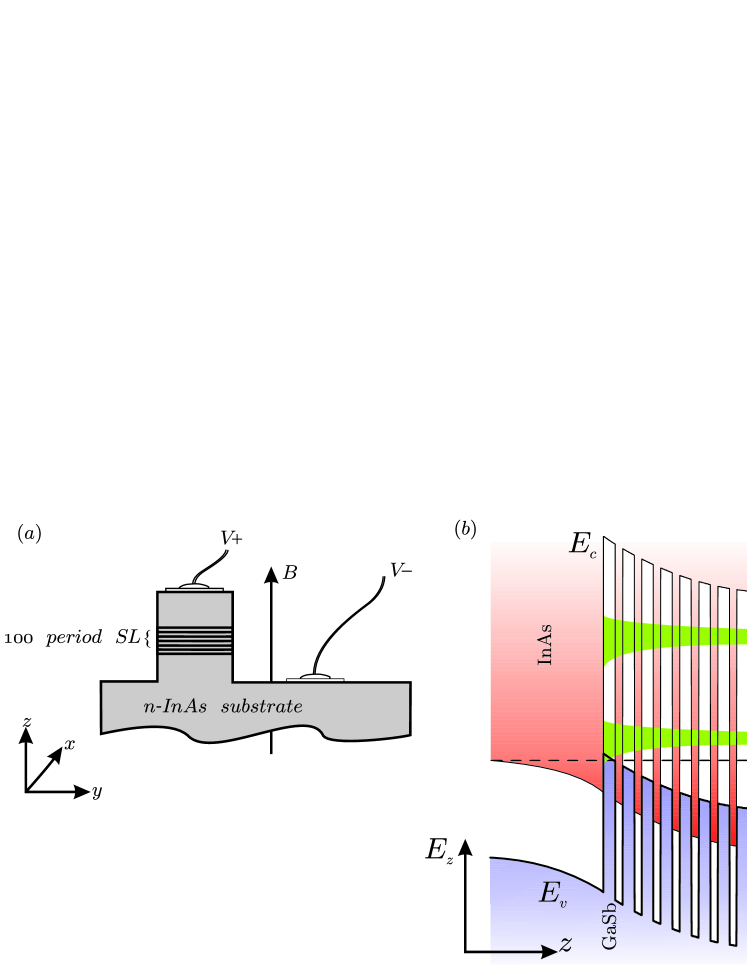
For vertical transport measurements 150 m mesas were defined using standard lithographic and wet etching techniques. Ohmic contacts were made to sample and substrate by evaporating 5 nm of chromium and 150 nm of gold. Previous measurementsDeacon et al. (2006, 2004) on the same samples have identified that transport is best described by a number of active periods which is less than the nominal 100 periods grown. Reduction in the number of periods is caused by the formation of InAs inversion layers at the superlattice-substrate and superlattice-cap interfaces, figure 1 (b). Low temperature measurements on these samples identify 2-dimensional electron gases with carrier densities cm-2, from Shubnikov-de Haas like oscillations, which is consistent with the formation of this structure. Electron wavefunctions in the miniband couple with the inversion layer states causing a widening of the superlattice miniband in some of the first and last periods of the structure. The broadened miniband states are highly conducting and allow electrons to be easily injected into the miniband. The broadened miniband also exhibits negligible voltage drop when the structure is biased resulting in the reduction of the number of active periods observed().
All measurements were performed in dc mode with two contacts as displayed schematically in figure 1(a). measurements in magnetic fields up to 19.5 T were performed using a superconducting magnet system and a Keithley 236 SMU. Higher magnetic fields were obtained using non-destructive magnets in the Clarendon laboratory Kurti pulsed magnetic field facility. The magnetic field pulse was recorded using a pick-up coil situated 2 mm below the sample. Induced voltages during the magnetic field pulse are removed by averaging two pulses of opposite polarity. Pulsed field measurements were performed with Gage Compuscope 5 MHz transient recorder cards.
| Sample No. | (Å)111Measured with XRD. | 222Estimated with SPA data. | (meV) 333Estimated using calculations ( % error). | 444Estimated from Stark-cyclotron-resonances and hot-electron MPR see references Deacon et al. (2006) and Deacon et al. (2004). |
| 4577 | 166 | 0.29 | 2 | 56 |
| 4562 | 130 | 0.46 | 10 | 60 |
| 4561 | 126 | 0.50 | 13 | 59 |
| 4579 | 117 | 0.83 | 27 | 62 |
| 3756 | 93 | 0.82 | 48 | 67 |
| 4520 | 86 | 1.26 | 75 | 60 |
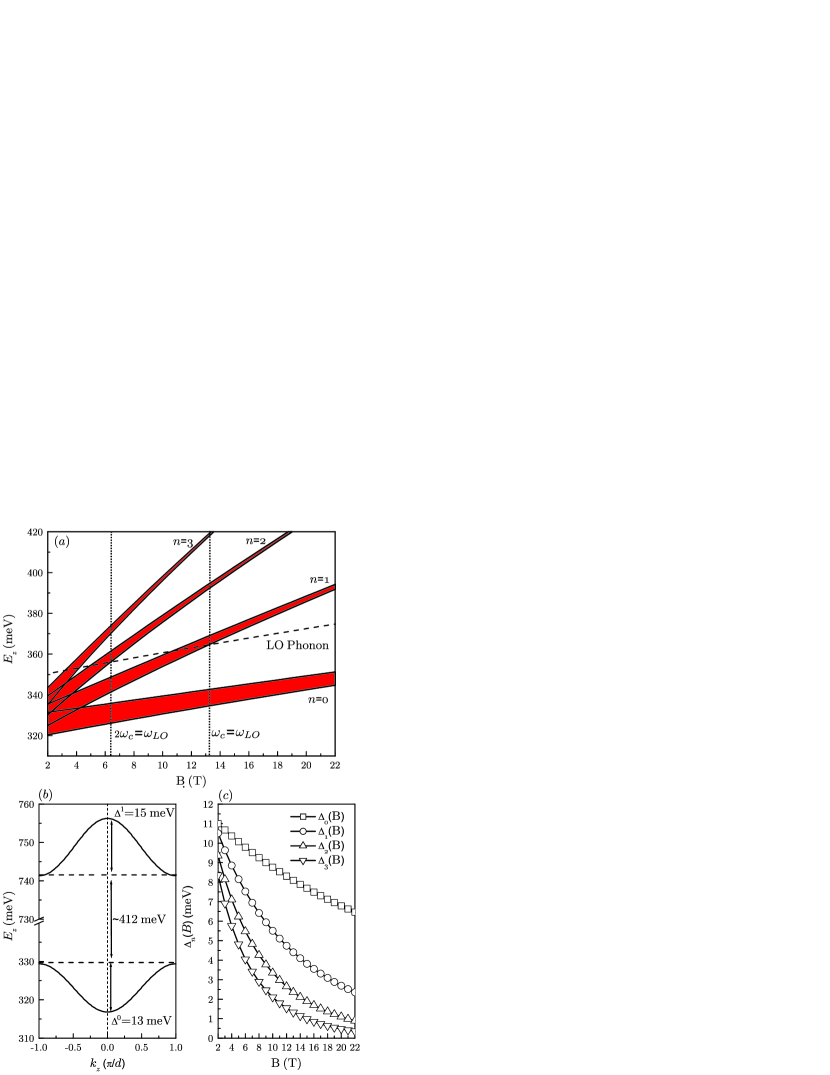
Sample characteristics were simulated with kp theoryBastard (1981) solved using the envelope function approximationBastard (1982) in momentum spacePap . Sample characteristics are summarised in table 1. Fourier transform magnetoabsorption spectroscopy was used to observe the superlattice energy gap which allows refined estimation of the ratio and shows that miniband width estimates in table 1 are correct within to %. kp simulation of the superlattice Landau miniband fan are later used to predict the position of MPR features. An example of a SL Landau miniband fan is presented in figure 2 for sample 4561. All samples display a large separation between the first and second conduction minibands ( meV for 4561) such that for the bias values used in this study only conduction through the fundamental miniband need be considered, figure 2 (b). Simulation results also clearly display a strong suppression of miniband width with increasing magnetic field which is stronger for higher index Landau levels due to the higher energy of these states, figure 2 (c).
III Results
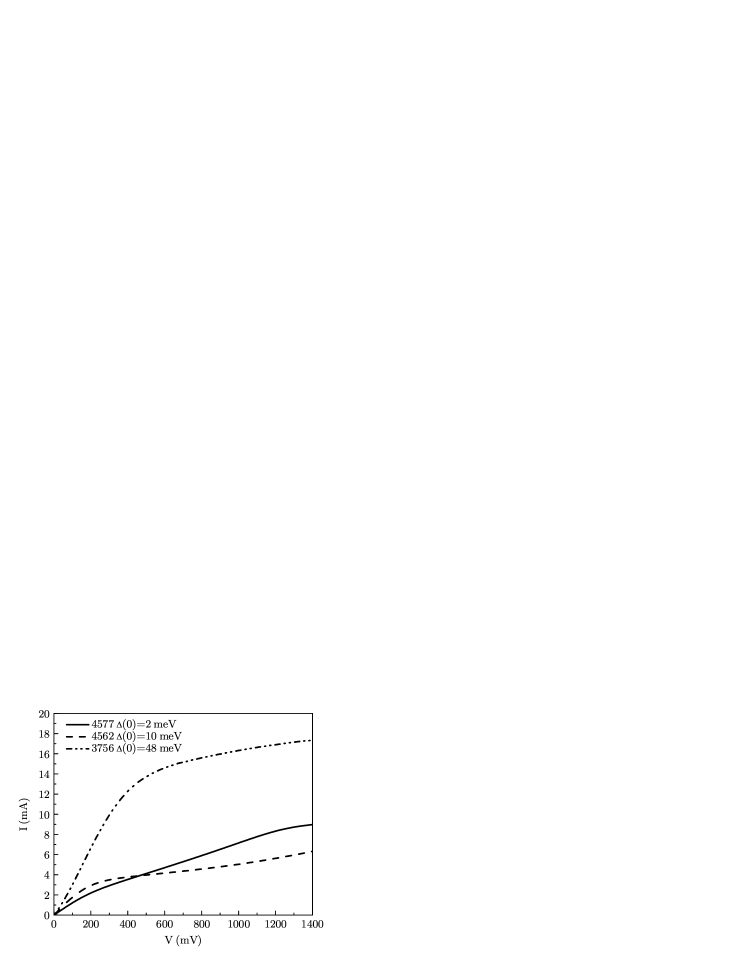
curves for three samples are displayed in figure 3 and are characteristic of the response of all superlattices studied in this report. We observe conventional miniband transport characteristics with a region of ohmic miniband transport at low bias followed by a miniband transport peak identified as a shoulder in the trace (for example at mV for sample 4577 and mV for sample 3756). For sample 4577 we observe a second shoulder at mV which is attributed to electron-phonon resonances in the Stark hopping regimeGovorov and Èntin (1994); Bryxin and Firsov (1971) as have been discussed in a previous publication on hot-electron MPR observed in the WSL regime for the same sample setDeacon et al. (2006).
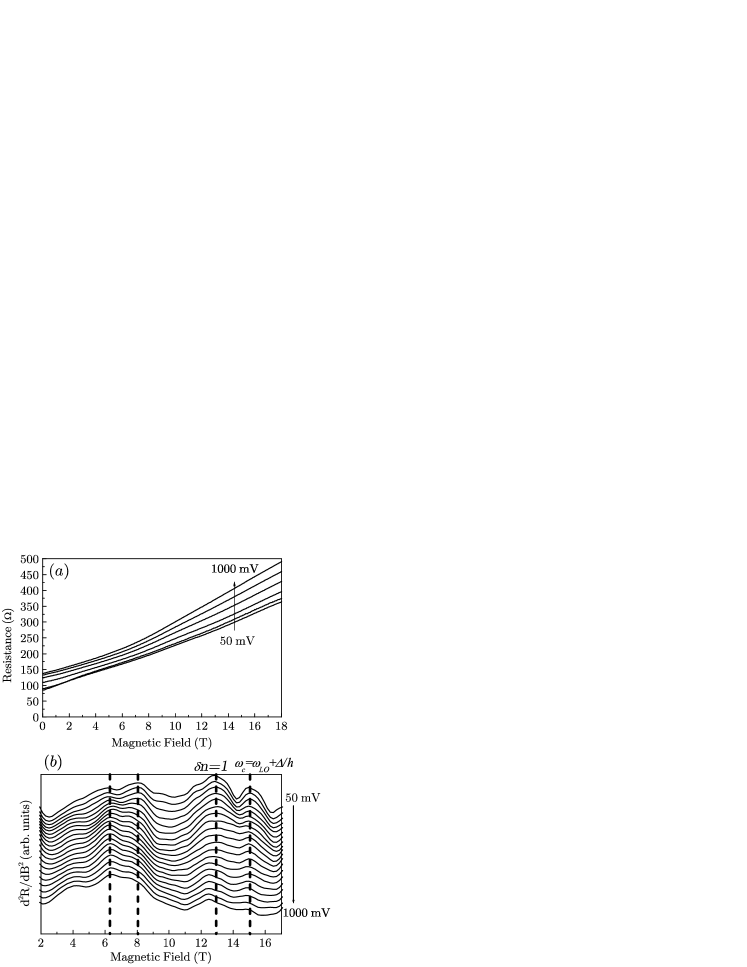
curves for sample 4577 ( meV) are displayed in figure 4 (a) for bias in the range mV and K. traces are analysed by plotting to remove the monotonically increasing background resistance and identify weak resonances, figure 4 (b). In plots of maxima correspond to resistivity minima in the equivalent trace. In this paper we will use the simplification that the additional resistivity maxima and minima caused by the resonant scattering processes refer to minima and maxima in respectively, a simplification in discussion often used when discussing MPR featuresPeterson (1975). Plots of display strong maxima features at T and T. Estimates of the MPR condition for sample 4577 using calculations predict a resonance at T.
The appearance of two resonant peaks close to the conventional magnetophonon condition predicted by calculations suggests that the resonant behavior may be significantly more complex than has previously been assumed. The main resistivity maximum lies close to the conventional MPR condition, equation 1, whilst the resistivity minimum which might be attributed to LMPR is at T shifted to below the conventional MPR condition. The second minimum at T is a possible example of the new SLMPR resonance given by equation 2. This assignment is supported by the fact that both LMPR and SLMPR features are significantly suppressed with increasing bias beyond 200 mV when the superlattice moves into the WSL regime, and so all further measurements were restricted to the miniband transport range of bias. The feature at T is likely to be the SLMPR resonance. Assignment of the 6.3T feature to LMPR is however inconclusive as a residual Shubnikov de-Haas oscillation peak for the bulk substrate occurs at approximately T and complicates analysis in this low B-field region.
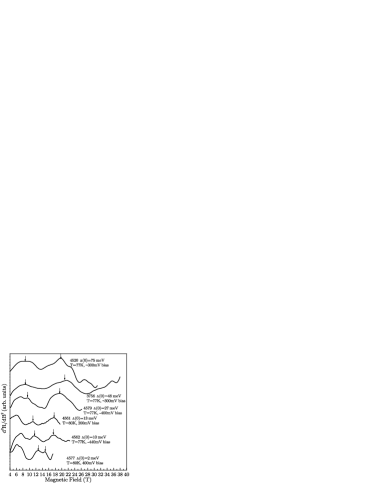
In order to test this assignment results are examined for samples with a range of miniband widths as shown in figure 5. The strong features identified for analysis are selected for repeatability between successive measurements and in comparison with data taken for steady fields up to T, as shown for sample 4577 in figure 4. Resistivity minima ( maxima) which are candidates for LMPR and SLMPR features are indicated by arrows. As the miniband width increases the separation of the SLMPR feature from the conventional MPR resonance increases progressively. All features show a characteristic MPR temperature dependence with maximum amplitude in the range K.
IV Discussion
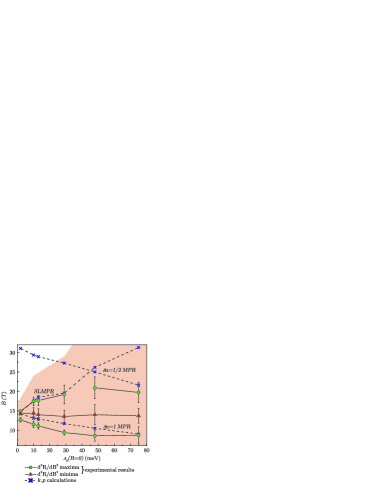
The magnetic field positions of the observed LMPR and SLMPR minima and maxima features are compared with the values predicted by calculations and Equations 1 and 2 in figure 6. The predicted magnetic field value for the MPR condition falls with increasing due to the decrease in the superlattice band gap, which causes the effective mass to decrease. We observe that resistivity maxima ( minima) occur at fields slightly above the conventional MPR resonance position. The experimentally observed resistivity minima labelled as LMPR are typically seen when in good agreement with bulk LMPR resonancesStradling and Wood (1968); Harper et al. (1973). By contrast the SLMPR features move up in field due to the increased contribution from in equation 2 and show excellent agreement with the predicted SLMPR positions when account is taken of the magnetic field dependence of the miniband width.
As the miniband width increases we expect a continuous transition to conventional bulk magnetophonon behavior once since the superlattices may be considered to act as a bulk 3-dimensional system if all thermal and cyclotron excitations are much smaller than the superlattice miniband width
| (3) |
Within this regime electrons are unable to probe the upper portion of the superlattice miniband and carriers only experience a dispersion similar to the parabolic bulk case. It would therefore be expected that such samples display no SLMPR features. calculation results for samples 3756 and 4520 indicate that if observed the SLMPR would be located at T and T respectively. In experiment (figure 5) both exhibit resistance minima features at around T which correspond well with the predicted MPR resonances which is also particularly strong in the Longitudinal configuration for bulk materialsHarper et al. (1973) suggesting that the transition to bulk behavior has occurred for these structures. This will be discussed further later in this report.
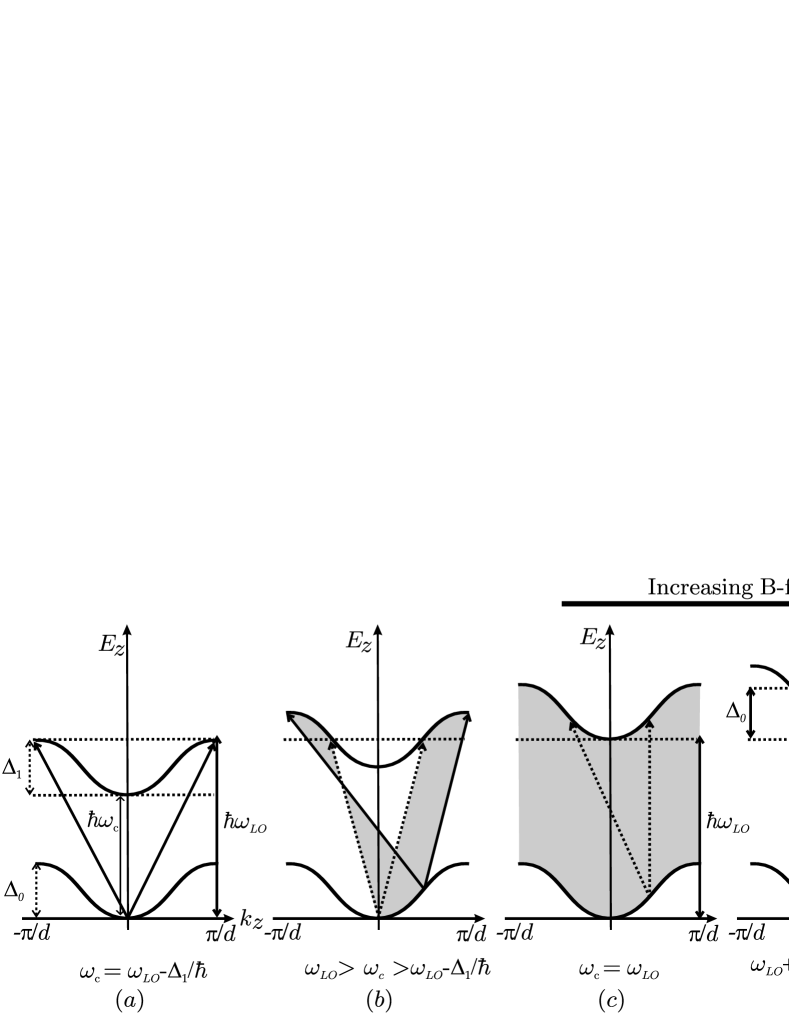
The physical origins of the LMPR and SLMPR features in low miniband width samples () can be understood by considering the LO phonon absorption/emission processes which are allowed for different values, as shown in figure 7. Inter-miniband LO phonon scattering between the and LLMB’s is only permitted in the range due to the forbidden energy gaps in the system. Note also that the miniband width of any given LLMB has a significant magnetic field dependence () further complicating this schematic picture. Transitions for which final or initial states are at and/or the mini-Brillouin zone boundary have high scattering rates due to the large density of states at these .
We can consider the scattering of electrons in the positive region of the LLMB dispersion which contribute to the transport current. It is clear that LO phonon absorption transitions will result in final states at and such that the average velocity of a final state is zero. The average of LO phonon scattering events therefore relaxes the electron momentum and the resistance will be proportional to scattering rate. The scattering rate will increase approaching the MPR condition as LO phonon scattering is allowed over a greater proportion of the dispersion. At the MPR condition the LO phonon scattering rate is at its greatest. If scattering will be allowed anywhere within the superlattice dispersion. In reality for the InAs/GaSb system restricting scattering at the mini-Brillouin zone boundary.
Above the MPR condition the scattering rate is reduced with increasing B-field as LO phonon transitions from the center of the superlattice dispersion are increasingly forbidden. At the SLMPR condition () only scattering from in the LLMB to in the LLMB is allowed. The relaxation therefore links two high density of states regions of the dispersion relation resulting once again in a high scattering rate.
For superlattice miniband transport, however, the current flow is dependent on more than simply the immediate scattering rate. The contribution to current flow also depends on the subsequent ballistic motion in k-space under electric field acceleration, since the velocity is strongly dependent upon where the carrier is in the dispersion relation. These factors must be considered to fully understand the form of MPR features. We consider the relative effects of acceleration of carriers in initial and final scattered states to determine the effect of the scattering upon transport current. Acceleration in an electric field following LO phonon scattering has the effect of decreasing drift velocity below the MPR condition since the carrier velocity is increasing with in the lower Landau level and decreasing with in the upper level (figure 7(b)). Conversely the drift velocity increases above the MPR condition. At the MPR condition final and initial states are comparable such that subsequent acceleration does not alter the total transport current. Scattering at the SLMPR condition has the most dramatic and significant consequence that it prevents the occurrence of Bragg scattering and the subsequent suppression of transport current due to cycling of the carriers through the negative drift velocity section of the dispersion relation. Above the coupling of the and LLMBs through LO phonon scattering is removed and intra-LLMB scattering dominates. This reverses carrier momentum and quenches transportPatané et al. (2004); Henriques et al. (2004) resulting in a significant increase in resistance following the SLMPR feature. The characteristics of the LMPR and SLMPR features are therefore determined by interplay of the scattering rate and the subsequent ballistic motion of the transport electrons. This simple analysis indicates that LMPR is likely to appear as a resistance maximum at the MPR condition due to the high scattering rate and SLMPR as a resistance minimum followed by a large increase in resistance.
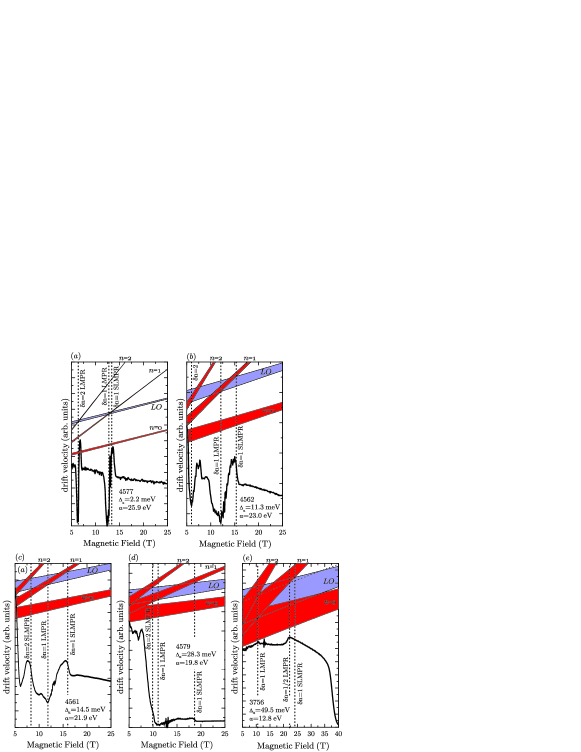
In order to understand the different contributions to the magnetoresistance, modelling of the experimental results was therefore performed using semiclassical Monte Carlo simulations of the miniband transport, assuming that the effects of Wannier-Stark localisation are not significant. Simulations follow the method outlined by Henriques et al.Henriques et al. (2004). Limited inelastic acoustic phonon scattering in an energy window of 1 meV (selected to be less than ) was introduced to ensure that the conductivity at high -fields is small but non-zero. It is found that changing this window significantly alters the background magnetoresistance but that the LMPR and SLMPR features remain. Simulation results are displayed for superlattice band structures approximating to that of samples 4561, 4579 and 3756 in figure 8. The Landau miniband energy widths have been approximated with the function where and are parameters obtained from fits to the results of simulations. Both samples are simulated with K and electric field such that results are close to the ohmic miniband transport regime but show some ballistic behavior.
The simulation results for low miniband widths (figure 8 (a) and (b)) display two clear features: firstly, there is a pronounced minimum in the drift velocity (corresponding to a resistivity maximum) at the conventional MPR condition and secondly there are peaks in drift velocity at the SLMPR conditions. These results show excellent agreement with the schematic picture previously discussed. The simulations identify that the magnetotransport is dependent on both the scattering rate and the positions on the dispersion curves of the initial and final states. Resistance maxima at the MPR are caused by the increased scattering rate. The resistance minima at the SLMPR are formed from the relative effects of electric field acceleration in the initial and final scattering states.
Similar simulation results are observed for other samples which show that the position of the SLMPR feature is well described by equation 2, shifting progressively away from the LMPR feature with increasing miniband width. The simulation results change significantly when the miniband width becomes large () as observed for sample 3756, figure 8 (c). We observe that resistivity minima now occur at the and MPR conditions. This is in good agreement with the bulk approximation in which the LMPR is observed as a resistivity minimum slightly below the MPR conditionHarper et al. (1973). For sample 3756 the MPR feature is particularly enhanced by proximity to the SLMPR condition. The SLMPR feature is however suppressed above the MPR condition due to efficient intra-miniband LO phonon emissions.
Our overall conclusion therefore is that the modelling provides strong support for the attribution of the high field resistivity minimum to the predicted SLMPR feature and that this is strongly supported by the clear dependence of the SLMPR position on miniband width.
By contrast, the attribution of a maximum or minimum in resistance to the precise MPR condition is not found to hold experimentally. The stronger feature is found to be a maximum at fields a few percent above the MPR condition. A resistivity minimum is found in all samples slightly below the MPR condition, in an analogous behavior to that seen in bulk material. The non-observation of the SLMPR feature in the earlier GaAlAs based work is probably due to the complications caused by the presence of the two phonon modes and the relatively small range of miniband widths studied.
In summary we have demonstrated a new form of magnetophonon resonance which occurs due to the scattering of carriers from the top of the ground state miniband to the bottom of the next LLMB. This new resonance known as superlattice MPR (SLMPR) was first predicted by Polyanovskii in 1983. The resonance condition corresponds to taking carriers from the top of the miniband dispersion where they will have a negative differential velocity and moving them to the bottom of the band where they can be ’recycled’ through the positive conduction regime.
Parts of this work has been supported by EuroMagNET under the EU contract RII3-CT-2004-506239 of the 6th Framework ’Structuring the European Research Area, Research Infrastructures Action’ and by the Brazilian agency CNPq under contract 308116/2004-6.
References
- Fowler et al. (2006) D. Fowler, A. Patanè, A. Ignatov, L. Eaves, M. Henini, N. Mori, D. K. Maude, and R. Airey, App. Phys. Lett. 88, 52111 (2006).
- Patané et al. (2004) A. Patané, N. Mori, D. Fowler, L. Eaves, M. Henini, D. K. Maude, C. Hamaguchi, and R. Airey, Phys. Rev. Lett. 93, 146801 (2004).
- Mori et al. (2001) N. Mori, C. Hamaguchi, L. Eaves, and P. Main, VLSI Design 13, 45 (2001).
- Henriques et al. (2004) A. B. Henriques, R. S. Deacon, and R. J. Nicholas, Braz. J. Phys. 32, 605 (2004).
- Deacon et al. (2006) R. S. Deacon, R. J. Nicholas, and P. A. Shields, Phys. Rev. B 74, 121306(R) (2006).
- Noguchi et al. (1993) N. Noguchi, J. P. Leburton, and H. Sakaki, Phys. Rev. B 47, 15593 (1993).
- Sakaki (1989) H. Sakaki, Japanese Journal of Applied Physics 28, 313 (1989).
- Esaki and Tsu (1970) L. Esaki and R. Tsu, IBM J. Res. Dev. 14, 61 (1970).
- Tsu and Esaki (1994) R. Tsu and L. Esaki, J. App. Phys. 75, 320 (1994).
- Mendez et al. (1988) E. E. Mendez, F. Agulló-Rueda, and J. M. Hong, Phys. Rev. Lett. 60, 2426 (1988).
- Kast et al. (2002) M. Kast, C. Pacher, G. Strasser, E. Gornik, and W. S. M. Werner, Phys. Rev. Lett. 89, 136803 (2002).
- Gurevitch and Firsov (1961) V. L. Gurevitch and Y. A. Firsov, Journal of Experimental and Theoretical Physics Letters 13, 137 (1961).
- Stradling and Wood (1968) R. A. Stradling and R. A. Wood, J. Phys. C 1, 1711 (1968).
- Harper et al. (1973) P. G. Harper, J. W. Hodby, and R. A. Stradling, Rep. Prog. Phys. 36, 1 (1973).
- Nicholas (1985) R. J. Nicholas, Progress in Quantum Electronics 10, 1 (1985).
- Nicholas (1991) R. J. Nicholas, in Landau Level Spectroscopy, edited by G. Landwehr and E. Rashba (Elsevier, 1991), chap. 13, pp. 779–816, 1st ed.
- Barker (1973) J. R. Barker, J. Phys. C 6, 880 (1973).
- Kleinert and Bryksin (1997) P. Kleinert and V. V. Bryksin, Phys. Rev. B 56, 15827 (1997).
- Shu and Lei (1994) W. M. Shu and X. L. Lei, Phys. Rev. B 50, 17378 (1994).
- Polyanovskii (1980) V. M. Polyanovskii, Sov. Phys. Semicond. 14, 1411 (1980).
- Polyanovskii (1983) V. M. Polyanovskii, Sov. Phys. Semicond. 17, 1150 (1983).
- Noguchi et al. (1992) H. Noguchi, H. Sakaki, T. Takamasu, and N. Miura, Phys. Rev. B 45, 12148 (1992).
- Gassot et al. (1996) P. Gassot, J. Genoe, D. K. Maude, J. C. Portal, K. S. H. Dalton, D. M. Symons, R. J. Nicholas, F. Aristone, J. F. Palmier, and F. Laruelle, Phys. Rev. B 54, 14540 (1996).
- Dalton et al. (2001) K. S. H. Dalton, V. J. Hales, D. M. Symons, R. J. Nicholas, P. Gassot, D. K. Maude, and J. C. Portal, Proceedings of the 25th International Conference on the Physics of Semiconductors, pts I and II, Springer Proceedings in Physics 87, 907 (2001).
- Hales et al. (2000) V. J. Hales, A. J. Poulter, and R. J. Nicholas, Physica E 7, 84 (2000).
- Klipstein et al. (1998) P. C. Klipstein, S. G. Lyapin, N. J. Mason, and P. J. Walker, J. Cryst. Growth 195, 168 (1998).
- Deacon et al. (2004) R. Deacon, R. Nicholas, A. Henriques, and N. Mason, Physica E 22, 316 (2004).
- Bastard (1981) G. Bastard, Phys. Rev. B 24, 5693 (1981).
- Bastard (1982) G. Bastard, Phys. Rev. B 25, 7584 (1982).
- (30) An example of results obtained using this method can be found at: www-rjn.physics.ox.ac.uk/kp/.
- Govorov and Èntin (1994) A. O. Govorov and M. V. Èntin, Solid State Commun. 92, 977 (1994).
- Bryxin and Firsov (1971) V. V. Bryxin and Y. A. Firsov, Solid State Commun. 10, 471 (1971).
- Peterson (1975) R. L. Peterson, Semiconductors and Semimetals, Ed. R.K. Willardson and A.C. Beer, vol. 10 (Academic Press, New York, 1975).