Magnetization, Nernst effect and vorticity in the cuprates
Abstract
Nernst and magnetization experiments reveal the existence of a large region of the cuprate phase diagram above the curve in which vorticity and weak diamagnetism exist without phase coherence. We discuss the implication that the transition at is caused by the loss of long-range phase coherence caused by spontaneous vortex creation. Below , these measurements provide an estimate of the depairing field which is found to be very large (40-100 T depending on doping). We discuss the high-field Nernst and magnetization results, binding energy, and the phase diagram of hole-doped cuprates. Some new magnetization results on the vortex liquid in very underdoped LSCO in the limit are reported as well.
pacs:
74.40.+k,72.15.Jf,74.72.-h,74.25.FyI Introduction
A striking characteristic of a superconductor is the stiffness of the macroscopic wave function against distortions of its phase (London rigidity Schrieffer ; Anderson66 ). The long-range phase coherence sustained by the phase stiffness – analogous to the shear rigidity of an ordinary solid – is responsible for superfluid properties such as the Meissner effect. The loss of shear rigidity turns a solid into a liquid. What is the analogous transition in a superconductor? In BCS (Bardeen-Cooper-Schrieffer) superconductors, where the pair amplitude vanishes at the critical temperature (in zero field), this question does not arise because phase coherence is maintained right up to , above which the condensate (the “stuff”) disappears.
However, in the Kosterlitz-Thouless (KT) transition in two-dimensional (2D) systems, loss of phase coherence occurs at a temperature lower than the temperature at which vanishes KT . The phase-coherence collapse results from the spontaneous unbinding of vortex-antivortex pairs driven by entropy gain. The 2D superconductor becomes unstable to the spontaneous appearance of mobile vortices at . Above , remains finite but the rapid diffusion of (anti)vortices leads to strong (singular) fluctuations in . The condensate, with its phase rigidity restricted to the short length scale , corresponds to the “liquid” in the above analogy ( is the phase correlation length). More generally, 3D superconductors with highly anisotropic coupling, low superfluid density and large pair-binding energy may suffer a similar loss of phase coherence by vortex(loop) creation. We will call such transitions the phase-disordering scenario.
From the start, the assumption that the cuprates follow the BCS scenario has been deeply entrenched and surprisingly difficult to dislodge, given the absence of solid evidence. Nonetheless, a slim thread of evidence for phase disordering has always been present. Very early predictions Baskaran ; Inui that phase disordering is dominant in the UD (underdoped) region could not be reliably tested (especially by high-field magnetization), and interest shifted to other issues. The early muon spin relaxation (SR) experiments Uemura , which showed that increases linearly with in the UD region may be seen, in hindsight, to be consistent with the phase-disordering scenario. In an influential paper, Emery and Kivelson Emery showed that cuprates differ from low- superconductors in having an anomalously low phase-disordering temperature. The observation by Corson et al. Corson of kinetic inductance up to 25 K above in ultrathin films of Bi 2212 re-focussed attention on this issue. It was unclear, however, if high-quality crystals behave differently.
Here we describe 2 experiments which have been highly effective in addressing the role of vorticity and phase-disordering in the phase diagram of the cuprates, namely the Nernst effect Xu ; WangPRB01 ; WangPRL02 ; WangSci03 ; WangPRB06 and torque magnetometry WangPRL05 ; LiEPL05 . These 2 techniques probe directly the superfluid response, much like the SR and kinetic inductance experiments. However, they seem to be tailor-made for tiny crystals. Moreover, their resolution remains high even in fields up to 45 Tesla. This has allowed significant progress in the task of measuring the magnetization curve and determining the depairing field in the hole-doped cuprates, which we discuss at length. We also describe recent results which probe the vortex liquid at low temperature = 0.5 K as decreases below the critical value .
Throughout, we write Bi 2212, Bi 2201 and LSCO for , and , respectively. UD, OP and OD stand for underdoped, optimally doped and overdoped, respectively, while SC stands for superconducting.
II Vortex-Nernst effect
In the vortex-liquid state, an applied temperature gradient causes the vortices to flow towards the cooler end of the sample with velocity (the magnetic field ). As each vortex core crosses a line drawn , the difference of the phases and at the ends slips by 2. This translates into a weak transient voltage pulse Anderson66 . Integration of all the voltage pulses from a large number of vortices leads to a steady-state electric field given by the Josephson relation , which may be observed as a Nernst signal . Here, with the magnetization and the vacuum permeability.
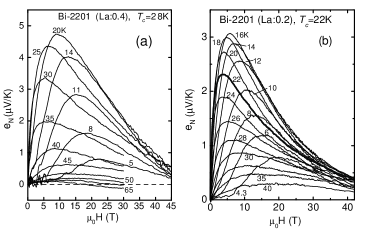
Figure 1 shows the Nernst profiles vs. in OP and OD Bi 2201 (Panels a and b, respectively) WangPRB06 . The “tilted-hill” profile which is apparent in intense fields is characteristic of all cuprates studied. When exceeds the solid melting field , rises steeply to reach a maximum. Above the peak, the condensate amplitude is progressively suppressed by until it decreases to a value approaching zero at the upper critical (depairing) field (48 T and 40 T in the OP and OD samples, respectively). Two noteworthy features are the smooth continuity of the signal across the zero-field , and its persistence to temperatures high above . These 2 features are not observed in low- superconductors (or in the electron-doped cuprate ). In the hole-doped cuprates, they provide strong evidence for the scenario that the transition at corresponds to the loss of long-range phase coherence rather than the vanishing of the amplitude .
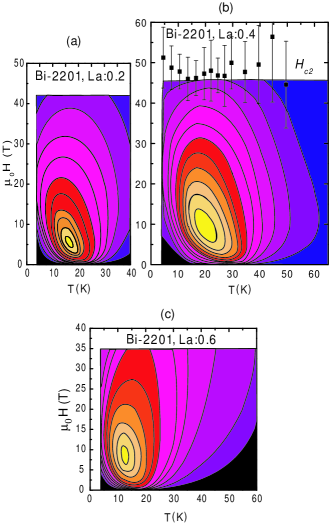
The contour plot of in the - plane provides an instructive way to view the vortex-Nernst signal. In Fig. 2, contour plots for OD, OP and UD Bi 2201 are displayed in Panels (a), (b) and (c), respectively. In each panel, increases from zero (black regions) through the blue, violet and red regions to reach its maximum value in the yellow region. The vortex solid occupies the black wedge in the low-, small- corner. In Bi 2201, the vortex liquid, which dominates the entire - plane, extends to very high fields. More significantly, it extends to temperatures considerably above in all 3 samples. There is no evidence for an line that goes to zero at . Instead, the inferred is nearly independent [shown as solid squares in Panel (b)]. We return to the anomalous behavior of below.
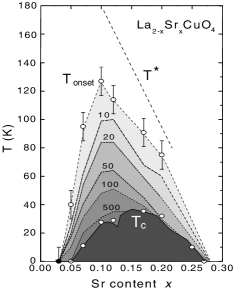
Above the SC dome in the phase diagram of LSCO, the vortex-Nernst signal is observed in the “Nernst region” shown in gray scale in Fig. 3. The contour lines indicate the initial value of the Nernst coefficient . Clearly, the Nernst region is closely related to the SC dome defined by vs. . On the OD side, it terminates at 0.25, while on the UD side, it reaches to 0.03.
The onset temperature is defined as the temperature above which cannot be resolved from the negative quasiparticle (qp) contribution WangPRB01 . As shown, peaks at = 0.10 instead of the OP doping = 0.17 (all the contours also show this skewed profile so it is not due to difficulties in resolving ). The maximum value of (130 K) is significantly lower than values of the pseudogap temperature quoted for the UD region ( is only roughly known in LSCO).
III Torque Magnetometry
The vortex interpretation of the Nernst signals has received strong support from high-resolution torque magnetometry WangPRL05 ; LiEPL05 . Because the supercurrent in cuprates is quasi-2D, torque magnetometry is ideal for probing its diamagnetic response. If the angle between and is small, the torque signal may be expressed as WangPRL05 ; LiEPL05
| (1) |
where is the crystal volume, is the anisotropy of the paramagnetic (background) susceptibility and the diamagnetic magnetization of interest (we choose axes and in the plane; hereafter we write ).
Above 4 K, we find experimentally that is dominated by the paramagnetic van Vleck susceptibility . Because is independent and only mildly dependent, while varies strongly with and is nonlinear in , the 2 contributions are easily separated.
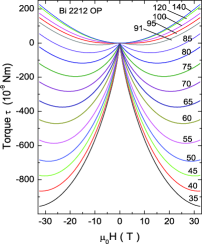
Figure 4 shows how varies with to 32 T in OP Bi 2212. Above 120 K, only the paramagnetic term is visible. Below 120 K, the diamagnetic term increases rapidly to pull the cantilever deflection to large negative values as decreases below (86.5 K).
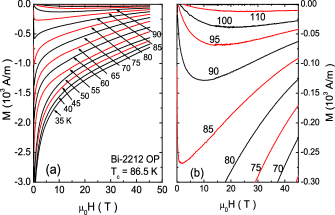
Dividing by and subtracting the term , we isolate which is plotted in Fig. 5. Below 70 K, the - curves closely resemble the Abrikosov profile familiar in low- superconductors; in the very large field interval . As , however, a striking deviation from mean-field behavior becomes apparent. Slightly below , the derivative in weak changes abruptly from positive to negative at a “separatrix” temperature . At , jumps abruptly at to a finite value that is -independent to fields of 5-7 T ( is 2-3 K below ). Above , increases as the fractional power law , where the exponent is anomalous and very strongly dependent. In the interval where (between and 105 K), the system seems to exhibit a fragile London rigidity which is easily destroyed in finite . The profile vs. matches that of the Nernst profile vs. over a broad interval of . The features above are discussed in detail in Refs. LiEPL05 and LiM2S06 .
Recently, the magnetization curves for a 2D large- superconductor in the vicinity of its KT transition was calculated by Oganyesan, Huse and Sondhi Oganesyan . For , the calculation reproduces several of the unusual features in Fig. 5 including the separatrix curve and the change in sign of in weak on both sides of the separatrix. However, above , the theory does not account for the anomalous exponent discussed above ( is always linear in ).
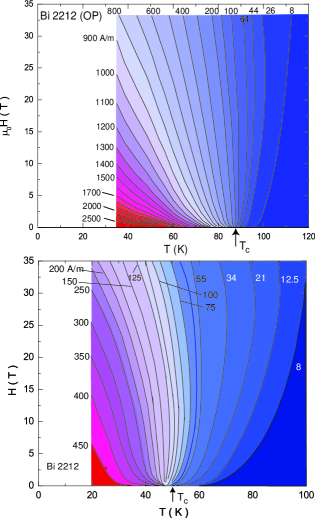
As in the case of , we may display as a contour plot in the - plane (Fig. 6). Above 100 K in the upper panel, the magnitude in OP Bi 2212 is small (8 A/m; deep blue region). As decreases below to 35 K, rises to values 2,000 A/m (red region). Let us recall that, in the MF (mean-field) transition, the contours above converge radially to the point , while below they are compressed into the curve which is a straight line terminating at . Here, the pattern is very different. The contours are roughly parallel and vertical near except in very low where they converge to non-analytically. At (85 K), the contour is strictly vertical, reflecting the constancy of vs. below 5 T. The variation of the magnitude over the whole - region is also instructive. In the MF transition, should drop sharply to near-zero at the MF line , with . Instead, here varies relatively slowly over the whole plane, retaining significant amplitude up to 120 K, which corresponds to the vortex signal detected earlier in the Nernst experiment. There is no evidence for a sharp boundary terminating at corresponding to the MF curve (extrapolation of the - curves in Fig. 5 yields values of = 100-150 T even near . This anomalous behavior of was pointed out long ago for the KT transition Doniach . It may be generic to superconductors undergoing phase-disordering transitions. By comparison, the contour features are even more strikingly anomalous in UD Bi 2212 (Fig. 6, lower panel). Above (50 K), is observable over a broader interval of . The more pronounced curvature of the contour lines (relative to the OP sample) reflects the larger temperature interval above where phase fluctuations exist. The non-analytic behavior in weak fields around is also more evident.
IV The depairing field and binding energy
The torque experiments allow vs. to be measured directly to fields as high as 45 T, which is the scale of in UD, single-layer cuprates (but still quite a bit smaller than in Bi 2212 as evident in Fig. 5). The - curves in UD Bi 2201 are reported in Ref. LiM2S06 .
An important quantity may be derived by integrating the - curve. In BCS theory, the integral is the condensation energy of the superconducting state . This identity, based on thermodynamic arguments, should be valid in a phase-disordered superconductor in the limit = 0. The integration is especially accurate in the Bi-based cuprates and in UD LSCO where hystereses are negligible at large and low . For single layer Bi 2201, we find (at 4 K) = 2,600 J/m3 in an UD sample with = 12 K, whereas = 5,600 J/m3 in an OP sample with = 28 K. These values are significantly smaller than in OP bilayer Bi 2212 with = 86.5 K, where we measure J/m3. (For comparison, in Al, In, Pb and Nb, = 39, 341, 2,560 and 15,600 J/m3, respectively.)
Assuming that the hole density = 0.15/Cu in OP Bi 2201 and and 0.22/Cu in OP Bi 2212, we calculate the condensation energy per hole to be 29 and 41 eV, respectively. The corresponding value for Bi 2212 (2.1 meV per hole) is surprisingly large. The large jump in between single and bilayer systems is not understood.
V Low-temperature vortex liquid
As one crosses the SC-dome boundary moving up in temperature at fixed , the loss of phase coherence occurs via the spontaneous unbinding of vortex-antivortex pairs driven by the gain in entropy, in analogy with the 2D KT transition. It is interesting to cross the boundary by decreasing below the critical value 0.055 at very low . As approaches the Mott limit = 0, increased localization of the Cooper pairs implies that local fluctuations in the pair density decreases. Hence the conjugate variable, the phase , fluctuates strongly. At very low , this happens by the rapid motion of quantum vortices. If the vortex solid is unstable, long-range phase coherence is not possible even when .
To explore this interesting issue, we have extended the torque experiment to below 1 K. Below 6 K, a new contibution to the torque signal arises from the weakly anistropic paramagnetic response of local moments (spin ) given by
| (2) |
with the Bohr magneton and Boltzmann’s constant. Here, is the density of the local moments and , where () is the g-factor measured with ( in the plane). In LSCO for , we find that is unobservable until falls below 15 K.
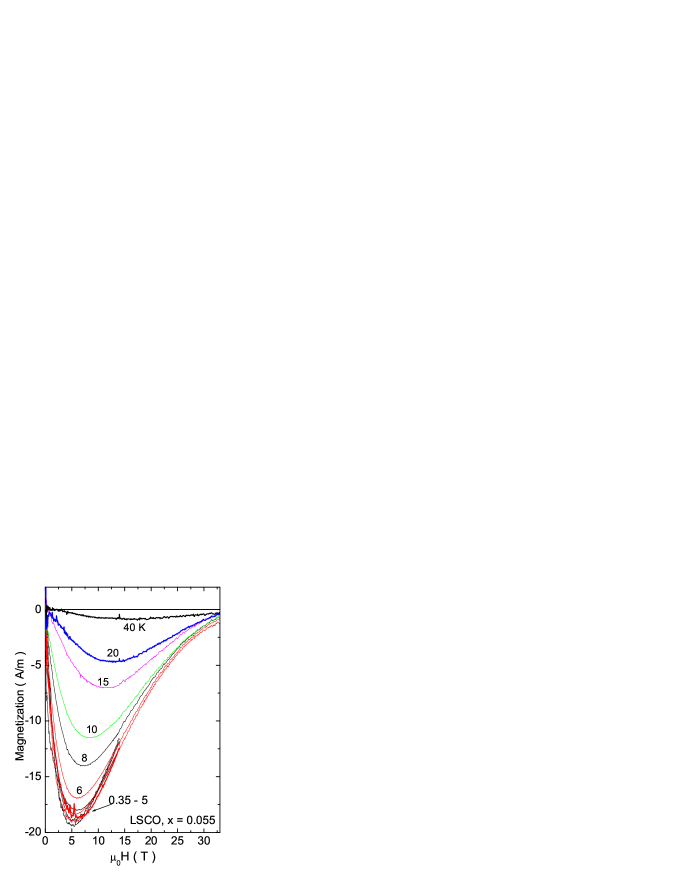
After this spin contribution is removed, we obtain the magnetization curves associated with supercurrents in the CuO2 layers shown in Fig. 7 (in a crystal with = 0.055). At 40 K, a weak diamagnetic signal with a profile that peaks near 5 T becomes evident. The maximum value of increases as decreases to 5 K. However, as decreases to 0.35 K, no further change in is observed. We note that the curve bears a close resemblance to the tilted-hill profile of the Nernst signal (Fig. 1). The diamagnetic signal extends to a field of 37 T which we identify with the depairing field . We may contrast this behavior with that in a crystal inside the SC dome (with = 0.060). There, grows to very large values and exhibits hysteretic behavior when the vortices enter the solid state.
The low- magnetization reveals a sharp qualitative difference between samples inside the SC dome and just outside. In both cases, the depairing field is very large (20-40 T), so that tightly bound pairs exist. However, decreasing the temperature to 0 has very different effects. Inside the dome (), the vortices enter the solid phase with an irreversibility field 8 T, and large hysteresis is observed. If lies outside the dome, cooling has no observable effects on the - curves below 6 K. The vortices remain in the liquid state, and long-range phase coherence is absent down to 0.5 K. We interpret these results as evidence for the existence of a quantum vortex liquid in which fluctuations in prevent the establishment of long-range phase coherence even in the limit = 0. This implies localization of the pairs. The paramagnetic signal (Eq. 2) suggests how this comes about.
At = 0.055, a small fraction of the holes enter a state that displays a paramagnetic magnetic signature consistent with nearly free local moments of 1 () while the remainder remain Cooper-paired. As further decreases to 0.04 and 0.03, the fraction grows at the expense of the diamagnetic signal, suggesting a progressive conversion into the paramagnetic state. By = 0.03, this magnetic state begins to display magnetic hysteresis below 2 K suggestive of glassy behavior (the magnetic hysteresis is easily distinguished from the hysteresis of the vortex solid seen only above ). Details will be published elsewhere.
VI Spin gap, charge pairing and onset temperature
As shown in Fig. 3, the Nernst region occupies a large area that extends above the SC dome into the pseudgogap state. The electronic properties in the Nernst region are highly unusual. Although the in-plane resistivity is high and nominally -linear, both the Nernst and diamagnetic signals increase steeply as . Significant pair condensate amplitude exists in this region but the high concentration of thermally generated mobile (anti)vortices reduces phase rigidity to very short length scales in zero , so that the Meissner effect is absent altogether.
In discussions of the pseudogap, it seems important to recognize that the spin and charge degrees are affected differently. As shown in Fig. 3, the pseudogap temperature lies above . Hence when the pseudogap first appears (at 200-300 K) there is no evidence for Cooper pairing. At such high , the pseudogap is actually a spin gap. The pseudogap was first inferred from the depedence of the relaxation rate and the Knight shift in NMR experiments. Cooper pairing involving the charge degrees occurs only below , as evidenced by the steep rise of the vortex-Nernst and diamagnetic signals. This implies that the spin degrees sense the pairing instability long before the charge degrees. When the charges pair, vorticity and diamagnetism become detectable, i.e. local “superconductivity” with very short appears. In this regard, it is significant that measurements of a “pseudogap” above by ARPES and tunneling (which probe the charge degrees) are confined to 110 K in Bi 2212. We suggest that these experiments are just detecting the gap of the superconducting condensate, but in its phase-disordered state.
Recently, the important role of vortices in the UD region has been emphasized in several theories Tesanovic ; Weng ; Honerkamp ; Chen ; Sachdev ; Balents ; Anderson06 . An interesting theory for has been proposed by Anderson Anderson06 . Hartree-Fock factorization of the Hamiltonian yields 2 self-energies and , which may be represented in the space (, ) as the orthogonal vectors Zhang
| (3) |
A key feature is that the self energy shares the same “extended -wave” form as the qp kinetic energy. At high temperatures (), is unaligned with the kinetic energy, but “locks” to it at . Below , the self-energy (the superconducting gap parameter), continues to fluctuate in phase until where phase coherence becomes long-range.
Finally, we mention theories that propose that the Nernst signals (even those below ) are not produced by vortices at all, but by quasiparticles that occupy highly unusual electronic states – either a charge density wave with a -wave gap (DDW) Dora , or a band of uncondensed bipolaron bosons Alexandrov . In our view, these qp-based theories are not viable. “Fits” to Nernst or magnetization data seem to be based on ad hoc, unrealistic assumptions. The collective evidence, notably the adiabatic continuity from below to above , the strong correlation of the Nernst and diamagnetic signal with the SC dome, the accurate scaling between the Nernst and diamagnetic signals above , and the high-field suppression of both signals at present a strong case for a vortex-liquid origin (see Ref. WangPRB06 ).
We have benefitted from discussions with P. W. Anderson, Z. Tešanović, S. A. Kivelson, and J. C. Davis. Research at Princeton was supported by the U.S. National Science Foundation (NSF) under a MRSEC grant DMR 0213706. Research at CRIEPI was supported by a Grant-in-Aid for Science provided by the Japan Society for the Promotion of Science.The high-field experiments were performed at the National High Magnetic Field Laboratory, Tallahassee, which is supported by NSF, the U.S. Department of Energy and the State of Florida.
References
- (1) See Theory of Superconductivity, J. R. Schrieffer (Addison Wesley, 1964), ch. 8.
- (2) P. W. Anderson, Rev. Mod. Phys. 38, 298-310 (1966).
- (3) J. M. Kosterlitz and D. J. Thouless, J. Phys. C 6, 1181 (1973).
- (4) G. Baskaran, Z. Zou and P. W. Anderson, Solid State Commun. 63, 973 (1987).
- (5) S. Doniach and M. Inui, Phys. Rev. B 41, 6668 (1990).
- (6) Y. Uemura et al., Phys. Rev. Lett 62, 2317 (1989); Y. Uemura et al., Nature 364, 605 (1993).
- (7) V. J. Emery and S. A. Kivelson, Nature 374, 434 (1995).
- (8) J. Corson et al., Nature 398, 221 (1999).
- (9) Z. Xu et al., Nature 406, 486 (2000).
- (10) Yayu Wang et al., Phys. Rev. B 64, 224519 (2001).
- (11) Yayu Wang et al., Phys. Rev. Lett. 88, 257003 (2002).
- (12) Yayu Wang et al., Science 299, 86 (2003).
- (13) Yayu Wang, Lu Li and N. P. Ong, Phys. Rev. B 73, 024510 (2006).
- (14) Yayu Wang et al., Phys. Rev. Lett. 95, 247002 (2005).
- (15) Lu Li et al., Europhys. Lett. 72, 451-457 (2005).
- (16) Lu Li et al., Proceedings of M2S-HTSC-VIII, Dresden, Physica C, in press.
- (17) Vadim Oganesyan, David A. Huse and S. L. Sondhi, Phys. Rev. B 73, 094503 (2006).
- (18) S. Doniach and B. A. Huberman, Phys. Rev. Lett. 42, 1160 (1979).
- (19) Ashot Melikyan, Zlatko Tesanovic, Phys. Rev. B 71, 214511 (2005).
- (20) Z. C. Gu and Z. Y. Weng, Phys. Rev. B 72, 104520 (2005).
- (21) C. Honerkamp and P. A. Lee, Phys. Rev. Lett. 92, 177002 (2004).
- (22) H. D. Chen, O. Vafek, A. Yazdani and S. C. Zhang, Phys. Rev. Lett. 93, 187002 (2004).
- (23) S. Sachdev and E. Demler, Phys. Rev. B 69, 144504 (2004).
- (24) Leon Balents, Lorenz Bartosch, Anton Burkov, Subir Sachdev, and K. Sengupta Phys. Rev. B 71, 144508 (2005).
- (25) P. W. Anderson, Phys. Rev. Lett. 96, 017001 (2006).
- (26) F. C. Zhang, C. Gros, T. M. Rice, and H. Shiba, J. Supercond. Sci. Tech. 1, 36 (1988), cond-mat/0311604.
- (27) B. Dora et al., Phys. Rev. B 68, 241102(R) (2003).
- (28) A. S. Alexandrov and V. N. Zavaritsky, Phys. Rev. Lett. 93, 217002 (2004).