Cationic exchange in nanosized ZnFe2O4 spinel revealed by experimental and simulated near-edge absorption structure
Abstract
The non-equilibrium cation site occupancy in nanosized zinc ferrites (6-13 nm) with different degree of inversion (0.2 to 0.4) was investigated using Fe and Zn K-edge x-ray absorption spectroscopy XANES and EXAFS, and magnetic measurements. The very good agreement between experimental and ab-initio calculations on the Zn K-edge XANES region clearly show the large Zn2+(A)Zn2+[B] transference that takes place in addition to the well-identified Fe3+[B]Fe3+(A) one, without altering the long-range structural order. XANES spectra features as a function of the spinel inversion were shown to depend on the configuration of the ligand shells surrounding the absorbing atom. This XANES approach provides a direct way to sense cationic inversion in these spinel compounds. We also demonstrated that a mechanical crystallization takes place on nanocrystalline spinel that causes an increase of both grain and magnetic sizes and, simultaneously, generates a significant augment of the inversion.
pacs:
61.10 Ht; 81.20 Wk; 61.82 Rx; 75.50 TtI Introduction
Several works have demonstrated that when normal spinel ferrite ZnFe2O4 becomes nanosized displays a non-equilibrium cation distribution amongst their tetrahedral (A) and octahedral [B] sites that alters its long-range magnetic ordering and drastically enhances its magnetic response 1 ; 2 ; 3 ; 4 ; 5 . Iron (III) occupancy of both A and B-sites in nanocrystalline ZnFe2O4 has been extensively proved by Mössbauer spectroscopy 1 ; 2 ; 6 ; 7 ; 8 , nuclear magnetic resonance 5 , neutron diffraction 3 , x-ray absorption 9 ; 10 ; 11 ; 12 , and indirectly throughout magnetic measurements 2 ; 3 ; 4 ; 13 ; 14 . To a much lesser extend, Extended X-ray Absorption Fine Structure (EXAFS) studies at Zn K-edge suggest that Zn ions are transferred from its equilibrium position (sites A) to B-sites when the particle size decreases 9 ; 10 ; 11 . Conversely, there is still some lack of clarity concerning Zn non-equilibrium positions and its effects. Some results indicates that Zn non-equilibrium location produces an overpopulation of B-sites by both Zn and Fe ions 10 , while other claims that it distorts the spinel structure and brings about an amorphous state 9 . Thus, more studies are needed concerning the less-explored Zn local geometry to completely understand the origin of the non-equilibrium cation distribution in nanosized ZnFe2O4. X-ray Absorption Near Edge Spectroscopy (XANES) reflects the excitation process of a core electron to bound and quasi-bound states near to the Fermi level. Even though its intensity is around one order of magnitude larger than that of the EXAFS region and involves a reduced photon energy range (50 eV), it is dominated by multiple scattering interactions that make the interpretation of XANES spectra substantially more complicated. However, recently improved simulation tools based in ab-initio XANES calculations such as code FEFF 8.2 15 can be employed to better elucidate the XANES features and get some insight into the compound electronic structure. Here we study the non-equilibrium cation site occupancy in nanosized ZnFe2O4 and how it affects the XANES spectra at both Fe and Zn K-edges. Throughout the very good agreement between experimental and theoretical results on the Zn K-edge region we show the potentialities of this technique to straightforwardly sense the Zn2+(A)Zn2+[B] transference, in addition to the well-determined Fe3+(A)Fe3+[B] one that confer peculiar magnetic properties to nanosized ZnFe2O4. We also show that milling nanocrystalline ZnFe2O4 a considerable cation exchange occurs that increases the degree of inversion as the grain and/or particle sizes increase without altering the long-range structure.
II Experimental
ZnFe2O4 nanoferrite(sample 2ZF) was prepared by precipitating aqueous mixtures of zinc (II) and iron (III) nitrates in a ratio Zn:Fe 1:2 with aqueous ammonia. The suspension was hydrothermally processed in a Teflon-lined autoclave at 250∘C. The product was filtered, washed with distilled water and dried. Samples 2ZF4h, and 2ZF10h were obtained by high-energy ball milling nanocrystalline 2ZF for = 4 and 10 hours, respectively, in a horizontal miller (Retsch) with a stainless steel vial and one stainless steel ball (mass to powder ratio was 10:1). Bulk ZnFe2O4 was prepared by a conventional solid sate reaction. Transmission electronic microscopy was performed in a JEOL JEM-200FX microscope operating at 200 keV. Magnetic measurements were carried out using both commercial superconducting quantum interference device magnetometer and AC susceptometer. 57Fe Mössbauer spectra in the 4.2 to 300 K range of temperature were taken in transmission geometry. EXAFS and XANES spectra of the Fe K edge (7112 eV) and Zn K edge (9659 eV) were recorded at room temperature in transmission mode using a Si(111) monochromator with a slit aperture of 0.3 mm at the XAS beamline of the LNLS (Laborat rio Nacional de Luz Síncrotron) in Campinas, Brazil.
III Results and discussion
Previously 12 , X-ray diffraction studies showed that all of the samples are of single phase ZnFe2O4 cubic spinel. No amorphous components were detected. In addition, we have observed that milling causes a progressive increment of the average grain size from 6 to 13 nm 12 . Dark field TEM micrographs showed particles in the 4-20 nm range, with average sizes of 6 nm and 8 nm for 2ZF and 2ZF10h, respectively. Atomic absorption spectrometry showed that the initial Zn:Fe ratio of 1:2 was unaltered by milling. Mössbauer spectra recorded at 4.2 K showed that Fe3+ ions occupy both A and B magnetic sublattices 12 . Further, we observed that the relative area ratio site(A):site[B] doubles from 2ZF to 2ZF10h, indicating a milling-induced transference of iron ions from B to A-sites. The thermal evolution of the Mössbauer spectra (not shown) associated with susceptibility measurements (Fig. 1) provided evidence for a superparamagnetic relaxation of particle moments. The blocking temperature, TB, taken as the maximum of the in-phase ac susceptibility, ’, is 38, 135 and 220 K for 2ZF, 2ZF4h and 2ZF10h, respectively (Fig. 1). The progressive increment of TB reflects the magnetic size growth with the milling. The S-shapes displayed by the M-H curves (Fig. 1) evidence magnetic states with spontaneous magnetization. Further, the magnetic response rather increases by increasing the milling time as seen by the increment of the saturation magnetization MS (at T=5 K, MS= 35, 57 and 68 emu/g for 2ZF, 2ZF4h and 2ZF10h, respectively). There is also an increment of the magnetic hardness with the grain size (the coercive fields are 87 and 198 Oe for 2ZF and 2ZF10h, respectively).
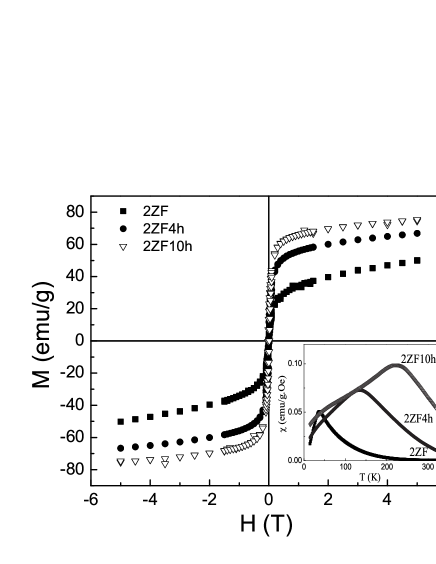
These magnetic and Mössbauer results are compatible with a
ferrimagnetic state of the nanoferrites.
The (k) EXAFS signal
was extracted using the Athena program and analyzed using the
Arthemis program 16 . Fourier transform (FT) of (k) at
Zn and Fe K-edges without phase correction are shown in Fig. 2 and
fit results are summarized in Tables I and II, respectively.

Similarly to previous works 9 ; 10 ; 11 , there is a reduction of the amplitude of the main peaks when compared to bulk ZnFe2O4, associated with the local structural disorder at particle surface layer. Ideally, in normal ZnFe2O4 the zinc atoms are tetra-coordinated by oxygens at 1.996 Å and 12 Fe atoms are at 3.500 Å as second neighbors. On the other side, iron atoms are surrounded by 6 O at 2.018 Å and 6 Fe atoms at 2.995 Å as second neighbors. We observe that the EXAFS spectra resemble that of the bulk material evidencing that the local structure is almost preserved in nanosized ZnFe2O4 (Tables I and II).
| Sample | Shell | N | R(Å) | [Å-2] | ||
|---|---|---|---|---|---|---|
| 2ZF | O | 5.5(9) | 1.96(3) | 0.7(2) | -5(2) | 22 |
| 2ZF10h | O | 5.8(9) | 1.97(3) | 0.8(2) | -5(2) | 38 |
*A third cumulant was used to fit these shells. Values obtained were 7(2) and 8(3) for 2ZF and 2ZF10h , respectively.
| Sample | Shell | N | R(Å) | [Å-2] | ||
| O* | 4.6(8) | 2.01(2) | 0.66(2) | 6(1) | 20 | |
| 2ZF | Fe | 13(2) | 3.51(1) | 1.08(2) | 6(1) | - |
| O | 13(2) | 3.54(1) | 1.08(2) | 6(1) | - | |
| Fe | 4.4(8) | 3.66(1) | 1.08(2) | 6(1) | - | |
| O* | 4.9(8) | 2.04(2) | 0.9(2) | 3.6(8) | 44 | |
| Fe | 0.8(4) | 2.94(3) | 0.3(1) | -2.6(8) | - | |
| 2ZF10h | Fe | 11(2) | 3.49(1) | 1.0(2) | 3.6(8) | - |
| O | 11(2) | 3.52(1) | 1.0(2) | 3.6(8) | - | |
| Zn | 3.8(8) | 3.62(1) | 1.0(2) | 3.6(8) | - |
However, an additional peak appears in the FT of the Zn K-edge
spectrum of 2ZF10h sample (Fig. 2, see arrow). When Zn atoms occupy
B-sites, a new shell of Fe atoms would appear at R=2.980 Å from
central Zn. Thus, the similar coordinate R obtained from our fit
(Table II) indicates that the new peak corresponds to Zn
octahedrally coordinated, as reported in References. 9 ; 10 ; 11 .
The fact that this peak is clearly resolved indicates a large cation
transference Zn+2(A)Zn+2[B] in 2ZF10h. From
these EXAFS analysis at both Fe and Zn K-edges we have determined
the degree of inversion, , that represents the site
occupancy as (Zn1-cFec)[ZncFe2-c]O4, where ( ) and
[ ] refer to A and B sites, respectively (Tables I and II).
Further, the values obtained from Zn and Fe edges independently are
both in good agreement with each other. This discards any site
overpopulation in our samples. All the above results show that
milling nanosized ZnFe2O4 produces an increment of both the
grain and magnetic sizes but keeping a nanometric characteristic
length, and, at the same time, the inversion increases. We
demonstrate that the augment of the degree of inversion in
ZnFe2O4 is not directly associated with a surface effect due
to the grain size reduction but with the synthesis process,
something that was not clearly stated in previous studies
2 ; 3 ; 4 ; 11 . In particular, high-energy ball-milling process
activates an order-disorder transformation independently whether it
is causing an increment or a reduction of the grain/particle sizes.
In the following, we analyze how the near-edge x-ray absorption
structure at Fe and Zn K-edges are affected by the spinel inversion.
Figures 3 and 4 show the Fe-K and Zn-K XANES spectra for nanosized
and bulk ZnFe2O4 respectively. The peak broadening is probably
related to cation distribution amongst locally disordered sites
whose energy transition varies according to the average bond length
17 .

Fe-K pre-edge structure arises from electronic 1s3d quadrupole and 1s3d/4p (hybridized orbitals) dipole transitions 18 . In agreement with Mössbauer results, the pre-edge position is compatible with a Fe3+ oxidation state 19 .The integrated intensity of the pre-peaks region progressively increases for 2ZF, 2ZF4h and 2ZF10h with respect to the bulk compound (see inset in Fig. 3). This is due to the increment of the degree of orbital p-d mixing as more central Fe atoms occupy non-centrosymmetric A-sites as follows: 2ZF2ZF4h2ZF10h. Above the edge, the decrease in amplitude of the white line would also indicate the presence of Fe3+ in a four-coordinated surrounding 17 , although, no other remarkable differences were detected in the Fe-K XANES region.

The most striking features due to cation exchange in ZnFe2O4 appear at the Zn-K edge (Fig. 4), which reflects the electronic transition from zinc 1s core level to unoccupied states of p type. Zn-K XANES of normal ZnFe2O4 consists of three resolved peaks at 9664, 9666.3 (see line A1 in Figs. 4 and 5) and 9672.4 eV, and a significant shoulder at 9676.7 eV (see line A2 in Figs. 3 and 4) at the white line region plus additional structure at higher energies (Fig. 4) 20 . The spectrum of 2ZF nanoferrite shows some differences at the second feature and the shoulder region (Fig. 4). Furthermore, by increasing inversion the peak positions slightly shift to lower energies, the second feature notably increases in amplitude and the shoulder weakens. To further study the inversion effects on the Zn-K electronic structure, we have performed XANES simulations using FEFF 8.2 code 15 . Here, we have considered the Hedin-Lundqvist exchange potential with imaginary part of 0.5 eV to simulate experimental broadening 21 . The Z + 1 approximation (Z, atomic number) for the absorber atom was essential to account for the three main peaks and thus reproduce accurately the experimental data. A 57 atoms cluster (radius of 0.57 nm) was used to calculate the self-consistent field (SCF) muffin-tin atomic potential, and a 185 atoms cluster (radius of 0.805 nm) for the full-multiple scattering (FMS) XANES calculations. For convergence analysis, simulations considering up to 390 atoms (radius of 1.000 nm) and 112 atoms (radius of 0.650 nm) for the FMS and SCF calculations were performed, respectively, and they did not show differences from the results shown here. During the simulation process, the normal spinel ZnFe2O4 was used as model structure. The simulated absorption spectrum of the Zn atoms in tetrahedral site was obtained using this normal structure. On the other way, to calculate the spectrum of the Zn absorber in octahedral site, a Zn atom substituted a Fe atom of the model structure, and this Zn atom was used as the absorber during calculations. Figure 4 shows the theoretical XANES spectrum of normal ZnFe2O4. The theoretical data was shifted in order obtain a better agreement between the experimental and theoretical ZnFe2O4 spectra, and all the other theoretical data shown here were shifted by this same value. The very good agreement between experimental and simulated data is evident just by inspection on the main features of the absorption spectra. In addition, the same tendency with the degree of inversion (i.e. transferring Zn atoms from sites with to symmetry) can be observed in simulated set of XANES spectra. Indeed, Fig. 5 shows the theoretical calculation for an isolated Zn atom substituting Fe at an octahedral site in normal ZnFe2O4 structure (Fig. 5 (a)).

It is worth noticing the coincidence between the positions of the second peak of the ZnFe2O4 structure (line ) and the white line of the Zn substitutional to Fe in ZnFe2O4 structure. The substitution of the second and/or fourth coordination shells around the absorber atom, by Zn or Fe atoms, give no significant changes, but causes slight variations in the relative heights of the three main peaks near the edge. The effect on theoretical XANES spectra of increasing Zn population at B sites in ZnFe2O4 (Fig. 5(b)) was calculated by the weighted sum of both normal spinel spectrum (Zn in tetrahedral site, shown in Fig. 4) and the spectrum of a Zn absorber substitutional to Fe atom, at the octahedral B sites (Fig. 5 (a)). The four spectra in figure 5 (b) were obtained using weights of 0.0, 0.1, 0.2 and 0.3 for the Zn in octahedral B sites (the degree of inversion), and consequently weights of 1.0, 0.9, 0.8 and 0.7 for Zn in normal tetrahedral A sites. Arrows in Figure 5 indicate the tendency of each feature with increasing inversion. The results show not only the intensity enhancement at 9666.3 eV (see line A1 in Figs. 4 and 5) but also the amplitude reduction of the shoulder near 9676.7 eV (see line A2 in Figs. 4 and 5), with increasing concentration of Zn at the otherwise Fe equilibrium location in ZnFe2O4. Both trends coincide with those observed experimentally, showing the important local structural changes in nanostructured zinc ferrite that involve a considerable zinc cation transference from A to B sites that modifies its electronic structure. It is worth mentioning that when we consider a weight of 0.5 for the Zn in octahedral B sites the main features of the XANES disappears and the white line dominates the spectrum shape.
IV Conclusions
Summarizing, chemically prepared ZnFe2O4 nanocrystalline
displays an inverted structure that changes its long-range magnetic
order and enhances its magnetic response with respect to bulk
antiferromagnetic material. This is in accordance with all previous
results on nanosized ZnFe2O4 independently on the synthesis
procedure. We demonstrate that the mechanical crystallization that
takes place on nanocrystalline spinel, which involves both grain and
apparent magnetic size growth, is also accompanied by a significant
augment of the inversion. This result shows that the inversion
involves the whole particle and is not only restricted to a more
distorted surface layer. On the other hand, XANES results give a
direct proof of the non-equilibrium cation distribution through the
Fe K-edge pre-edge features but mainly through Zn K-edge features,
which change due to the particular configuration of the ligand
shells surrounding the absorbing atom. These features are
intensified by the cationic swap originated by transferences of type
Zn2+(A)Zn2+[B] and
Fe3+[B]Fe3+(A) that take place preserving the
structural long-range order of the compound. Thus, superexchange
interactions Fe3+[B]O-2Fe3+(A) emerge and
confer ZnFe2O4 a cluster glass or ferrimagnetic magnetic
behavior 3 . The large zinc occupancy of octahedral sites that
we found cause broken superexchange A-B paths by the presence of
non-magnetic ions (Zn2+) that, in addition to an inhomogenously
distributed inversion, bring about regions where ferrimagnetic A-B
or antiferromagnetic B-B interactions coexist 5 . On the other
hand, considering that the magnetic properties of ferrimagnetic
material are critically dependent on site occupancy, XANES approach
as outlined here promises to be an important tool in determining the
structure of these materials. Further, our results encourage future
effort to understand the electronic structure throughout the unusual
Zn K-edge near-edge features of ZnFe2O4 20 or
investigate suggested electron density anomalies in nanosized
ZnFe2O4 22 .
Acknowledgements.
We appreciate financial support by LNLS synchrotron, Campinas - SP, Brazil (project D04B - XAFS1 4148/05); ANPCyT, Argentina (PICT03 06-17492); CONICET, Argentina (PIP 6524 and PIP 6075). DC magnetic measurements were performed using the RN3M facilities. We thank E. D. Cabanillas for TEM microscope operation and F. Sives for fruitful discussions.References
- (1) H. H. Hamdeh, J. C. Ho, S. A. Oliver, R. J. Willey, G. Oliveri, G. Busca, J. Appl. Phys. 81, 1851 (1997)
- (2) C. N. Chinnasamy, A. Narayanasamy, N. Ponpandian, K. Chattopadhyay, H. Gu rault, J-M. Greneche, J. Phys. Condens. Matter 12, 1 (2000)
- (3) M. Hofmann, S. J. Campbell, H. Ehrhardt, R. Feyerherm, J. Mater. Sci. 39, 5057 (2004)
- (4) M. K. Roy, B. Haldar, H. C. Verma, Nanotechnology 17, 232 (2006)
- (5) J. H. Shim, S. Lee, J. H. Park, S-J Han, Y. H. Jeong, Y. W. Cho, Phys. Rev. B 73 064404 (2006)
- (6) F. S. Li, L. Wang, Q. G. Zhou, X. Z. Zhou, H. P. Kunkel, G. Williams, J. Magn. Magn. Mat. 268, 332 (2004)
- (7) S. A. Oliver, H. H. Hamdeh, J. C. Ho, Phys. Rev. B 60, 3400 (1999)
- (8) E. J. Choi, Y. Ahn, K. C. Song, J. Magn. Magn. Mat., in press
- (9) B. Jeyadevan, K. Tohji, K. Nakatsuka, J. Appl. Phys. 76, 6325 (1994)
- (10) S. A. Oliver, V. G. Harris, H. H. Hamdeh, J. C. Ho, Appl. Phys. Lett. 76, 2761 (2000)
- (11) S. Ammar, N. Jouini, F. Fi vet, O. Stephan, C. Marh ic, M. Richard, F. Villain, Ch. Cartier dit Moulin, S. Brice, Ph. Sainctavit, J. Non-Cryst. Solids, 345-346, 658 (2004)
- (12) S. J. Stewart, S. J. A. Figueroa, M. B. Sturla, R. B. Scorzelli, F. García, F. G. Requejo, Physica B, doi:10.1016/j.physb.2006.07.045 (2006)
- (13) A. Kundu, C. Upadhyay, H. C. Verma, Phys. Lett. A 311, 410 (2003)
- (14) R. D. K. Misra, S. Gubbala, A. Kale, W. F. Egelhoff Jr., Mat. Scie. Lett. B 111, 164 (2004)
- (15) J. J. Rehr, R.C. Albers, C.R. Natoli, E.A. Stern, Phys. Rev. B 34, 4350 (1986)
- (16) B. Ravel, M. Newville J. Synchrotron Rad. 12, 537 (2005)
- (17) G. A. Waychunas, M. J. Apted, G. E. Brown Jr, Phys. Chem. Minerals 10, 1-9 (1983)
- (18) F. de Groot, Chem. Rev. 101, 1779 (2001)
- (19) M. Wilke, F. Farges, P-E. Petit, G. E. Brown Jr., F. Martin, American Mineralogist 86, 714 (2001)
- (20) G. A. Waychunas, C. C. Fuller, J. A. Davis, J. J. Rehr, Geochim. Cosmochi. Acta 67, 1031 (2003)
- (21) M. Roy and S. J. Gurman, J. Synchrotron Rad. 8, 1095 (2001)
- (22) C. Upadhyay, H. C. Verma, Appl. Phys. Lett. 85, 2074 (2004)