Wrinkling of a bilayer membrane
Abstract
The buckling of elastic bodies is a common phenomenon in the mechanics of solids. Wrinkling of membranes can often be interpreted as buckling under constraints that prohibit large amplitude deformation. We present a combination of analytic calculations, experiments, and simulations to understand wrinkling patterns generated in a bilayer membrane. The model membrane is composed of a flexible spherical shell that is under tension and that is circumscribed by a stiff, essentially incompressible strip with bending modulus . When the tension is reduced sufficiently to a value , the strip forms wrinkles with a uniform wavelength found theoretically and experimentally to be . Defects in this pattern appear for rapid changes in tension. Comparison between experiment and simulation further shows that, with larger reduction of tension, a second generation of wrinkles with longer wavelength appears only when is sufficiently small.
pacs:
46.32.+x, 46.70.Hg, 46.25.-yI Introduction
Under excessive load a rigid body will buckle. A classic analysis of buckling dates to Euler who considered a thin rod under compressive stress along its axis. Above a critical stress the rod deforms with a wavelength twice as long as the rod, as the system relieves compressive energy at the expense of bending energy. Variations of Euler buckling appear in a range of geometries; however, under certain constraints, deviations from this behavior occur, and shorter wavelength patterns emerge. For example, rods subjected to a sudden compression buckle dynamically with a wavelength that scales inversely with the impacting stress Gladden et al. (2005). A second example is the buckling of microtubules in biological cells for which the wavelength is reduced due to mechanical coupling to the surrounding cytoskeleton that energetically penalizes large amplitude deviations Brangwynne et al. (2006). A related, well studied phenomenon occurs in the wrinkling of stiff elastic membranes attached to thick soft substrates Allen (1969); Bowden et al. (1998); Groenewold (2001); Cerda et al. (2002); Cerda and Mahadevan (2003); Efimenko et al. (2005). Stretching of the substrate makes large amplitude, and hence long wavelength, deformations prohibitive, and the membrane wrinkles with a wavelength set by a compromise between the bending and stretching energies. A number of applications have been advanced that exploit the resulting periodic modulation such as in diffraction gratings Harrison et al. (2004), stretchable electronics Lacour et al. (2003); Khang et al. (2006) and metrological tools Stafford et al. (2004), indicating the potential of membrane wrinkling as an approach for patterning materials.
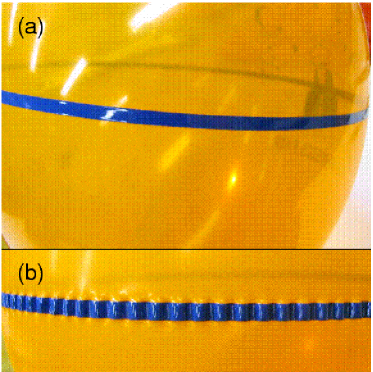
In order to explore the variety of contexts in which one can controllably wrinkle membranes, we present a model of a bilayer membrane with a constraint that similarly prohibits long wavelength deformations. The membrane is composed of an inner layer that is a flexible spherical shell and an outer layer that is a stiff strip circumscribing the sphere. Initially, the sphere is stretched under an isotropic tension, while the strip layer is free of stress. When the tension on the sphere is reduced sufficiently, its radius decreases, and the strip buckles with a well defined wavelength. We have investigated this bilayer system in simple experiments by applying thin strips of paint around the equator of inflated rubber balloons, as shown in the photograph in Fig. 1(a). When the air pressure in the balloon is reduced, the strip wrinkles with a wavelength that is much smaller than the radius of the balloon, as illustrated in Fig. 1(b). Comparing measurements of this wavelength with quantitative analytic results, we determine the dependence of on other measurable parameters. Notably, we find that depends on the stiffness of the strip but is independent of the elastic properties of the spherical membrane to lowest order, giving this geometry a potential advantage as a metrological approach for determining the bending modulus of thin stiff films. We further show how defects in the wrinkling pattern form when the pressure is reduced rapidly. We also introduce a numerical model for the system, which we employ to explore hierarchical structures that can emerge with large reductions in pressure.
II Calculation of the Instability Wavenumber
In considering the energetics of the system, we approximate the sphere to be perfectly flexible, so that no bending energy is associated with its deformation, while assuming the strip is inextensible so that its length is conserved. We further parameterize the distance from the center of the sphere to the strip in polar coordinates, , and assume that the wrinkling instability forms a sinusoidal deformation in the strip, , where specifies the wavenumber. The objective of the calculation is to determine the wavenumber at the initial instability, where grow infinitesimally from . In particular, we assume for any finite , where is the initial radius of the balloon. In order to find the wavenumber, we need to calculate the total energy of the system to . The inextensibility of the strip implies that
| (1) |
where is the element of strip length, , and we make use of the infinitesimal nature of to expand the integrand. We thus obtain
| (2) |
Upon reduction of the air pressure in the balloon, the relevant mechanical energy of the bilayer has three separable contributions. The first is the energy associated with bending the strip, which has the form
| (3) |
where is the strip’s bending modulus and is the local curvature,
| (4) |
Inputting Eq. (4) in (3) and again expanding in powers of , we obtain
| (5) |
We note that the first harmonic () has zero bending energy because it amounts to a mere shift of the strip in space as long as , and the lowest harmonic affecting the shape of the strip is .
The second contribution to the energy arises from the inward force that the rubber at the edges of the strip applies as the sphere deflates and its equilibrium radius decreases. This force per unit length (two-dimensional analog of pressure) is where is the angle between the strip and the rubber membrane at the edge of the strip, as illustrated in the inset to Fig. 2(a), and is the tension of the balloon. The associated energy is
| (6) |
where is the area enclosed by the strip. Again, the first harmonic costs no energy because it does not affect the shape of the strip. We note that this expression is strictly correct only prior to the initial instability. After the instability should acquire an dependence on that could affect the subsequent development of the instability but should not impact the instability wavenumber at the onset.
If the total energy of the bilayer were only , then the minimum energy solution for buckling would correspond to the lowest available harmonic, , and the instability would follow the analog of the Euler result for a circle: the strip would buckle into an ellipse. However, the elastic nature of the sphere changes this situation in a dramatic way because the additional stretching of the membrane introduced by a sinusoidal deformation penalizes large amplitude, long-wavelength deformations. To evaluate this elastic contribution, we consider the limit where the radius of the balloon is much larger than the width of the strip, so that the region of the rubber membrane affected by the strip can be treated essentially as a cylindrically symmetric system of radius . The solution we will reach is consistent with this approximation. As long as the deformations of the membrane are small compared to the radius, the shape of the elastic membrane near the strip will obey Laplace’s equation Fulop (1955). In cylindrical coordinates this is
| (7) |
where specifies the direction along the balloon perpendicular to the strip and is the local deviation of the distance from the center to the surface of the membrane away from the average radius. The energy associated with the elastic deformation of the rubber is
| (8) |
where is again the tension of the sphere. Using the ansatz , as suggested by Eq. (2) (with and ), Laplace’s equation becomes
| (9) |
Hence . That is, the deformation of the balloon decays exponentially as a function of distance from the paint strip with decay length , and this result justifies the cylindrical approximation as long as the instability wavenumber is sufficiently large Using this solution in the energy of Eq. (8) gives
| (10) |
Therefore, the total energy we must consider is . Anticipating that the instability occurs at a high wavenumber we neglect the difference between and . In this approximation the total energy of the strip to is
| (11) |
As a function of , this energy has a minimum at given by the condition . The instability occurs when . Thus, we obtain the set of equations
| (12) |
Solving these, we find that the instability occurs at the wavenumber
| (13) |
The balloon pulls on the strip at an angle such that
| (14) |
The angle is small if .
III Measurements of Initial Instability
To compare the wavenumber of the instability predicted by Eq. (13) with that produced experimentally, we fabricated a set of bilayer membranes like those shown in Fig. 1. Nominally spherical balloons were inflated to an initial pressure of approximately Pa, corresponding to an initial radius of approximately 0.15 m. Paint (Krylon, “Fusion for Plastic”) was applied to each balloon in a strip about the equator. The strip width was kept sufficiently narrow, mm, to neglect the curvature of the balloon across the width. To assure uniform application of the paint, each balloon was mounted on a turntable, and the paint was applied with an aerosol spray can positioned 0.3 m from the balloon, while the balloon rotated at an angular velocity of 60 RPM. Paper shields taped to the balloons exposed the 5 mm wide region around the balloons’ equator to the paint. To tune the thickness and hence the bending rigidity of the strip, the paint was applied in multiple thin coats, with a delay of approximately 2 minutes between each coat for the paint to set. The final thickness of the paint layers for different balloons was varied between 25 m and 160 m, while the variability in thickness of any individual strip was less than 10%.
After the painting, the balloons were left undisturbed for 18 hours to allow the paint to dry fully. To investigate the wrinkling instability, we measured the circumference of the strip to obtain and then slowly released air from each balloon until deformations in the strip appeared like those in Fig. 1(b). The final air pressure in the balloon was then measured. A measuring tape was carefully fastened to the balloon parallel to the wrinkled strip, and we determined the final balloon radius , which was typically about 5% smaller than . Digital photographs of the strips were taken, and image analysis was performed to extract the wavelength of the undulations. Measurements of were made at several points around the circumference of each balloon. From these results an average as a function of thickness was obtained. The bending modulus of a paint strip can be related to its thickness by where is the Young’s Modulus and is the Poisson ratio Landau and Lifshitz (1986), which through Eq. (13) leads to the prediction
| (15) |
where the tension is related to the final pressure by .
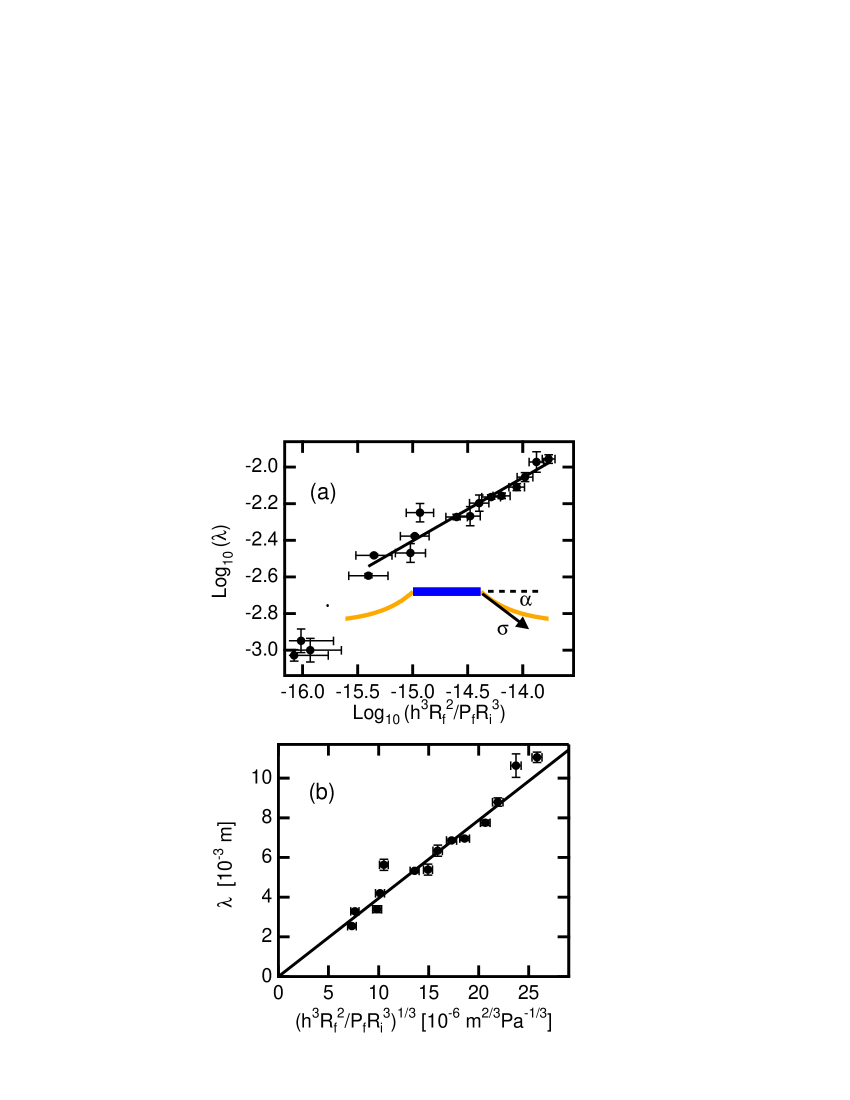
Figure 2 displays the results for determined from a set of strips with different paint thicknesses. The wavelength is plotted in Fig. 2(a) against on logarithmic scales to test the scaling relation predicted by Eq. (15). The error bars associated with the abscissa in Fig. 2 result primarily from the 10% variability in the paint thickness , while the uncertainties in reflect the spread in the measured values for each thickness, which again presumably results primarily from the variability in for each balloon. As Fig. 2(a) demonstrates, the results for sufficiently large support the scaling prediction in Eq (15) well, as evidenced by the result of a power-law fit, , shown by the solid line. Excluded from the fit are three data points at the smallest , which deviate from this scaling. Observations of the onset of the instability indicated that the assumption of inextensibility of the strip was not valid at these smallest values of . Specifically, we observed that the wrinkles annealed away moments after their formation, indicating that the thinnest paint layers are able to contract to relieve the stress. Relaxation of the inextensibility condition modifies the constraint on the modulation amplitude , expressed in Eq. (2), ultimately changing the resulting scaling to Concha et al. . No such contraction of the paint strip was visible at larger where the results display good agreement with the predicted scaling.
In order to test the wavelength prediction in Eq. (15) quantitatively, we display in Fig. 2(b) versus on linear scales, excluding the three points at smallest . Assuming a Poisson ratio typical for an acrylic elastomer, , we extract from the fit the Young’s modulus of the painted layer, Pa, a very reasonable value for the paint. As a way to correlate this value with another measurement, we performed an additional experiment using the cantilever method to obtain the Young’s modulus. The results of that experiment gave Pa, in good agreement with the value extracted from the wrinkling instability, further indicating the quantitative validity of Eq. (15).
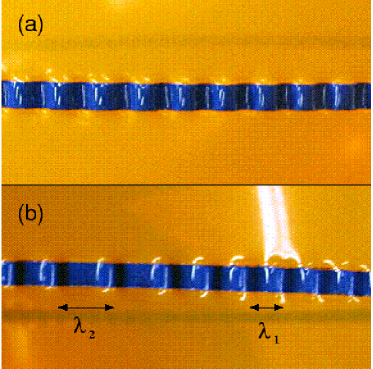
We note that highly uniform wrinkling patterns, like those in Fig. 1(b), form reliably when the pressure in the balloon is decreased sufficiently slowly. In contrast, when the balloon is rapidly deflated, defects in the pattern appear. Figure 3(a) shows a photograph of the highly periodic modulation formed from slow deflation, while Fig. 3(b) shows a pattern formed by rapidly deflating a balloon at a rate Pa/s. In addition to regions with the wavelength expected from Eq. (15), labeled , the pattern displays regions with distinctly longer wavelength, such as . Similar defects appear commonly in wrinkling phenomena Bowden et al. (1998); Efimenko et al. (2005). Their appearance in the strip following rapid deflation suggests that they are a consequence of non-simultaneity of wrinkle nucleation in different regions around the circumference. When the incommensurate modulations in such different regions meet, the adjoining segments must adopt non-optimal wavelengths to match the regions smoothly. Unfortunately, difficulty in controlling quantitatively the deflation rate at high rates prevented us from investigating this effect in detail.
IV Second Generation Wrinkling: Experiments and Modeling
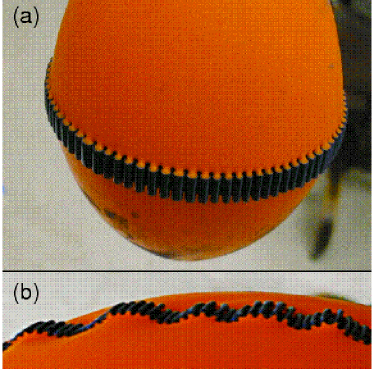
As the pressure in the balloon is further reduced beyond the onset of the instability, the experiments display one of two effects on the wrinkling pattern. For large paint thickness and hence for large , a uniform pattern persists, and the amplitude of the wrinkles grows until the pattern becomes highly corrugated, as shown in Fig. 4(a). For smaller , a second larger-wavelength modulation emerges, as shown in Fig. 4(b). This second wavelength recalls the hierarchical, self-similar patterns observed recently in the wrinkling of stiff surfaces on soft thick substrates Efimenko et al. (2005).
To investigate the emergence of this second generation of wrinkles, we simulate the bilayer with a discrete model similar to one introduced previously to study membrane elasticity Seung and Nelson (1988). The membrane is approximated by two concentric circular chains of particles. Each chain has particles, with and specifying the position of the particle in the outer and inner chains, respectively. The bending of the membrane is specified through unit vectors for each particle on the outer chain, where the vector orientation is defined as normal to the line connecting the particle’s two nearest neighbors on the chain. The membrane energy is defined as
| (16) |
where the first term sets the bending energy, with determining the bending modulus, and the second term specifies the stretching energy, with spring constants and determining the compression modulus of the inner and outer chains, respectively. The third term couples each particle to its neighbor in the other chain through a spring force with constant , and the equilibrium bond length sets the thickness of the membrane. The simulations begin with both chains forming undistorted circles, which minimizes both the bending and stretching energies, and with the inner circle having a radius . The initial equilibrium bond lengths and are set at values determined by and such that the initial stretching energy is zero. To simulate the shrinkage of the inner layer, we decrease the equilibrium bond length in the inner chain in small steps keeping all other variables constant. Typically, , where is the initial bond length. After each step, the particle positions, and , are adjusted to minimize the energy, Eq. (16), using the conjugate gradient method Press et al. (1986). After a certain number of steps, the circular symmetry is suddenly broken and the membrane deforms with a small amplitude, small wavelength pattern. This wrinkling is preferred energetically over deformation into an Euler-like ellipse because the small wavelength pattern enables the two chains to maintain a larger length difference, thus reducing their respective stretching energies, while avoiding a large separation between chains that would contribute a large energy from the term coupling the chains together. Thus, in the simulations the coupling between the inner and outer chains provides the constraint that prohibits large amplitude deformations.
We find the wrinkling of the simulated membranes displays many of the salient features observed experimentally. For example, defects like those in Fig. 3(b) develop when the step size for the shrinkage is made large. The wavelength in the simulations is observed to scale with bending constant as , in contrast to the scaling predicted by Eq. (15) and observed in Fig. 2(a). We ascribe this difference to the extensibility of the outer chain in the simulations, which as described above is expected to alter the scaling. A detailed description of these findings will be presented elsewhere Concha et al. . Here, we focus on the behavior as the equilibrium radius of the inner chain is further reduced beyond the onset of the instability. In agreement with experiment, the amplitude of the wrinkles grows, and eventually a second generation of longer-wavelength wrinkles suddenly appears only if the bending constant is sufficiently small. The onsets of the first and second generation instabilities are easily identified by the sudden appearance of pronounced peaks in the Fourier power spectrum of the particle displacements. The inset to Fig. 5 shows examples of such Fourier spectra shortly before and immediately after the formation of second generation wrinkles in a simulation.

Figure 5 displays the total change in normalized by at which the first and second generation wrinkle patterns appear in a series of simulations with varying bending constant . Above a certain value of , the second generation of wrinkles never appears, and instead the amplitude of the first generation continues to grow until the simulations break down. (Breakdown occurs when the inner chain passes through the outer chain, reminiscent of the experimental situation at large in which the first generation modulation grows to the point that is no longer single valued.) Strikingly, the strain amplitudes at which the first and second generation wrinkles appear display very similar quasi-power-law dependence on . As suggested previously Efimenko et al. (2005), the membrane with first generation wrinkles can be viewed as a membrane with a larger effective thickness and larger effective bending modulus, which in turn wrinkles with a larger wavelength to create the hierarchical pattern. The similarity between the curves in Fig. 5 lends support to this picture, suggesting that the second generation instability can be mapped to the first through a simple renormalization of that would lead naturally to self-similar structures.
V Concluding Remarks
In summary, this simple system of a stiff strip on a spherical membrane has allowed us to investigate in detail a buckling instability in which a constraint enforces a small wavelength deformation. In this case, the constraint derived from the large energy cost of membrane stretching that would accompany an Euler-like, large amplitude buckling deformation. As a final perspective on the consequences of this constraint, we note briefly that one can formulate this contribution to the energy in terms of a long-range interaction between local deformations of the different parts of the strip. Specifically, above we analyzed the energy of small fluctuations of the local strip radius for a given harmonic . In a more general case the total energy (11) can be written in terms of the Fourier transform of :
| (17) |
where is the position measured along the strip. The first two terms – the bending and pressure energies – have regular Fourier transforms, whereas the elastic term has a kink singularity at . Returning to real space we find that the bending and pressure energies become local terms containing spatial derivatives. The singular elastic term translates into a long-range interaction:
| (18) |
where the interaction kernel is
| (19) |
and the parameter is an ultraviolet cutoff regularizing the short-distance behavior of the interaction. This identification of the constraint with an effective long-range interaction suggests a method for mapping such wrinkling phenomena onto other condensed matter systems where competition between long-range and short-range interactions lead to pattern formation, such as for example in the creation of stripe domains in thin ferromagnetic films Kashuba and Pokrovsky (1993). An interesting direction for further study would be to investigate whether such an approach can aid in understanding and predicting wrinkling behavior in less simple situations and further whether it might lend insight into cases in nature, such as the buckling of biological membranes during growth Drasdo (2000), in which the membranes are observed to wrinkle.
Acknowledgments: We thank A. Belmonte and R. Cammarata for helpful discussions and L. Sung for useful correspondence. Funding was provided by the NSF under grants DMR-0134377 and DMR-0520491.
References
- Gladden et al. (2005) J. R. Gladden, N. Z. Handzy, A. Belmonte, and E. Villermaux, Phys. Rev. Lett. 94, 035503 (2005).
- Brangwynne et al. (2006) C. P. Brangwynne, F. C. MacKintosh, S. Kumar, N. A. Geisse, J. Talbot, L. Mahadevan, K. K. Parker, D. E. Ingber, and D. A. Weitz, J. Cell Biol. 173, 733 (2006).
- Allen (1969) H. G. Allen, Analysis and Design of Structural Sandwich Panels (Pergamon, New York, 1969).
- Bowden et al. (1998) N. Bowden, S. Brittain, A. G. Evans, J. W. Hutchinson, and G. M. Whitesides, Nature 393, 146 (1998).
- Groenewold (2001) J. Groenewold, Physica A 298, 32 (2001).
- Cerda et al. (2002) E. Cerda, K. Ravi-Chandar, and L. Mahadevan, Nature 419, 579 (2002).
- Cerda and Mahadevan (2003) E. Cerda and L. Mahadevan, Phys. Rev. Lett. 90, 074302 (2003).
- Efimenko et al. (2005) K. Efimenko, M. Rackaitis, E. Manias, A. Vaziri, L. Mahadevan, and J. Genzer, Nature Mater. 4, 293 (2005).
- Harrison et al. (2004) C. Harrison, C. M. Stafford, W. Zhang, and A. Karim, Appl. Phys. Lett. 85, 4016 (2004).
- Lacour et al. (2003) S. P. Lacour, S. Wagner, Z. Huang, and Z. Suo, Appl. Phys. Lett. 82, 2404 (2003).
- Khang et al. (2006) D.-Y. Khang, H. Jiang, Y. Huang, and J. A. Rogers, Science 311, 208 (2006).
- Stafford et al. (2004) C. M. Stafford, C. Harrison, K. L. Beers, A. Karim, E. J. Amis, M. R. Vanlandingham, H. Kim, W. Volksen, R. D. Miller, and E. E. Simonyi, Nature Mater. 3, 545 (2004).
- Fulop (1955) W. Fulop, Br. J. Appl. Phys. 6, 21 (1955).
- Landau and Lifshitz (1986) L. D. Landau and E. M. Lifshitz, Theory of Elasticity (Pergamon, New York, 1986).
- (15) A. Concha, P. Mellado, J. W. McIver, and R. L. Leheny, eprint in preparation.
- Seung and Nelson (1988) H. S. Seung and D. R. Nelson, Phys. Rev. A 38, 1005 (1988).
- Press et al. (1986) W. H. Press, B. P. Flannery, S. A. Teukolsky, and W. T. Vetterling, Numerical recipes: the art of scientific computing (Cambridge, New York, 1986).
- Kashuba and Pokrovsky (1993) A. B. Kashuba and V. L. Pokrovsky, Phys. Rev. B 48, 10335 (1993).
- Drasdo (2000) D. Drasdo, Phys. Rev. Lett. 84, 4244 (2000).