Anisotropy and Penetration Depth of MgB2 from 11B NMR
Abstract
The 11B NMR spectra in polycrystalline MgB2 were measured for several magnetic fields (1.97 T and 3.15 T) as a function of temperature from 5 K to 40 K. The composite spectra in the superconducting state can be understood in terms of anisotropy of the upper critical field, , which is determined to be 5.4 at low temperature. Using Brandt’s algorithmBrandt the full spectrum, including satellites, was simulated for the temperature 8 K and a magnetic field of 1.97 T. The penetration depth was determined to be Å, and the anisotropy of the penetration depth, , was estimated to be close to one at low temperature. Therefore, our findings establish that there are two different anisotropies for upper critical field and penetration depth at low temperatures.
pacs:
PACS numbers:74.70,74.25Nf,74.25Ot,74.20DeThe discovery of unusually high superconductive transition temperatures of MgB2, a simple bimetallic compound superconductorR1 , has attracted considerable interest from both theory and experiment. Reconsideration and extension of BCS theory to two-band superconductivity has successfully accounted for experimental observationsChoi ; Lyard ; Rydh ; Cubitt ; Kogan1 ; Kogan2 . Nonetheless, the relation between anisotropy of the upper critical field and the penetration depth is still a controversial issue. Generally there are two points of view. One holds that there exist two different anisotropies at low temperatures, and , for upper critical field and penetration depth respectively. They have different temperature dependence and merge at a common value at TcKogan1 ; Golubov ; Fletcher . The other perspective is that there is only one anisotropy parameter, and it is field dependentLyard ; Angst1 ; Zehetmayer . Moreover, small angle neutron scattering (SANS) gives different results on the penetration depth anisotropy on single crystal and powder MgB2 samplesCubitt ; Cubitt06 ; Eskildsen06 . In general, it is more of a challenge to determine the absolute value of the penetration depth as compared with its temperature dependence. Although muon spin resonance (SR)Son00 and nuclear magnetic resonance (NMR) methodsRey97 have often been used to obtain an absolute value of the penetration depth, the application of these resonance techniques to determine the penetration depth for an anisotropic superconductor with a sample consisting of a randomly oriented powder has never been attempted until now.
NMR and electron spin resonance (ESR) have been used previously to investigate the anisotropy of MgB2. Two different components of the resonance signal have been identified in the superconductive state in a restricted range of magnetic fieldSimon ; Papavassiliou ; Lee04 and the anisotropy of the upper critical field has been deduced. Additionally, an attempt was made to determine the temperature dependent penetration depth from the NMR linewidthLee04 assuming that MgB2 is isotropic, which is clearly not the case.
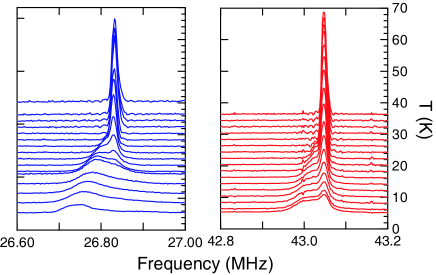
Here we report 11B NMR measurements in the temperature range from 5 K to 40 K on a powder sample of MgB2 at two magnetic fields, 1.97 T and 3.15 T. We find that on cooling the spectra acquire a broad asymmetric line below the superconductive transition temperature as shown in Fig.1. The shape of the broad line suggests the expected lineshape from an inhomogeneous field distribution from vortices in their solid state. However, as we will see, this interpretation is too simplistic. The relative weight of this broad line, compared to the narrow normal component, increases with decreasing temperature. We associate this with the temperature and angular dependence of the upper critical field. From this behavior we obtain the upper critical field anisotropy to be 5.4 at low temperature. We have also simulated the full spectrum at 8 K in a field of 1.97 T using this value for anisotropy and, by comparing with experiment, we have obtained the penetration depth Å. Furthermore, we find that the penetration depth is isotropic for T K even though the upper critical field and the coherence length are not. Our results support the theoretical claim that there are two different anisotropy parameters for upper critical field and penetration depthKogan1 ; Golubov ; Kogan2 .
The polycrystalline MgB2 sample was prepared by solid state reaction techniques using a mixture of magnesium and boron powders. The superconductive transition temperature was measured to be 39.5 K for the onset of diamagnetism in a magnetic field of 1.0 mT and 39 K for zero resistance. A sample of 0.2 gram randomly oriented MgB2 powder was used in our experiments. NMR measurements were carried out in the temperature range between 5 K and 40 K in magnetic fields of 1.97 T and 3.15 T in a superconductive magnet. Broad spectra were obtained by summing Fourier transforms of echo signals for a suite of different frequencies that cover the NMR spectrum.
The spectra displayed in Fig. 1 are the central transition of 11B. At high temperature, the sample is metallic in the normal state and this spectrum consists of a single narrow and symmetric line. As the temperature is lowered, a broad and asymmetric line appears. We associate this with the inhomogeneous field distribution from vortices in the superconductive state in addition to diamagnetic screening currentsBrandt . The weight of the broad line increases with decreasing temperature, while that of the narrow line decreases. The two lines coexist to a temperature of 5 K at 3.15 T, whereas only the broad line survives below 17 K at 1.97 T. This can be explained by anisotropy of the upper critical field in MgB2.
Due to the temperature dependence and anisotropy of the two gap parameters in MgB2Kogan1 ; Kogan2 ; Choi , its upper critical field has a temperature and angular dependence:
| (1) |
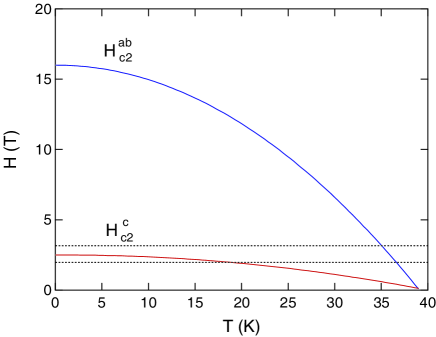
where is the angle between the applied magnetic field and the axis of a crystal. The temperature dependence of H and H is sketched in Fig. 2. For temperatures below , the upper critical field Hc2 will be equal to the applied magnetic field for crystals oriented at a certain angle . The crystals with larger than have their Hc2 greater than the applied field, and are superconductive. Due to the random distribution of the orientation of the crystals, the superconductive fraction in the sample simply equals cos . As the temperature decreases further, H increases and, if it crosses the applied magnetic field, the whole sample becomes superconductive. In Fig. 1, for H = 1.97 T, the narrow line disappears below 17 K leaving only the broad line. However, in H = 3.15 T the axis upper critical field, H, is always smaller than the applied field. Therefore, part of the sample remains in the normal state in this field and contributes to the narrow line in the spectrum, even at the lowest temperatures.
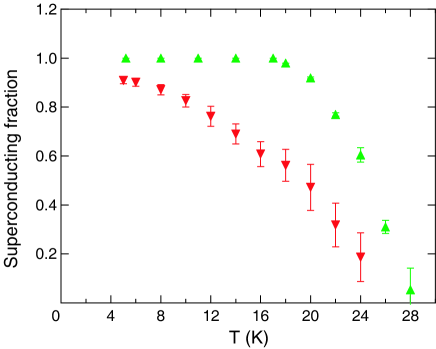
In Fig. 1, the position of the narrow peak is almost temperature independent and has a gaussian shape. Therefore, the contribution of crystals in the normal state can be deconvolved from the composite spectra. The ratio of the remaining area to the whole spectrum gives the superconductive fraction cos , plotted in Fig. 3. Furthermore, with H taken to be 16 T from Bud’ko and CanfieldBud'ko , and the upper critical field at at 5 K equal to 3.15 T, the external applied magnetic field, the upper critical field anisotropy can be obtained from Eq. 1 and we find this to be 5.4 at low temperature. This value is consistent with previous reportsCubitt ; Papavassiliou ; Eskildsen ; Fletcher ; Angst ; Lyard ; Angst1 ; Zehetmayer ; Kogan1 ; Golubov ; Kogan2 .
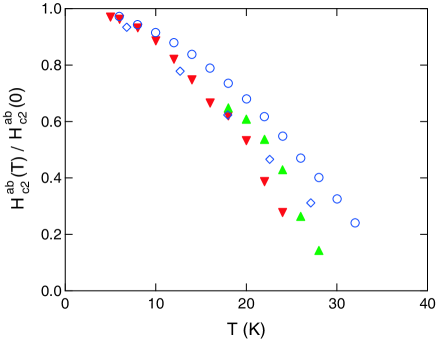
Assuming to be temperature independent, H at each temperature point can be obtained following Eq. 1. The temperature dependence for this analysis is plotted in Fig. 4 where it is compared with results for H from other groupsBud'ko ; Simon . The discrepancy grows with increasing temperature. However, it is now accepted that decreases with increasing temperatureKogan1 ; Kogan2 . Therefore, in our derivation at high temperatures we have used a value for that is too large which will produce a larger H and consequently an overestimate of the transition temperature in a given field. In contrast, Fig. 4 shows that the critical field curve deduced from our data and Eq. 1 is too low. In fact, it extrapolates to a zero field transition temperature around 30 K. The principal reason for this discrepancy is vortex dynamics. At high temperatures vortices are in a liquid stateMaple ; Rey97 and their dynamics on the NMR time scale average the local fields to zero at the nucleus. This transfers spectral weight from the broad line to the narrow line and reduces the apparent superconductive fraction obtained from NMR. At low temperatures, in the vortex solid state our analysis of the superconductive fraction is reliable and, as can be seen in Fig. 4, our results match H below 10 K.
We have found that the spin-lattice relaxation rate of the broad line is much slower than that of the narrow line. This agrees with a previous reportKarayanni . Additionally, we have found that the rate increases smoothly with increasing frequency within the spectrum, rising in the high frequency tail of the central transition. Owing to the inherent inhomogeneity of the field distribution, which we will discuss later, it is not possible to deconvolute spin-lattice relaxation signals to search for electronic excitations in different parts of the vortex structure as has been reportedmit01 for YBCO. However, our spin-lattice relaxation results serve as a guide to help us avoid selective saturation, particularly at low frequencies where the rate is small, allowing us to obtain a faithful representation of the spectrum.
The absolute value of the penetration depth is a key parameter for characterization of superconductivity and yet it is difficult to measure accurately. Using a tunnel diode oscillator technique Fletcher et al. Fletcher found a penetration depth of MgB2 between 800 and Å. Finnemore et al.Finnemore determined that was Å from transport measurements. Using ESR, Simon et al.Simon reported a value of the penetration depth between Å and Å. From analysis of the second moment of the measured NMR linewidth, Lee et al. calculated the penetration depth to be Å. But, as we mentioned earlier, the resonance methods cannot obtain a reliable measure of the penetration depth, if it is assumed in their interpretation that the superconductor is isotropic. Here we determine the penetration depth by comparison of our measured spectrum with a simulation of the local fields in the mixed state for an anisotropic random powder at 8 K in a magnetic field of 1.97 T using the penetration depth as a variational parameter.
The NMR spectrum is a local magnetic field map. At low temperature, the vortices are in the solid state and contribute to the associated field distribution of the NMR spectrum. The field distribution of the mixed state can be calculated by solving the Ginzburg-Landau (GL) equation. For this purpose we adopt Brandt’s algorithmBrandt an iterative, quickly converging method. The solution gives the current and field distribution from the vortex lattice and the diamagnetic fields from screening currents in the superconducting state. The required inputs are the external field, coherence length , and penetration depth . We calculate the coherence length, Å from the upper critical fieldBud'ko and we take its anisotropy from Eq. 1,
| (2) |
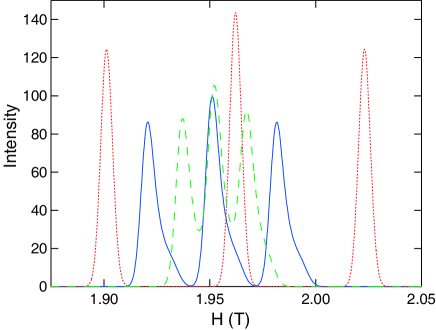
With these inputs, the field distribution for a crystal at a specific angle is generated by Brandt’s algorithmBrandt including the central transition and its quadrupolar satellites. We convolute the spectrum with a broadening function, exp, which will also include the effect of the finite width of the NMR line in the normal state. In a powder sample, which we assume to be composed of single crystal ellipsoids of revolution, we must consider the shifts of magnetization owing to demagnetization according to the shape and orientation distribution of the grainsDrain . For simplicity we characterize this distribution by an average demagnetization factor, D. This assumption would be precise if the grain shape distribution is uncorrelated with the crystal structure. The demagnetization effect gives a relative shift of the magnetization which itself depends on the orientation of the grains since the diamagnetic moment from screening currents is strongly angular dependent. Simulations of spectra at three different, but representative, angles are presented in Fig. 5. The spectrum for the whole sample is then obtained as the integral of 91 spectra with orientation uniformly distributed between 0 and , weighted by a factor sin appropriate for a random distribution of grain orientations.
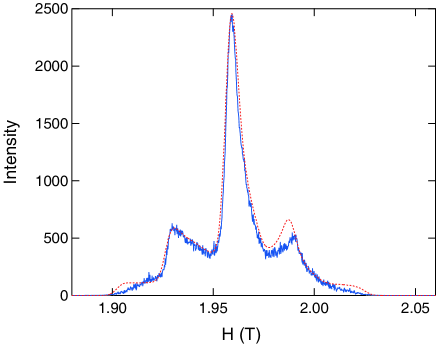
There are three variational parameters, , D, and . We then carry out a minimization of the difference between the simulated spectrum and the experimental one, taking their areas to be equal. The simulated spectrum is shown in Fig. 6 together with the experimental spectrum. The numerical results provide an excellent representation of the complex measured spectrum with values for the variational parameters for the penetration depth = Å, average demagnetization factor, D = and the gaussian broadening, mT, which is larger than, but of the same order as, the normal state linewidth, 2 mT. The quoted accuracy is statistical. This value for D is rather close to that anticipated for a spherical geometry, D, and it is reasonable to expect this value for the average demagnetization factor for a large ensemble of grains. Earlier reports for the value of the penetration depthSimon ; Fletcher ; Heon ; Finnemore are similar to ours although our accuracy is higher. Our simulation and its comparison with experiment, as represented in Fig. 6, is the most precise such comparison obtained by resonance methods and it is the first time that such a simulation has been attempted for a strongly anisotropic supercondcutor. We emphasize that previous work has generally focused on moments of the measured spectrum, often restricting attention to the second moment. For an anisotropic superconductor the angular dependence of the first moment of the distribution, as can be seen in Fig. 5, must be correctly handled since it contributes significantly to the overall lineshape. Earlier work on other superconductors analyzing the field distribution in the mixed state has been directed at the moments of the distribution, so we have calculated the first three moments for an anisotropic superconductor with randomly oriented grains, as a function of the penetration depth, restricted to the case of and .
The second moment of the magnetic field distribution of a spectrum from a vortex lattice can be relatedBrandt to its penetration depth for low magnetic fields compared to Hc2 by the Pincus’ formulaBrandt ; Rey97 where the second moment varies as the inverse fourth power of the penetration depth, . In the present case the simulated spectrum is the superposition of spectra with anisotropic coherence lengths and upper critical fields. Nonetheless, we find the 1st, 2nd and 3rd moments of the spectrum can be similarly related to inverse, even powers of the penetration depth in the following elegant way:
| (3) |
| (4) |
| (5) |
where A1, A2, A3 are numerical constants. The gaussian broadening factor is and D is the demagnetization factor. We find A1 = 1.415 104 T Å2, A2 = 2.621 107 T2 Å4, A3 = 1.524 1011 T3 Å6. However we caution that anisotropy and field dependence of the local field distributions mean that these numerical constants hold only in a limited range which we have explored for MgB2 with , and H = 1.97 T.
We have also investigated the effect of the penetration depth anisotropy at low temperature. In actuality, the vortex structure for arbitrary angle is found as the solution to the anisotropic GL equationsOliveira . However, as a reasonable approximation for an almost isotropic penetration depth, we introduce another variational parameter, , and continue to adopt the solution of the isotropic GL equation for each crystallite. The anisotropy of Hc1 is the inverse of Hc2, therefore the penetration depth has the inverse angular dependence of the coherence length,
| (6) |
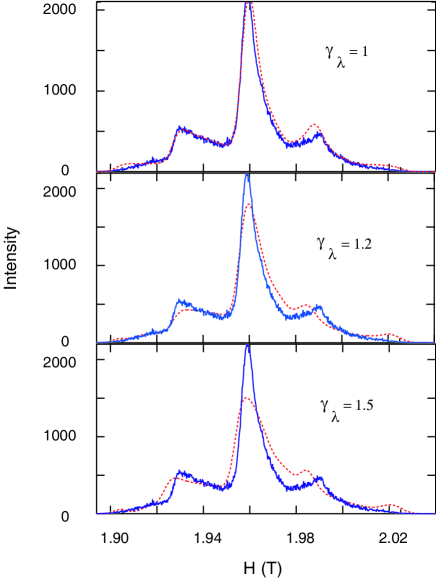
With the same approach as before we generate the spectrum for the powder sample with larger than one. The central transition is found to decrease with increase of and the spectra become more asymmetric as Fig. 7 illustrates. This suggests that at low temperatures should be close to one. Magnetization measurements show that is around 1.7 between 20 and 27 KHeon . SANS experiments on a powder MgB2 sampleCubitt06 give an upper limit of to be around 1.5 and essentially magnetic field independent. Our result is consistent with these values. However, SANS measurements on a single crystalCubitt ; Eskildsen06 indicate that is close to one at T = 2 K and at low filed, H 0.5 T, and that it increases with external field reaching 3.5 in a field of 0.8 T. The lower in the powder sample is believed to be caused by a limiting crystallite size effectCubitt06 . Further work will be required to elucidate this phenomenon.
In conclusion, we measure the 11B NMR spectra of a random powder sample of MgB2 in magnetic fields of 1.97 T and 3.15 T. The evolution of the spectra through the temperature range can be explained by the anisotropy of the upper critical field , which is determined to be 5.4 at low temperature. We find from our simulation that the penetration depth carries a different anisotropy from the upper critical field and that at low temperatures it is almost isotropic similar to that reported from SANSCubitt06 for a powder sample. The value of the penetration depth that we have obtained for MgB2 is Å at 8 K in a magnetic field of 1.97 T. From our numerical studies we have found simple expressions for the penetration depth dependence of the moments of the field distribution in a random powder of an anisotropic superconductor.
This work was supported by the DOE: DE-FG02-05ER46248. Two of us (M. Lee and B. K. Cho) acknowledge financial support from the Korean Research Foundation through, respectively, Grant 2003-015-C00161 and ABRL program at Ehwa Woman University.
References
- (1) E. H. Brandt 1997 Phys. Rev. Lett. 78 2208
- (2) J. Nagamatsu, N. Kakagawa, T. Muranaka, Y. Zenitani and J. Akimitsu 2001 Nature 410 63
- (3) V. G. Kogan 2002 Phys. Rev. B 66 020509
- (4) R. Cubitt, M. R. Eskildsen, C. D. Dewhurst, J. Jun, S. M. Kazakov and J. Karpinski 2003 Phys. Rev. Lett. 91 047002
- (5) L. Lyard, P. Szab , T. Klein, J. Marcus, C. Marcenat, K. H. Kim, B. W. Kang, H. S. Lee and S. I. Lee 2004 Phys. Rev. Lett. 92 057001
- (6) A. Rydh et al 2004 Phys. Rev. B 70 132503
- (7) V .G. Kogan and S. L. Bud’ko 2003 Physica C 385 131
- (8) H. J. Choi, D. Roundy, H. Sun, M. L. Cohen and S. G. Louie 2002 Nature 418 758
- (9) A. A. Golubov, A. Brinkman, O. V. Dolgov, J. Kortus and O. Jepsen 2002 Phys. Rev. B 66 054524
- (10) J. D. Fletcher, A. Carrington, O. J. Taylor, S. M. Kazakov and J. Karpinski 2005 Phys. Rev. Lett. 95 097005
- (11) M. Angst et al 2004 Phys. Rev. B 70 224513
- (12) M. Zehetmayer, M. Eisterer, J. Jun, S. M. Kazakov, J. Karpinski, A. Wisniewski and H. W. Weber 2004 Physica C 408 111
- (13) R. Cubitt et al 2006 Journal of Physics and Chemistry of Solids 67 493
- (14) D. Pal, L. DeBeer-Schmitt, T. Bera, R. Cubitt, C. D. Dewhurst, J. Jun, N. D. Zhigadlo, J. Karpinski, V. G. Kogan, and M. R. Eskildsen 2006 Phys. Rev. B 73 012513
- (15) J.E. Sonier, J.H. Brewer, and R.F. Kiefl 2000 Rev. Mod. Phys. 72 769
- (16) A.P. Reyes, , X. P. Tang, H. N. Bachman, W. P. Halperin, J. A. Martindale and P. C. Hammel 1997 Phys. Rev. B 55 14737; H. N. Bachman, PhD thesis, Northwestern University, 1999.
- (17) G. Papavassiliou, M. Pissas, M. Fardis, M. Karayanni and C. Christides 2002 Phys. Rev. B 65 012510
- (18) K. H. Lee, K. H. Kang, B. J. Mean, M. H. Lee and B. K. Cho 2004 Journal of Magnetism and Magnetic Materials 272 165
- (19) F. Simon et al 2001 Phys. Rev. Lett. 87 047002
- (20) S. L. Bud’ko and P. C. Canfield 2002 Phys. Rev. B 65 212501
- (21) M. Angst, R. Puzniak, A. Wisniewski, J. Jun, S. M. Kazakov, J. Karpinski, J. Roos and H. Keller 2001 Phys. Rev. Lett. 88 167004
- (22) M. R. Eskildsen, N. Jenkins, G. Levy, M. Kugler, . Fischer, J. Jun, S. M. Kazakov and J. Karpinski 2003 Phys. Rev. B 68 100508(R)
- (23) M. B. Maple, B. J. Taylor, S. Li, N. A. Frederick, V. F. Nesterenko and S. S. Indrakanti 2003 Physica C 387 131
- (24) M. Karayanni, G. Papavassiliou, M. Pissas, M. Fardis, K. Papagelis, K. Prassides, T. Takenobu and Y. Iwasa 2005 Journal of superconductivity 18 521
- (25) V.F. Mitrovic, E. E. Sigmund, M. Eschrig, H. N. Bachman, W. P. Halperin, A. P. Reyes, P. Kuhns P and W. G. Moulton 2001 Nature 413 501
- (26) D. K. Finnemore, J. E. Ostenson, S. L. Bud’ko, G. Lapertot and P. C. Canfield 2001 Phys. Rev. Lett. 86 2420
- (27) L. E. Drain 1962 Proc. Phys. Soc. (Lond.) 80 1380
- (28) H. J. Kim, B. Kang, H. S. Lee and S. I. Lee 2006 Physica B 378-380 890
- (29) I. G. de Oliveira, M. M. Doria and E. H. Brandt 2000 Physica C 341 1069