Experimental evidence for a large critical transverse depinning force in weakly-pinned vortices
Abstract
We present experimental evidence for the existence of a large critical transverse depinning force. These results are obtained in the weakly-pinned superconducting metal glasses FexNi1-xZr2 using crossed ac and dc driving currents. We study the depinning force due to the transverse ac drive as a function of a longitudinal dc drive. The ac/dc combination allows us to separate the transverse drive from the longitudinal one. We show that the force required for depinning in the transverse direction is enhanced by a longitudinal drive, which leads to the existence of a large transverse critical force.
The vortex state of type II superconductors is characterized by a wealth of interaction phenomena: Whereas vortex-vortex repulsion tends to order the system, thermal fluctuations and pinning from material inhomogeneities introduce disorder in the vortex lattice. This sort of competition between ordering and disordering makes the vortex state rich in both static and dynamic phase transitions, as well as in nonequilibrium phenomena. While the effect of disorder on the static case has been widely studied in the past years Nattermann (1990); Bouchaud et al. (1992); Blatter et al. (1994); Giamarchi and Le Doussal (1994, 1995) the driven case has still much to reveal.
A large number of studies have demonstrated that at high driving forces, a disordered system will show ordering (dynamical ordering) Bhattacharya and Higgins (1993); Yaron et al. (1994); Hellerqvist et al. (1996); Marchevsky et al. (1997); Shi and Berlinsky (1991); Moon et al. (1996); Ryu et al. (1996); Olson et al. (1998); Spencer and Jensen (1997); Koshelev and Vinokur (1994); Giamarchi and Le Doussal (1996); Balents et al. (1997, 1998); Le Doussal and Giamarchi (1998); Pardo et al. (1998); Fangohr et al. (2001a, b); Marley et al. (1995). Experimentally, the crossover to a more ordered vortex phase at large driving current is deduced in transport measurements from the presence of a peak in the differential resistance Bhattacharya and Higgins (1993); Hellerqvist et al. (1996), or from a decrease of the low frequency broadband noise Marley et al. (1995); an increase of the longitudinal correlation length in neutron diffraction experiments has also revealed the existence of this dynamical ordering phenomena Yaron et al. (1994). In addition, dynamic ordering was directly observed in magnetic decoration experiments Marchevsky et al. (1997); Pardo et al. (1998). Numerically and analytically, the establishment of the existence of such dynamical phase transitions and ordering has lead to the prediction of the existence of static channels in which the vortices flow; these channels may be decoupled, in which case the vortex phase obtained is called the moving transverse glass (MTG) and has smectic order, or they may be coupled and one has the moving Bragg glass (MBG). It is predicted that these channels act as strong barriers against transverse depinning, resulting in the existence of a finite transverse critical force Moon et al. (1996); Olson et al. (1998); Giamarchi and Le Doussal (1996); Le Doussal and Giamarchi (1998); Olson and Reichhardt (2000); Ryu et al. (1996); Fangohr et al. (2001a). Experimentally, the existence of this critical force has yet to be proved, and the vortex channels have only been observed in magnetic decoration experiments Marchevsky et al. (1997); Pardo et al. (1998) and STM images Troyanovski et al. (1999).
Here we study experimentally the transverse dynamics of vortices and demonstrate the existence of a large transverse critical force. (Experimentally, the critical force is equivalent to the depinning force, so we will use the terminology “critical force” throughout the text to mean “depinning force”.) We find that for a system driven longitudinally with a dc current, application of a small transverse force, provided by an ac current, does not result in immediate transverse depinning. In some regimes, the transverse force required for depinning the vortices in the transverse direction is even increased by more than 30 % with respect to the force required in the longitudinal case, thus implying the appearance of very strong barriers against transverse motion. Numerical studies have found the ratio of the critical transverse force over the critical longitudinal force to be of the order of 1 % Moon et al. (1996); Ryu et al. (1996); Olson and Reichhardt (2000) or 10 % Fangohr et al. (2001a). Following Ref.Fangohr et al. (2001a), this ratio is expected to increase for weaker pinning. However, finite size effects in numerical simulations do not allow for studies in the limit of very weak pinning, which is the regime of our experiments. Indeed, in our experiments the vortex pinning is at least six times smaller and we obtain a ratio , which can exceed 100%.
The measurements were performed on different samples of the metal glass FexNi1-xZr2 prepared by melt-spinning Altounian et al. (1994) and which become superconducting below about K depending on the iron content. These samples are particularly clean such that vortices are very weakly-pinned, and pinning is isotropic and has no long-range order because of the amorphous nature of the samples. The samples have a very small critical current density (), which means that we can conveniently study the depinning mechanisms using a very small driving current without introducing uncertainties due to the heating of the sample related to the use of a large driving current. The average vortex velocity can then be measured from the voltage they produce perpendicular to their motion. These material were found to be strong type II low temperature superconductors Hilke et al. (2003) from estimates of the different characterizing length scales using standard expressions for superconductors in the dirty limit Kes and Tsuei (1983). These samples show a variety of phases of longitudinal and transverse vortex motion, including a MBG-like phase Hilke et al. (2003); Lefebvre et al. (2006), and hence are ideal for the study of transverse depinning.
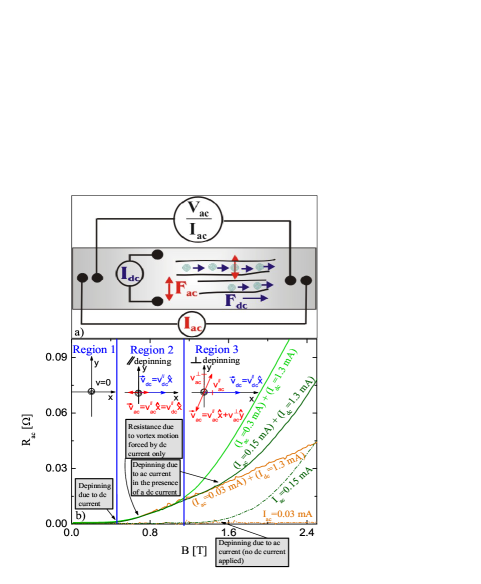
We proceed by cooling the samples in a He3 system to a temperature below K. We use a dc current as the longitudinal drive, and a 17 Hz ac current provided by a resistance bridge as the transverse drive. The resistance is measured in the transverse direction with the resistance bridge. Indium contacts are soldered to the sample in the configuration shown in Fig.(1a). In a magnetic field perpendicular to the sample plane, the force exerted on the vortices by the dc current applied along the short edge of the sample acts in the direction , such that the vortices move under the action of that force along the long edge of the sample. Similarly, because the ac current is applied along the long edge of the sample, the force it provides acts on the vortices in such a way that they are oscillating along the direction of the short edge of the sample. Therefore, in this configuration, the channels of vortices are set up by the dc current in the longitudinal direction along the long edge of the sample, and the transverse force is provided by the ac current and directed along the short edge of the sample. Evidently, the two sets of contacts used for dc driving and ac driving are not perfectly perpendicular to each other, and the transverse voltage measured also contains a component resulting from the ac component along the dc longitudinally driven motion. This contact misalignment can be estimated to be of the order of 2∘ for this particular sample and can be excluded following the discussion below. In all the figures, the error bars are found to be smaller than the size of the dot.
For instance, in Fig.(1b) we show measurements of the transverse ac resistance as a function of magnetic field for zero and non-zero longitudinal dc currents. This allows us to distinguish three regions corresponding to three regimes of vortex motion: Region 1 is characterized by vortices pinned in both directions, as none of the currents is strong enough to depin the vortices, leading to zero resistance. In Region 2, for a longitudinal dc current of , which is above the longitudinal depinning current of 0.55 mA, we also measure an ac resistance, which is due to the small ac component proportional to along the longitudinal direction. In this region, where the depinning is only longitudinal, the ac resistance is indeed independent of the transverse ac current, clearly demonstrating that the vortices are pinned in the transverse direction, since depinning is associated with strong non-linearities. This is in stark contrast to region 3, where the ac transverse resistance depends on the transverse ac current and indicates the region where the vortices also start moving in the transverse direction. The transverse depinning current is then easily identified as the point in field and ac current where the ac resistance depends on the transverse ac current. Hence, for a given longitudinal dc drive, the pure transverse dynamics can be obtained by subtracting the contribution due to a very small transverse ac current with the same longitudinal dc drive, i.e., subtracting from in Fig.(1).
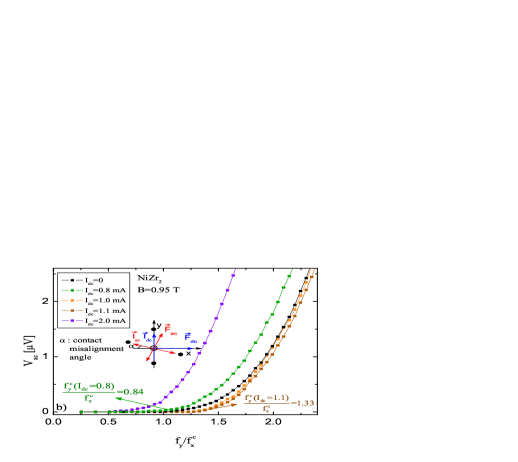
Using the methodology described above, we show in Fig.(2) the corrected transverse voltage versus the transverse driving force for different longitudinal dc drives at a magnetic field of . The arrows in this figure indicate the transverse depinning driving force normalized by the critical longitudinal force () for two different longitudinal drives using a voltage cutoff of 10 nV as depinning threshold. The critical longitudinal force is obtained from the transverse ac depinning current when the longitudinal current is set to zero. This is justified since our system is isotropic in both directions and this choice avoids errors due to the geometrical factor when computing the difference in longitudinal and transverse current densities. In addition, the longitudinal depinning currents in the ac and dc driving case are very similar for these systems Lefebvre et al. (2006). From Fig.(2) we see that for the transverse depinning force is slightly decreased compared to the longitudinal one, in contrast to , where the transverse depinning force is increased, with a ratio reaching . Hence, in this range of longitudinal drives, strong barriers against transverse motion are set up. The overall dependance can be interpreted in the following manner: for , the force provided by this combination of magnetic field and current is just strong enough to cause depinning in the longitudinal direction, but the strength of the barriers created by the channeling effect is still too small to cause a strong pinning action in the transverse direction. For , the dc force does work very well at restraining transverse vortex motion, and the force required to induce transverse depinning even increases with the dc current (see Fig.(3)). For , the ratio of the critical forces starts to decay; the decay gets stronger for . This strong decay is likely due to additional dynamic disorder, which could weaken the barriers against transverse vortex motion Fangohr et al. (2001a).
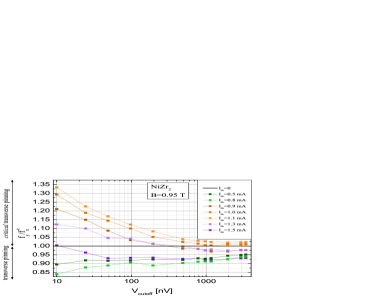
From Fig.(2) we extract the evolution of for different transverse cutoff voltages. The results are shown in Fig.(3) for different longitudinal driving currents, where the ratio of the critical forces approaches one for transverse vortex velocities exceeding the longitudinal vortex velocities. In fact, we obtain this ratio to be exactly one when the transverse force equals approximately ten times the longitudinal force (data not shown here). However, the fact that this ratio does not reach one right after transverse depinning occurs implies that the barriers against transverse vortex motion not only delay transverse depinning, but also constrain transverse vortex motion at larger velocities as well. This effect was also observed numerically in Ref.Fangohr et al. (2001a). More importantly, this figure confirms the criticality of the transverse depinning transition observed with the 0.9 mA 1.5 mA longitudinal drives. Indeed, in this regime, extrapolation of to determines the critical , which clearly will remain much larger than 0. This can be contrasted with the data for and 0.8 mA for which decreases with decreasing cutoff voltage, which could indicate that in this regime the transverse pinning is not critical.
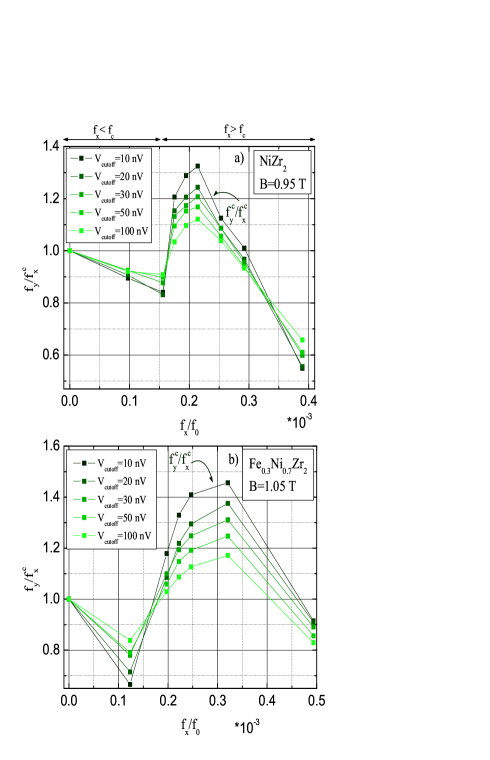
In order to illustrate this critical behavior further, we choose different cutoff voltages to extract the ratio from the data shown in Fig.(2) and plot this as a function of the dc longitudinal force as shown in Fig.(4) for two different samples. As mentioned previously, the general behavior observed with increasing dc force is an initial slight decrease of followed by a strong increase reaching a maximum at where is the interaction force between two vortices separated by a distance . In the region below , the longitudinal force is smaller than the longitudinal depinning force, i.e. the ratio is dominated by the transverse motion and the ratio should therefore be close to one. However, the observed small initial decrease of is attributable to the small longitudinal dc component in the transverse direction due to our small contact misalignment, which now helps depinning in the transverse direction. In the peak region, , the longitudinal force is now greater than the longitudinal depinning force and an important enhancement of the transverse depinning force is observed. This is also the region described above in which we have a true critical transverse force. A strong dependence on the choice of voltage cutoff is also observed, which signifies that the effect of the longitudinal dc drive is not the same for all transverse ac forces. We choose the curve with to determine the critical transverse force because, as discussed earlier, the criticality of the transverse depinning transition is determine by the behavior in the limit where approaches zero.
The most striking overall feature is the very large magnitude of measured here (between 0.55 and 1.33), when compared to the numerical studies Moon et al. (1996); Ryu et al. (1996); Olson and Reichhardt (2000); Fangohr et al. (2001a) (between 0.01 and 0.1). This much larger magnitude of the normalized critical transverse depinning force in our experimental weakly pinned system is consistent with the numerical study in Ref. Fangohr et al. (2001a), where they find the critical forces ratio to be larger for weaker pinned simulated samples. This increase in critical ratio for a decreasing longitudinal pinning was attributed to a transverse depinning, which is largely independent of the longitudinal depinning. For a quantitative comparison, we use , where is the area of the sample perpendicular to the field, to obtain the pinning force per unit length for our sample. This leads to , which means it is 6 times less pinned than the weakest-pinned sample simulated in Ref.Fangohr et al. (2001a). In addition, we obtain the critical longitudinal depinning force for our system using the cutoff to be , which is more than 200 times smaller than the longitudinal depinning force simulated in Ref.Fangohr et al. (2001a). These quantities confirm the weak-pinning nature of our samples, which leads to the very large observed critical transverse to longitudinal force ratio.
We have investigated experimentally the transverse dynamics of a vortex system by measuring the resistance developed in a superconductor upon application of an ac current in the transverse direction in the presence of a dc current in the longitudinal direction. We obtain values for the depinning force in the driven case which are increased up to 33 % with respect to the depinning force in the static case, depending on the dc current used. We attribute the large magnitude of the critical force ratio in the driven and the static cases found here to the weak-pinning properties of our samples. We also establish that the longitudinal drive suppresses vortex motion after transverse depinning such that the vortices still feel some transverse pinning at high velocity.
Acknowledgements.
The authors acknowledge support from FQRNT and NSERC. Correspondence and requests for materials should be sent to hilke@physics.mcgill.caReferences
- Nattermann (1990) T. Nattermann, Phys. Rev. Lett. 64, 2454 (1990).
- Bouchaud et al. (1992) J.-P. Bouchaud, M. Mézard, and J. S. Yedidia, Phys. Rev. B 46, 14686 (1992).
- Blatter et al. (1994) G. Blatter, M. V. Feigel’man, V. B. Geshkenbein, A. I. Larkin, and V. M. Vinokur, Rev. Mod. Phys. 66, 1125 (1994).
- Giamarchi and Le Doussal (1994) T. Giamarchi and P. Le Doussal, Phys. Rev. Lett. 72, 1530 (1994).
- Giamarchi and Le Doussal (1995) T. Giamarchi and P. Le Doussal, Phys. Rev. B 52, 1242 (1995).
- Bhattacharya and Higgins (1993) S. Bhattacharya and M. J. Higgins, Phys. Rev. Lett. 70, 2617 (1993).
- Yaron et al. (1994) U. Yaron, P. L. Gammel, D. A. Huse, R. N. Kleiman, C. S. Oglesby, E. Bucher, B. Batlogg, D. J. Bishop, K. Mortensen, K. Clausen, et al., Phys. Rev. Lett. 73, 2748 (1994).
- Hellerqvist et al. (1996) M. C. Hellerqvist, D. Ephron, W. R. White, M. R. Beasley, and A. Kapitulnik, Phys. Rev. Lett. 76, 4022 (1996).
- Marchevsky et al. (1997) M. Marchevsky, J. Aarts, P. H. Kes, and M. V. Indenbom, Phys. Rev. Lett. 78, 531 (1997).
- Shi and Berlinsky (1991) A.-C. Shi and A. J. Berlinsky, Phys. Rev. Lett. 67, 1926 (1991).
- Moon et al. (1996) K. Moon, R. T. Scalettar, and G. T. Zimányi, Phys. Rev. Lett. 77, 2778 (1996).
- Ryu et al. (1996) S. Ryu, M. Hellerqvist, S. Doniach, A. Kapitulnik, and D. Stroud, Phys. Rev. Lett. 77, 5114 (1996).
- Olson et al. (1998) C. J. Olson, C. Reichhardt, and F. Nori, Phys. Rev. Lett. 81, 3757 (1998).
- Spencer and Jensen (1997) S. Spencer and H. J. Jensen, Phys. Rev. B 55, 8473 (1997).
- Koshelev and Vinokur (1994) A. E. Koshelev and V. M. Vinokur, Phys. Rev. Lett. 73, 3580 (1994).
- Giamarchi and Le Doussal (1996) T. Giamarchi and P. Le Doussal, Phys. Rev. Lett. 76, 3408 (1996).
- Balents et al. (1997) L. Balents, M. C. Marchetti, and L. Radzihovsky, Phys. Rev. Lett. 78, 751 (1997).
- Balents et al. (1998) L. Balents, M. C. Marchetti, and L. Radzihovsky, Phys. Rev. B 57, 7705 (1998).
- Le Doussal and Giamarchi (1998) P. Le Doussal and T. Giamarchi, Phys. Rev. B 57, 11356 (1998).
- Pardo et al. (1998) F. Pardo, F. De La Cruz, P. L. Gammel, E. Bucher, and D. J. Bishop, Nature 396, 348 (1998).
- Fangohr et al. (2001a) H. Fangohr, P. A. J. de Groot, and S. J. Cox, Phys. Rev. B 63, 064501 (2001a).
- Fangohr et al. (2001b) H. Fangohr, S. J. Cox, and P. A. J. de Groot, Phys. Rev. B 64, 064505 (2001b).
- Marley et al. (1995) A. C. Marley, M. J. Higgins, and S. Bhattacharya, Phys. Rev. Lett. 74, 3029 (1995).
- Olson and Reichhardt (2000) C. J. Olson and C. Reichhardt, Phys. Rev. B 61, R3811 (2000).
- Troyanovski et al. (1999) A. M. Troyanovski, J. Aarts, and P. H. Kes, Nature 399, 665 (1999).
- Altounian et al. (1994) Z. Altounian, S. Dantu, and M. Dikeakos, Phys. Rev. B 49, 8621 (1994).
- Hilke et al. (2003) M. Hilke, S. Reid, R. Gagnon, and Z. Altounian, Phys. Rev. Lett. 91, 127004 (2003).
- Kes and Tsuei (1983) P. H. Kes and C. C. Tsuei, Phys. Rev. B 28, 5126 (1983).
- Lefebvre et al. (2006) J. Lefebvre, M. Hilke, R. Gagnon, and Z. Altounian, to be published in Phys. Rev. B (2006).