Evidence for a quantum phase transition in electron-doped Pr2-xCexCuO4-δ from thermopower measurements
Abstract
The evidence for a quantum phase transition under the superconducting dome in the high- cuprates has been controversial. We report low temperature normal state thermopower(S) measurements in electron-doped Pr2-xCexCuO4-δ as a function of doping (x from 0.11 to 0.19). We find that at 2 K both S and S/T increase dramatically from x=0.11 to 0.16 and then saturate in the overdoped region. This behavior has a remarkable similarity to previous Hall effect results in Pr2-xCexCuO4-δ. Our results are further evidence for an antiferromagnetic to paramagnetic quantum phase transition in electron-doped cuprates near x=0.16.
pacs:
74.25. Fy, 73.43.Nq, 74.72. Ch, 71.10.HfThe existence of a quantum phase transition at a doping under the superconducting dome in high- superconductors is still controversial. Evidence for a quantum critical point has been given for hole-doped cupratesTallon ; Loram ; Ando but the T=0 normal state is difficult to access because of the large critical field(Hc2). Electron-doped cuprates have a relatively low Hc2 and several studies have suggested that a quantum phase transition exists in those cuprates. Electrical transportYoram on electron-doped Pr2-xCexCuO4-δ(PCCO) shows a dramatic change of Hall coefficient around doping =0.16, which indicates a Fermi surface rearrangement at this critical doping. Optical conductivity experimentsZimmers revealed that a density-wave-like gap exists at finite temperatures below the critical doping and vanishes when . Neutron scattering experimentsKang on Nd2-xCexCuO4-δ(NCCO) found antiferromagnetism as the ground state below the critical doping while no long range magnetic order was observed above . Other suggestive evidenceFournier comes from the observation of a low temperature normal state insulator to metal crossover as a function of doping, and the disappearance of negative spin magnetoresistance at a critical dopingYoramupturn . All these experiments strongly suggest that an antiferromagnetic(AFM) to paramagnetic quantum phase transition(QPT) occurs under the superconducting dome in the electron-doped cuprates.
The quantum phase transition in electron-doped cuprates is believed to be associated with a spin density wave(SDW) induced Fermi surface reconstructionLin ; Zimmers . Angle resolved photoemission spectroscopy(ARPES) experimentsArmitage on NCCO reveal a small electron-like pocket at in the underdoped region and both electron- and hole-like Fermi pockets near optimal doping. This interesting feature is thought to arise as a result of the SDW instability that fractures the conduction band into two different partsLin . If one continues to increase the doping(above ), the weakening of the spin density wave leads to a large hole-like Fermi pocket centered at in the overdoped regionLin ; Matsui .
Nevertheless, the presence of a quantum critical point(QCP) under the superconducting dome in electron-doped cuprates is still quite controversialGreven . Other experimental probes of the critical region are needed. In this paper, we present a systematic study of the magnetic field driven normal state thermopower on PCCO films. We find a doping dependence similar to that seen in the low temperature normal state Hall effect measurementsYoram . From a simple free electron model comparison of these two quantities, we find a strikingly similar behavior of the effective number of carriers. This strongly suggests that a quantum phase transition takes place near x=0.16 in PCCO.
High quality PCCO films with thickness about 3000Å were fabricated by pulsed laser deposition on SrTiO3 substrates (105 mm2). Detailed information can be found in our previous papersPeng ; Maiser . The films were characterized by AC susceptibility, resistivity measurements and Rutherford Back Scattering(RBS).
High resolution thermopower is measured using a steady state method by switching the temperature gradient to cancel the Nernst effect and other possible background contributions. The sample is mounted between two thermally insulated copper blocks. The temperature gradient is built up by applying power to heaters on each block and the gradient direction is switched by turning on or off the heaters. The temperature gradient is monitored by two Lakeshore Cernox bare chip thermometers. Thermopower data is taken when the gradient is stable and averaged for many times to reduce the systematic error. The voltage leads are phosphor bronze, which has a small thermopower even at high fieldWangyy . The thermopower contribution from the wire is calibrated against YBa2Cu3O7(Tc=92 K) for T90 K and Pb film for T90 K, and is subtracted out to get the absolute thermopower of the PCCO sample.
We measured the zero field and in field resistivity of all the doped PCCO films. The results are similar to our previous reportYoram . A 9 T magnetic field(Hc) is enough to suppress the superconductivity for all the dopings. This enables us to investigate the low temperature normal state properties in PCCO. A low temperature resistivity upturn is seen for doping below x=0.16, which suggests a possible insulator to metal crossover as a function of dopingFournier .
Thermopower is measured on the PCCO films doped from x=0.11 to 0.19. In zero field, a sharp superconducting transition is clearly seen in the thermopower. In the inset of Fig. 1, we show the thermopower S of x=0.16(Tc=16.5 K) as a function of temperature. Our high resolution thermopower setup enables us to observe small changes of signal. When the sample goes to the superconducting state, S=0, a small change S=0.5 V/K is easily detectable, which indicates a better sensitivity than our previous one-heater-two-thermometer setupBudhani . We also show the Hall coefficient RH as a function of temperature for the same film in the graph. A sign change of both S and RH is observed at the same temperature.
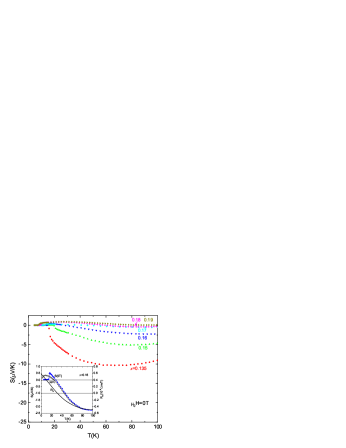
In the main panel of Fig. 1, we show the zero field thermopower for all the superconducting films. A clear superconducting transition is seen in these films. The normal state S(TTc) is negative in the underdoped region. It becomes positive in the overdoped region at low temperature(to be shown later). The magnitude of S in the underdoped region is large as expected for a system with less charge carrier density while it is much smaller in the overdoped region. Previous zero field thermopower measurements on NCCO crystalsWang are qualitatively similar to our data.
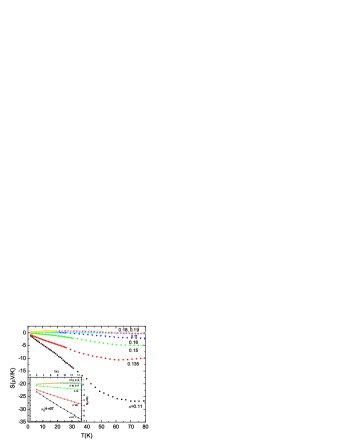
When a 9 T magnetic field is applied along the c-axis, the superconducting films are driven to the normal state for TTc. As seen from the inset of Fig. 1, when the superconductivity is destroyed, the normal state thermopower is obtained. In Fig. 2, we show the normal state thermopower for all the films. The low temperature(T15 K) normal state thermopower is shown in the inset. We showed in Fig. 1 that for x=0.16 the thermopower changes from negative to positive for T30 K, in good agreement with the Hall effect measurementsYoram . For the overdoped films x=0.17 and 0.18, we observe similar behavior with a sign change occurring below 45 K and 60 K respectively. However, the thermopower is always positive for x=0.19. Similar to the the Hall effect, the thermopower for x0.16 is nearly same for T10 K, as shown in the inset of Fig. 2. The dramatic change of the thermopower at low temperature from x=0.15 to the overdoped region suggests a sudden Fermi surface rearrangement around the critical doping x=0.16.

In the Boltzmann picture, thermopower and electrical conductivity are related through the expressionAshcroft :
| (1) |
In the simple case of a free electron gas, this yields: (N() is the density of states at the Fermi energy and is the total number of charge carriers). However, in real metals, the energy-dependence of the scattering time at the Fermi level, , also affects the thermopower. In the zero-temperature limit, it has been shown that this term also becomes proportional to when the impurity scattering dominatesMiyake . In electron-doped cuprates, there is strong evidenceYoram for impurity scattering at low temperatures. The residual resistivity is about 50 -cm for an optimally-doped film, which is quite large compared to clean metals, and the temperature dependence of the resistivity becomes almost constant below 20 K. This is all suggestive of strong impurity scattering. The scattering most likely comes from Ce and oxygen disorder and one would expect a similar disorder at all dopings, although this is hidden by the anomalous (and unexplained) resistivity upturn for the lower dopings. Therefore, we expect that the thermopower is proportional to N(EF)/n will be a valid approximation for our electron-doped PCCO films. This theory thus provides a solid theoretical basis for an experimental observation: in a wide variety of correlated metals, there is an experimental correlation between the magnitude of thermopower and specific heat in the zero-temperature limitBehnia .
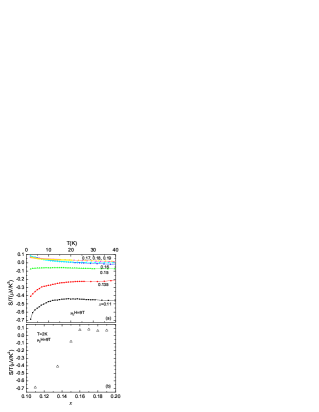
Let us examine our data with this picture in mind. Fig. 3(a) presents S/T as a function of temperature below 40 K for all the doped films. As seen in the figure, there is a dramatic difference between the underdoped and the overdoped films. For underdoped, S/T displays a strong temperature dependence below 20 K, which is reminiscent of the low temperature upturn in resistivity and Hall effectFournier ; Yoram . One possible explanation for this feature would be charge localization Fournier3 . If all, or some of, the itinerant carriers localize at very low temperatures, then the decrease in conductivity is expected to be concomitant with an increase in the entropy per itinerant carrier (which is the quantity roughly measured by S/T). We find this to be qualitatively true as shown in Fig. 4, which displays S/T and conductivity for x=0.11 in a semilog plot. Below 10 K, both quantities are linear functions of T. Note that for the resistivity, it has been shownFournier that the logarithmic divergence saturates below 1 K. Therefore, further thermopower measurements below 2 K would be very useful.
In contrast to the underdoped films, the temperature dependence of S/T in the overdoped region is weaker and there is clearly a finite S/T even at zero temperature. Taking the magnitude of S/T at 2 K as our reference, we can examine the doping dependence of the ratio for itinerant carriers at this temperature. Fig. 3(b) presents the doping dependence of S/T at 2 K. A strong doping dependence for 0.16, a sharp kink around x=0.16 and a saturation in the overdoped region are visible. The dramatic change of S/T at low temperatures from the underdoped to overdoped regions is similar to the Hall effectYoram at 0.35 K, in which a sharp kink was observed around x=0.16. Both S/T and RH change from negative in the underdoped region to a saturated positive value above x=0.16.
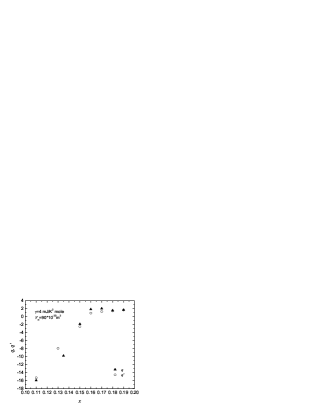
The similarity of the doping dependence of S/T and RH implies a common physical origin. To explore the relation between S/T and RH, let us assume a simple free electron model, where thermopower displays a very simple correlation with the electronic specific heat, . Following the analysis of Ref.20, a dimensionless quantity
| (2) |
can be defined( is Avogadro’s number and ), which is equal to . For a simple metal, R ( is the total volume). If we define
| (3) |
where is unit cell volume, then is also equal to . By this simple argument, we can compare S and RH directly. Because we do not have data for except at optimal doping, we assume it does not change much with doping. With the value()Hamza for x=0.15 and S/T and RH at 2 K, we can plot both and together, as shown in Fig. 5. We find a remarkable similarity in the doping dependence of these two dimensionless quantities, both in trend and in magnitude. Note that no dramatic changes in either or are observed near x=0.13, where it is claimed that AFM long range order vanishesGreven from recent neutron scattering measurements. We should mention that assuming a constant as a function of doping in our range of investigation (x=0.11 to 0.19) is, of course, subject to caution due to a lack of experimental data. However, it has been foundHamza that the specific heat coefficient is the same for an as-grown crystal and a superconducting Pr1.85Ce0.15CuO4 crystal. Neutron scattering studies have shown that an as-grown x=0.15 crystal is equivalent to an annealed Pr1.88Ce0.12CuO4 crystalGreven2 . This strongly suggests that will not change much with Ce doping at least in the critical range around optimal doping. Therefore, no significant change in the doping dependence of due to this correction is expected.
We believe that the saturation of S/T in the overdoped region is a result of the Fermi surface rearrangement due to the vanishing of antiferromagnetism above a critical doping. To our knowledge, there is no theoretical prediction for the doping dependence of the thermopower in an antiferromagnetic quantum critical system. Although the temperature dependence of thermopower near zero temperature is given by Paul et al.Paul for such a system near critical doping, we are not yet able to access the very low temperature region(T2 K) to test these predictions in PCCO. Nevertheless, an amazing agreement between thermopower and Hall effect measurements is shown in our simple free electron model. This model is certainly oversimplified since there is strong evidence for two types of carriers near optimal dopingJiang ; Fournier2 ; Gollnik . But, much of this transport dataJiang ; Fournier2 ; Gollnik implies that one type of carrier dominates at low temperature. Thus a simple model may be reasonable. However, to better understand this striking result a more detailed theoretical analysis will be needed.
Interestingly, the number in overdoped PCCO is close to 1. It was shown that when is close to unity, a Fermi liquid behavior is found in many strongly correlated materialsBehnia . This suggests that overdoped PCCO is more like a Fermi liquid metal than underdoped PCCO. When x is above the critical doping x=0.16, and are close to , which suggests that the hole-like Fermi surface is recovered in accordance with local density approximation band calculations and the Luttinger theorem.
In summary, we performed high resolution measurements to investigate the low temperature normal state thermopower(S) of electron-doped cuprates Pr2-xCexCuO4-δ(PCCO). We find a strong correlation between S/T and the Hall coefficient (RH) at 2 K as a function of doping. Using a simple free electron model, which relates thermopower to the electronic specific heat, we conclude that our observations support the view that a quantum phase transition occurs near x=0.16 in the PCCO system.
This work is supported by NSF Grant DMR-0352735. We thank Drs. Andy Millis and Victor Yakovenko for fruitful discussions.
References
- (1) Y. Ando et al., Phys. Rev. Lett.92, 247004 (2004)and references therein.
- (2) J. L. Tallon and J. W. Loram Physica C 349, 53 (2001).
- (3) G.Q. Zheng et al., Phys. Rev. Lett. 94, 047006 (2005).
- (4) Y. Dagan et al., Phys. Rev. Lett.92, 167001 (2004).
- (5) A. Zimmers et al., Europhys.. Lett.70, 225 (2005).
- (6) H. Kang et al., Nature(London) 423, 522 (2003).
- (7) P. Fournier et al., Phys. Rev. Lett.81, 4720 (1998).
- (8) Y. Dagan et al., Phys. Rev. Lett.94, 057005 (2005).
- (9) J. Lin and A. J. Millis, Phys. Rev. B 72, 214506 (2005).
- (10) N. P.Armitage,et al.,Phys. Rev. Lett. 88, 257001 (2002).
- (11) H. Matsui et al.,Phys. Rev. Lett. 94, 047005 (2005); H. Matsui, et al., Phys. Rev. Lett. 95, 017003 (2005).
- (12) Recent neutron scattering experiments on argue that the QCP is at x=0.13 and that the superconductivity and AFM do not coexist, E.M. Motoyama et al., cond-mat/0609386.
- (13) J. L. Peng et al., Phys. Rev. B 55 R6145 (1997).
- (14) E. Maiser et al.,Physica(Amsterdam) 297C, 15(1998).
- (15) Y. Wang et al., Nature(London) 423, 425 (2003).
- (16) R. C. Budhani et al., Phys. Rev. B 65, 100517(R) (2002).
- (17) C. H. Wang et al., Phys. Rev. B 72,132506 (2005).
- (18) N. W. Ashcroft and N. D. Mermin, Solid State Physics, Saunders College Publishing (1976).
- (19) K. Miyake and H. Kohno, J. Phys. Soc. Jpn, 74, 254 (2005).
- (20) K. Behnia, D. Jaccard and J. Flouquet, J. Phys.:Condens. Matter 16, 5187 (2004).
- (21) P. Fournier et al., Phys. Rev. B 62, R11993 (2000).
- (22) H. Balci and R. L. Greene, Phys. Rev. B 70 140508(R) (2004).
- (23) P. K. Mang et al., Phys. Rev. Lett. 93, 027002 (2004).
- (24) I. Paul and G. Kotliar, Phys. Rev. B 64, 184414 (2001).
- (25) W. Jiang et al., Phys. Rev. Lett.73, 1291 (1994).
- (26) P. Fournier et al., Phys. Rev. B 56, 14149(1997).
- (27) F. Gollnik and M. Naito, Phys. Rev. B 58, 11734(1998).