Magnetic resonance spectroscopy of perpendicularly magnetized
permalloy multilayer disks
Abstract
Using a Magnetic Resonance Force Microscope, we compare the ferromagnetic resonance spectra of individual micron-size disks with identical diameter, 1 m, but different layer structures. For a disk composed of a single 43.3 nm thick permalloy (Py) layer, the lowest energy mode in the perpendicular configuration is the uniform precession. The higher energy modes are standing spin-waves confined along the diameter of the disk. For a Cu(30)/Py(100)/Cu(30) nm multilayer structure, it has been interpreted that the lowest energy mode becomes a precession localized at the Cu/Py interfaces. When the multilayer is changed to Py(100)/Cu(10)/Py(10) nm, this localized mode of the thick layer becomes coupled to the precession of the thin layer.
pacs:
76.50.+gFerromagnetic, antiferromagnetic, and ferrimagnetic resonancesThe dynamical properties of micron sized ferromagnetic structures provides new challenges and opportunities for novel magnetoelectronics devicesPrinz (1999). A recent focus is on the study of the exact nature of the normal modes in these small structuresHillebrands and Ounadjela (1996). Experimental works in the quasi-saturatedHiebert et al. (1997); Bailleul et al. (2006) and closure domain structures statesPerzlmaier et al. (2005); Park et al. (2003) have been recently reported. As for numerical simulations, the interplay between the short-distance exchange and long-range dipolar interactions makes calculations Boust and Vukadinovic (2004); McMichael and Stiles (2005) challenging. Moreover, the recently discovered spin diffusion mechanismHurdequint (2006); Tserkovnyak et al. (2005) makes the dynamical properties of such small structures still unsorted.
Ferromagnetic resonance (FMR) has been for a long time the basic tool to study the microwave susceptibility of magnetic samplesWigen (1984). FMR uses a well-defined selection rule, where the excitation field preferentially couples to the most uniform mode in the sample. However, the limited sensitivity of standard FMR implies that it can only be performed on arrays of micron size disks, which statistically averages the spectra of many disks and makes it insensitive to individual differences. In this paper, using a mechanical-FMR we report on a study of individual micron size disks. It is shown that different multilayer structures yield different characteristics for the lowest energy mode.
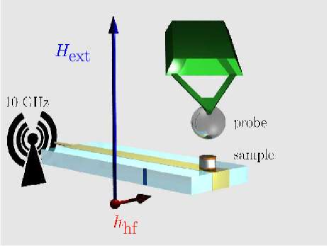
To detect the FMR response of an individual microstructure, we exploit the high sensitivity of mechanical-FMRZhang et al. (1996); Charbois et al. (2002), a technique inspired by scanning probe techniques. As shown schematically in Fig. 1, the static part of the sample magnetization is coupled through the dipolar interaction to a magnetic sphere attached to the end of a very soft cantilever (spring constant mN/m). Exciting the sample at a fixed frequency, the signal from the sample is detected by measuring the cantilever motion as a function of the perpendicular dc applied field, . A force on the cantilever, proportional to the variation of longitudinal magnetization (component along the precession axis), is associated with the resonanceNaletov et al. (2003). In the experiment reported here, the sphere is an alloy whose principle constituents are (80 wt%) Co and (10 wt%) Fe. It has a diameter of m and its magnetic moment is emu. The center of the sphere is positioned above the center of the disk m away from the sample surface. In this geometry, the perturbation induced by the stray field of the sphere on the FMR spectrum solely corresponds to a perturbation shift of Oe of the whole spectrumCharbois et al. (2002). To enhance the sensitivity by the quality factor of the mechanical resonator (), we measure with a lock-in the response of the cantilever to a source (amplitude) modulation. The modulation frequency is then set at the resonance frequency of the cantilever, which lies well below all the relaxation rates in the spin system.
The excitation antenna, which generates the microwave field, is a 50 microstrip circuit shorted at its extremity, a design allowing studies in a broad frequency range. The microstrip is a Ti/Au(150 nm) line deposited on a sapphire substrate. The disks studied in the present work have all the same diameter, 1 m. They are patterned by electron-beam lithography and ion-milling techniques out of different multilayer thin films and are positioned at a magnetic field anti-node of the microstrip.
Fig. 2 shows the 5.6 GHz mechanical-FMR spectrum of an individual m disk composed of a single nm thick permalloy (Py) layer sandwiched by two insulating layers of Al2O3 (16 nm). The spectrum displayed on Fig. 2, as well as the ones of Fig. 3 and 4, has been recorded at a stabilized temperature K and in the linear regime, where the peak amplitude remains proportional to the excitation power (i.e. precession angles limited to 1°). The most intense peak located at the highest field (lowest energy), kOe, is the uniform mode. Smaller amplitude modes at lower field (higher energy) correspond to standing spin-wave (or magnetostatic modes) with an increasing order along the radial directionKakazei et al. (2004). Note that the linewidth (31 Oe) of the peaks is among the smallest reported at this frequency for Py. Such a regular spectrum has been also measured by mechanical-FMR on an individual ferrite microdisk Charbois et al. (2002). It has also been observed using a cavity-FMR technique by Kakazei et al.Kakazei et al. (2004) on an array of Py disks of same diameter and similar thickness. The position of the magnetostatic modes can be calculated analyticallyKakazei et al. (2004). Using the physical parameters characterizing our Py film deduced from X-band cavity-FMR performed on the extended filmHurdequint (2002) from which the disk was patterned out, we find that we have to introduce a small misalignment (5°) with respect to the perpendicular direction to fit our data, without any other fitting parameter.
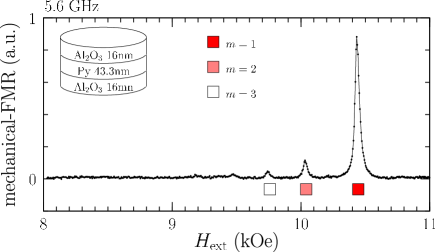
Fig.3 shows the 5.6 GHz mechanical-FMR spectrum obtained for a thicker Py layer (nm) sandwiched by two Cu layers of 30nm. There are several important differences with the previous spectrum:
- The peaks of largest amplitude occur around kOe (red square symbol). They should be associated to the largest volume of precession (uniform mode). Lower value of the resonance field is consistent with our previous measurement, since decreases with increasing thickness. This is the consequence of the decrease of the dipolar field as the aspect ratio () increases. The expected shift, Oe, is close to the experimental one. The uniform mode is followed by small peaks at lower fields, whose amplitudes are consistent with their magnetostatic nature.
- While there is a single mode at the resonance field of the uniform precession in the single layer (Fig.2), the main mode (red square) is split into at least two narrow peaks of 39 Oe linewidth for the (Py/Cu) layers. Such an observed spectrum points to the presence of significant magnetic inhomogeneities in the film of this disk sample. We indicate that this (Py/Cu) layers have been deposited on the microstrip Au layer. As reported in refLoubens et al. (2006), a detailed study of the FMR spectrum of the control film (deposited on a Si substrate) has clearly revealed the presence of such inhomogeneities: gradient of magnetization along the thickness and roughness at the Cu/Py interfaces.
- The other striking feature is the appearance of a new mode at kOe (green triangle) below the energy of the uniform mode. This new peak is interpretedLoubens et al. (2006) as a precession localized at the top and bottom Cu/Py interface near the disk center, in the region of minimum internal field. Indeed, spins excited in the minima region lead to a mode lower in energy than the core precession because the gain in demagnetizing energy exceeds the cost in exchange energyJorzick et al. (2002). This explanation is consistent with the absence of the localized mode in the spectrum of Fig.2.
A cartography of the transverse component, obtained with a micromagnetic codeBoust and Vukadinovic (2004) in which the magnetic properties of our Py have been used and where the two Cu layers have been neglected, is displayed using a color code for the first three main modes. The largest peak corresponds to the so-called “uniform” mode where all the spins precess in phase in the bulk of the sample. The mode at lower field (pink square) is the magnetostatic mode identified in Fig.2 with a nodal circle in the disk (a locus where the magnetization stays still along the equilibrium axis) and a cylindrical regions precessing in opposition of phase with the core. The same visualization of the lowest energy mode shows a precession localized at the minima of the internal field.
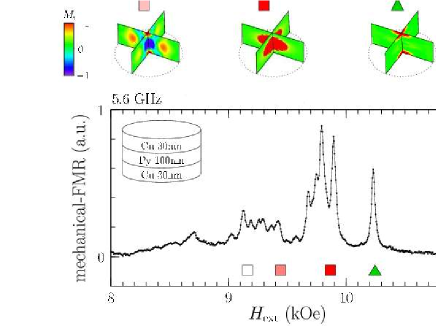
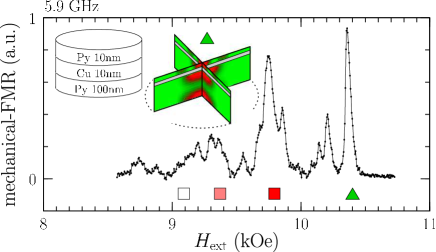
Fig. 4 shows the 5.9 GHz mechanical-FMR spectrum for a double layer structure which consists of Py(100)/Cu(10)/Py(10) nm. It is directly deposited on the microstrip gold layer, and is caped by a 10 nm gold layer. This spectrum bears some strong resemblance with the one observed in Fig.3. This is expected since the main features should be dominated by the dynamics of the thick layer. In particular, we recognize the same group of large peaks at kOe (red square), suggesting that this mode also corresponds to the uniform precession of the thick layer. However, the largest peak is now the lowest energy mode at kOe instead of the uniform mode, and a new group of peaks appears between those two modes. These two new features are likely related to the presence of the thin Py layer. Numerical simulations where the Cu spacer has been replaced by a vacuum layer have been performed on this structure. The simulated spectrum (not shown) gives the uniform mode of the thick layer as well as a higher field and higher amplitude mode. The latter corresponds to a localized precession of the thick layer coupled here through the dipolar interaction to the magnetization dynamics of the thin layer, shown in the inset of Fig. 4. One can understand that this mode may have a larger amplitude than the uniform precession since the top and bottom interfaces of the thick layer and the thin layer are now precessing at . Physical process mediated by the normal metal layer, which are neglected in the simulation (e.g. spin diffusion), should enhance this coupling mechanism. We emphasize that the simulation does not explain the new group of peaks observed between the coupled localized and the uniform modes. However, this high field feature should be related to the dynamics inside the thin layer (probably coupled to the dynamics of the thick layer), where the internal field inhomogeneity and the quantization of the spin-wave modes can give rise to several localized modesBayer et al. (2005).
In conclusion, we have shown that different types of multilayer patterned into the same microstructure yield different FMR spectra. Importantly, the nature of the lowest energy mode depends on the thickness of the Py layer. It shifts from the uniform mode to a localized mode at the surfaces as the thickness increases. The influence of a thinner layer separated by a normal metal spacer has also been measured. We emphasize that the multiplicity of peaks for the two thicker disks reported above have been attributed to extrinsic effectsLoubens et al. (2006) and does not alter the main conclusions of this work. For a finer interpretation of the reported spectra, such effects should be taken into account, as well as the intrinsic effects associated to the diffusion of the microwave magnetizationHurdequint (2006) inside the whole metallic layered structure.
We are greatly indebted to A.N. Slavin, X. Waintal, and A.-L. Adenot for their help and support. This research was partially supported by the ANR grant PNANO06-0235.
References
- Prinz (1999) G. A. Prinz, J. Magn. Magn. Mater. 200, 57 (1999).
- Hillebrands and Ounadjela (1996) B. Hillebrands and K. E. Ounadjela, Spin Dynamics in Confined Magnetic Structures, vol. 2 (Springer, Berlin, 1996).
- Hiebert et al. (1997) W. K. Hiebert et al., Phys. Rev. Lett. 79, 1134 (1997).
- Bailleul et al. (2006) M. Bailleul et al., Phys. Rev. B 73, 104424 (2006).
- Perzlmaier et al. (2005) K. Perzlmaier et al., Phys. Rev. Lett. 94, 057202 (2005).
- Park et al. (2003) J. P. Park et al., Phys. Rev. B 67, 020403(R) (2003).
- Boust and Vukadinovic (2004) F. Boust and N. Vukadinovic, Phys. Rev. B 70, 172408 (2004).
- McMichael and Stiles (2005) R. D. McMichael and M. D. Stiles, J. Appl. Phys. 97, 10J901 (pages 3) (2005).
- Hurdequint (2006) H. Hurdequint, to be published in J. Magn. Magn. Mater. 2006.
- Tserkovnyak et al. (2005) Y. Tserkovnyak et al., Rev. Mod. Phys. 77, 1375 (2005).
- Wigen (1984) P. E. Wigen, Thin Solid Films 114, 135 (1984).
- Zhang et al. (1996) Z. Zhang et al., Appl. Phys. Lett. 68, 2005 (1996).
- Charbois et al. (2002) V. Charbois et al., Appl. Phys. Lett. 80, 4795 (2002).
- Naletov et al. (2003) V. V. Naletov et al., Appl. Phys. Lett. 83, 3132 (2003).
- Kakazei et al. (2004) G. N. Kakazei et al., Appl. Phys. Lett. 85, 443 (2004).
- Kalinikos and Slavin (1986) B. A. Kalinikos and A. N. Slavin, J. Phys. C 19, 7013 (1986).
- Hurdequint (2002) H. Hurdequint, J. Magn. Magn. Mater. 242-245, 521 (2002).
- Loubens et al. (2006) G. de Loubens et al., cond-mat/0606245 (2006).
- Jorzick et al. (2002) J. Jorzick et al., Phys. Rev. Lett. 88, 47204 (2002).
- Bayer et al. (2005) C. Bayer et al., Phys. Rev. B 72, 064427 (2005).