Anomalous Fermi-Surface Dependent Pairing in a Self-Doped High-Tc Superconductor
Abstract
We report the discovery of a self-doped multi-layer high Tc superconductor Ba2Ca3Cu4O8F2 (F0234) which contains distinctly different superconducting gap magnitudes along its two Fermi surface(FS) sheets. While formal valence counting would imply this material to be an undoped insulator, it is a self-doped superconductor with a Tc of 60K, possessing simultaneously both electron- and hole-doped FS sheets. Intriguingly, the FS sheet characterized by the much larger gap is the electron-doped one, which has a shape disfavoring two electronic features considered to be important for the pairing mechanism: the van Hove singularity and the antiferromagnetic scattering.
pacs:
71.38.-k, 74.72.Hs, 79.60.-iThe origin of the very high superconducting transition temperature (Tc) in the ceramic copper oxide superconductors is often quoted as one of the great mysteries in modern physics. Important insights on high-Tc superconductivity are often gained through investigations on new compounds with unusual properties. The recently synthesized single crystalline Ba2Ca3Cu4O8F2(F0234) is one such example. While valence charge counting based on the canonical chemical formula puts Cu valence as 2+ thus the material as a half-filled Mott insulator, the compound turns out to be a superconductor with Tc of 60Ksamplegrow1 ; samplegrow2 . We performed high resolution angle-resolved photoemission spectroscopy(ARPES) measurements on this compound. Our data reveal at least two metallic Fermi surface(FS) sheets with volumes equally above and below half-filling. We also found that the two FS pieces split significantly along the nodal direction which is very different from other multilayer cupratesAndrea_review . Most interestingly, we found an anomalous FS dependence of the superconducting gap in which the larger gap associates with the most bonding FS that lies further away from the antiferromagnetic reciprocal lattice zone boundary and the van Hove points. This discovery puts a strong constraint on theory.
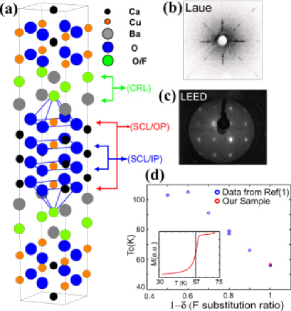
The crystal structure of Ba2Ca3Cu4O8(OδF1-δ)2 is shown in Fig. 1a. It has tetragonal symmetry with alternate stacking of superconducting layers (SCLs) and charge reservoir layers (CRLs). Within a conventional unit cell, there are four CuO2 SCLs that can be divided into two crystallographically inequivalent groups: the outer pair of CuO2 planes (OP) with apical F atoms and the inner pair (IP) without. As shown in Fig. 1d, depending on the apical O/F substitution ratio, the superconducting transition temperature (Tc) varies and can reach 105K when =0.4samplegrow2 . F0234( 0), the material studied in this investigation, has a T 60K.
ARPES experiments were carried out on F0234 samples by using 55eV photons as described beforespacecharge . The single crystalline samples were grown under high pressuresamplegrow2 . Total (convolved) energy resolution of the measurements was 16meV; and the angular resolution was 0.2 degrees. Spectra presented in this paper were measured at 20K and 80K, and the Fermi energy (Ef) is internally referenced to the leading edge position at the d-wave node within each set of data.
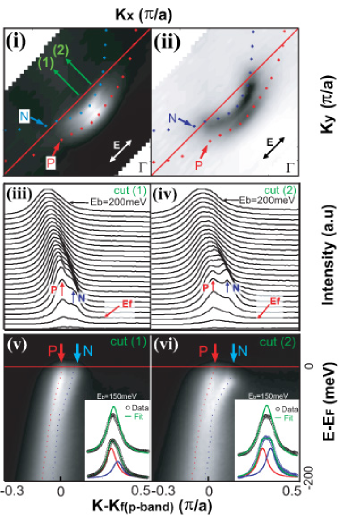
Fig. 2 shows data recorded at 20K that revealed two sets of distinct bands and FS sheets. The spectral intensity map in Fig. 2(i) is a typical way to illustrate the FS topology. Due to the opening of the superconducting gap, the energy integration window is chosen from 20meV binding energy (Eb) to Fermi energy (Ef). At the first glance at plot (i), it looks similar to other cuprate superconductorsMarshall ; Bi_HDing ; Borisenko_FS ; Yoshida ; Andrea_review , which in general show hole like topology around in k-space, and the intensity peaks along nodal direction. However, a closer look at the data reveals the presence of at least two dispersive bands (marked as P and N respectively), which are clearly discernable in both the momentum distribution curves (MDCs) stack plots (iii, iv) and the image plots (v, vi) from data cuts illustrated by green arrows in plot (i). From (iii)(vi), we see that the double peak structures bifurcate further when the two bands disperse to lower binding energy until being limited by the superconducting gap which is more pronounced for band N. The MDC derived dispersions, obtained by fitting the MDC with two Lorentzian peaks plus linear background, are superimposed on plot (v, vi), revealing dispersion kinks at E85meV. We see that the kink of band N is stronger than that of band P; and both are stronger in cut 2 (plot vi) than in cut 1 (plot v). To show the validity of the fitting procedure at high binding energy, in inset of Fig.2(v,vi), we illustrate one Lorentzian (above) and two Lorentzian peaks(below) fits for MDC at Eb=150meV. It’s clear that one Lorentzian peak can’t fit the MDC line shape well.
The presence of the two bands can be seen, but not very distinct in Fig. 2(i) due to the large gap magnitude of band N in the region away from the node and the overlapping with the P band close to the node. As another mapping technique, Fig. 2(ii) shows a derivative map by integrating the derivative of the spectra intensity within the same energy window as in (i). Because the derivative emphasizes the spectral weight change at the leading edge, it is more sensitive in detecting band-top positions, thus the FS contours. As expected, the two bands’ FS contours become more distinct in Fig. 2(ii).
The same behavior can be seen in Fig. 3 with data taken at another measuring geometry (see inset). The presence of two sets of bands is self-evident in the raw data image plot and the energy distribution curve (EDC) stack plot in both k-space quadrants. We highlight the EDCs at the band maxima (kf) positions for one set of bands in the EDC stack plots for clarity. It is obvious from these data that the gap of band N is larger than that of band P as we will discuss in detail later.
To quantitatively determine the FS contours of both bands, we use EDC and MDC analysis complementarilyMDC . We first fit every EDC in each cut to locate the kf positions for both bands based on the minimum superconducting gap criteriaFS_HDing then cross check by fitting MDCs for consistency. The FS contours acquired from Sample 1 are superimposed on Fig.2(i, ii), and those from sample 2 are shown in Fig.5a. If we calculate the FS volumes enclosed by each FS sheet with respect to point within each quadrant(see Fig. 5a), we get 0.610.04 (unit ) for band P FS and 0.40.03 for band N FS.
In the conventional band structure framework, both FS sheets are hole-like. The presence of multiple FS sheets is caused by hybridization of bands from different CuO2 planes. Similar to an earlier investigation on another multilayer systemDonglai , the number of the bands observed is less than expected from the number of CuO2 planes. The fact that we only see two FS sheets rather than four as expected indicates that the additional splitting may be too small to be resolved. Compared to what was observed in Bi2Sr2CaCu2O8 (Bi2212)Donglai2 ; Chuang , we find that the splitting of the FS around the nodal direction is significantly larger.
However, in terms of doped Mott insulator description as is generally used in the field, if we compare our result to the half-filling state in which the FS should have an area of 0.5 in each quadrant, we find that the band P is ”hole-doped” and the band N is ”electron-doped” – the reason for them being marked as P and N respectively. Under the convention established for the cuprates, these two pieces of FS are approximately 208% hole- and 206% electron-doped respectively although the nominal composition indicates F0234 to be an undoped Mott insulator. This is the first self-doping case observed in the cuprates.
The self-doping behavior, or significant FS splitting due to inter-CuO2 plane interaction, while apparently surprising, is consistent with the band structure calculations where the areas of various FS’ in multilayer materials are often found to be very differentPickett ; Andersen ; Hamada . Layer dependent doping has been observed in other multilayer high Tc superconductors such as HgBa2CanCun+1O2n+2 (n=2,3) and (Cu,C)Ba2CanCun+1O3n+2 (n=2,3,4), where NMR study showed that the inner CuO2 layer(s) is less hole-doped than the outer layersTokunaga ; Kotegawa . We note here that in our F0234 case, both bands are highly metallic with sharp peaks and gap opening below Tc.
It would be very interesting to perform other experiments such as NMR or c-axis optics to test whether this system, with the FS areas quite far away from half-filling and with multilayer interaction, can be better described by the band structure language or the doped Mott insulator language described above. Nevertheless, the isolation of the two FS’ allows us to investigate the FS dependence of the superconducting gap, which results in important conclusions independent of the language used.
In Fig. 4, we present the temperature dependent EDCs from various Fermi crossing points of both bands (see inset) that demonstrate the opening of the superconducting gap below Tc. Due to the simultaneous presence of band N, EDCs at points e and f appear broader and show a hump at higher binding energy. It’s clear that the spectral intensity of both bands is pushed away from Ef in the T=20K data compared to those measured at 80K. The strong temperature dependence suggests the superconducting nature of the energy gaps along both FS sheets at TTc. Furthermore, we find that the gap magnitude is not only FS sheet dependent (e,f vs c.d) but also momentum dependent within each FS sheet (ad; e,f)
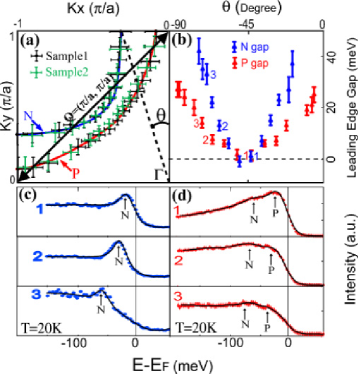
The FS contours and superconducting gaps along them are summarized in Fig.5. To avoid model related complexity, we present the leading edge gapAndrea_review ; ZX_gap along both FS contours. While the leading edge method is known to underestimate the absolute gap magnitude, it does not affect the relative comparison. Fig.5b gives the gap values as a function of k-space angle as defined in Fig.5a; and Fig.5(c,d) show three sample EDCs recorded at 20K along both FS sheets (from which the corresponding gap values in Fig.5b are extracted). From Fig.5b, we see that the gaps along both FS sheets have d-wave symmetry as found in other cuprates; and although the leading edge gap magnitude along the band P FS is comparable to that of purely hole-doped materials such as Bi2212Andrea_review ; ZX_gap , big surprise comes from the gap magnitude of the ”electron-doped” band N FS, which is approximately two times larger than that of its hole-doped counterpart, and an order of magnitude larger than that of purely electron doped materials such as Nd2-xCexCuO4Peter_NCCO ; Sato_NCCO ; Huang . Within the framework of doped Mott insulator, this behavior of the self-doped system contrasts strongly to the established trend of particle-hole asymmetry for superconductivity in purely electron- or hole-doped systems with the n-type materials having much weaker pairing strengthPeter_NCCO ; Sato_NCCO ; Huang . Unlike the Bi2212 system with bi-layer splitting where two FS’ are also observedPasha ; Borisenko_gap , F0234 shows non-degenerated FS’ even along the nodal direction(see Fig. 2(iiii, v), Fig. 5a) and significant gap difference associated with different FS’. The implications of this difference have been discussed elsewhereWenhui . This makes F0234 the first self-doping high Tc superconductor that has a pronounced FS dependence of the superconducting gap.
The substantially larger pairing gap in the energy dispersion along band N FS(see Fig.2,3) strongly hints that the most important pairing force for cooper pairs is distinct from those theories where the van Hove singularity (VHS) near EfMarkiewicz or antiferromagnetic scatteringChubukov are the most important ingredients. As seen in Fig.5a, though band N never and band P does get close to in k-space where the VHS provides a large phase space that can be connected by the scattering vector, band N nevertheless shows much larger gap. On the other hand, the correlation between a stronger kink and a larger gap in band N may imply a connection. While this does not exclude the possibility that VHS and scattering from playing some role in the superconducting pairingOudovenko , our finding strongly suggests that there exists a more important mechanism in this material. On the other hand, our finding is consistent with the empirical trend which indicates that it is the FS’ shape of the most bonding band that correlates with TcPavarini . As an example, HgBa2Ca2Cu3O8, the superconductor with the highest Tc(135K) to date, is predictedSingh to have its most bonding band’s FS similar to that of band N in F0234.
Acknowledgements We thank J. Zaanen, N. Nagaosa and O.K. Andersen for stimulating discussions. The experiments were performed at the ALS of LBNL, which is operated by the DOE’s Office of BES, Division of Material Science, with contract DE-AC03-76SF00098. The division also provided support for the work at SSRL with contract DE-FG03-01ER45929-A001. The work at Stanford was supported by NSF grant DMR- 0304981. T.P.D. acknowledges support from NSERC and ONR grant N00014-05-1-0127.
References
- (1) A. Iyo, Physica C 392-396, 140 (2003).
- (2) A. Iyo, Supercond. Sci. Technol. 17, 143 (2004).
- (3) A. Damascelli, Z. Hussain and Z.-X. Shen, Rev. Mod. Phys. 75, 473 (2003).
- (4) X. J. Zhou, J. Elec. Spect. Rel. Phenom. 142, 27 (2005).
- (5) D. S. Marshall, Phys. Rev. Lett. 76, 4841 (1996)
- (6) H. Ding, Phys. Rev. Lett. 76, 1533 (1996).
- (7) S. V. Borisenko Phys. Rev. Lett. 84, 4453 (2000).
- (8) T. Yoshida, Phys. Rev. Lett. 91, 027001 (2003).
- (9) T. Valla Science 285, 2110 (1999)
- (10) H. Ding Phys. Rev. Lett. 78,2628 (1997).
- (11) D. L. Feng Phys. Rev. Lett. 88,107001 (2002).
- (12) D. L. Feng, Phys. Rev. Lett. 86, 5550 (2001).
- (13) Y. D. Chuang, Phys. Rev. Lett. 87, 117002 (2001)
- (14) W. E. Pickett, Rev. Mod. Phys. 61, 433 (1989).
- (15) O. K. Andersen, J. Phys. Chem. Solids. 56,1573(1995).
- (16) N. Hamada and H. Ihara, Physica C. 357-360, 108 (2001).
- (17) Y. Tokunaga Phys. Rev. B 61,9707 (2000).
- (18) H. Kotegawa, Phys. Rev. B 69,014501 (2004).
- (19) Z.-X. Shen, Phys. Rev. Lett. 70, 1553 (1993).
- (20) P. V. Bogdanov, Phys. Rev. Lett 89, 167002 (2002).
- (21) S. V. Borisenko, Phys. Rev. B 66, 140509 (2002).
- (22) W. Xie, cond-mat/0607198 (2006).
- (23) N. P. Armitage, Phys. Rev. Lett. 86, 1126 (2001).
- (24) T. Sato, Science 291, 1517 (2001).
- (25) Q. Huang, Nature, 347,369 (1990).
- (26) R. S. Markiewicz, J. Phys. chem. Solids. 58,1179 (1997).
- (27) A. Abanov, A. V. Chubukov and J. Schmalian, Adv. Phys. 52,119 (2003).
- (28) V. S. Oudovenko, S. Y. Savrasov and O. K. Andersen, Physica C 336, 157 (2000).
- (29) E. Pavarini, Phys. Rev. Lett. 87,047003 (2001).
- (30) D. J. Singh, Phys. Rev. B. 48, 3571 (1993).