Substrate dependent bonding distances of PTCDA
– A comparative XSW
study on Cu(111) and Ag(111)
Abstract
We study the adsorption geometry of 3,4,9,10-perylene-tetracarboxylic-dianhydride (PTCDA) on Ag(111) and Cu(111) using X-ray standing waves. The element-specific analysis shows that the carbon core of the molecule adsorbs in a planar configuration, whereas the oxygen atoms experience a non-trivial and substrate dependent distortion. On copper (silver) the carbon rings resides Å (Å) above the substrate. In contrast to the conformation on Ag(111), where the carboxylic oxygen atoms are bent towards the surface, we find that on Cu(111) all oxygen atoms are above the carbon plane at Å and Å, respectively.
pacs:
68.49.Uv, 68.43.Fg, 79.60.FrI Introduction
In recent years the adsorption of -conjugated molecules on various surfaces has received significant attention.Eremtchenko et al. (2003); Witte and Wöll (2004) Still, one of the fundamental parameters in the adsorption process, the bonding distance of the first layer to the substrate, is largely unknown for most organic adsorbate systems. Measuring this quantity with the required precision poses a serious experimental challenge which requires specialized methods. As the adsorbate distance of the molecules is closely related to the character of the bond, it is also highly desirable to combine structural and spectroscopic techniques in the experiment. A suitable approach could reveal correlations between the bonding distances and the electronic properties of the adsorbate complex on different surfaces, in particular when the nature of the bonding is controversial.
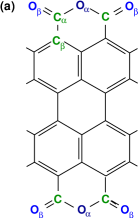
In this context the perylene derivative PTCDA (3,4,9,10-perylene-tetracarboxylic-dianhydride, Fig. 1a) has long been regarded as a model system.Jung et al. (1993); Glöckler et al. (1998); Fenter et al. (1997); Krause et al. (2001, 2004a) In particular, the adsorption of PTCDA on Ag(111) has been studied in detail using different techniques.Krause et al. (2001, 2004a); Tautz et al. (2002); Kilian et al. (2004); Zou et al. (2006) After the average bonding distance of Å on silver had been established by surface X-ray diffractionKrause et al. (2003), X-ray standing wave measurementsHauschild et al. (2005a) provided a refined result. The finding by Hauschild et al.Hauschild et al. (2005a) that the adsorbed molecule exhibits a significant and complex distortion has intensified the interest of experimentalist and theoreticians alike. More recently it was pointed out that the equilibrium distance of PTCDA on Ag(111) derived from density functional calculations deviates notably, i.e. Å, from the experimental bonding distance.Rurali et al. (2005) Regarding the molecular distortion of PTCDA on Ag(111) theoretical results themselves are still controversial.Rurali et al. (2005); Hauschild et al. (2005b)
To broaden the experimental base and provide further much needed benchmarks for calculations, we studied PTCDA monolayers on Cu(111) and Ag(111) using the X-ray standing wave (XSW) technique. The model-free and precise bonding distances, , reported below show interesting patterns, most prominently a non-trivial substrate dependence.
II Experimental Details
II.1 Beamline setup and sample preparation
X-ray standing wave experiments, which depend on the relatively weak photoemission signals from organic adsorbates, require a brilliant and tunable X-ray beam. Therefore, we performed our experiments at the undulator beamline ID32 of the European Synchrotron Radiation Facility (ESRF). Using the first order back-reflections at keV for Ag(111) and keV for Cu(111) we generated the X-ray standing wave field by Bragg reflection. The experimental end-station at ID32, an ultra-high vacuum chamber with a hemispherical electron analyzer (energy resolution ), was adapted for the preparation of organic thin films, see Fig. 1b.
The single crystals, which were mounted on a variable-temperature high-precision manipulator, were cleaned by repeated cycles of argon ion bombardment. After annealing at –K we obtained suitable surfaces as has been verified by X-ray photoelectron spectroscopy (XPS) and low energy electron diffraction (LEED). We evaporated purified PTCDA at typical rates of less than ML/min with the substrate at K, monitoring the process with a quartz crystal microbalance close to the substrate. By heating the samples just below the desorption temperature of the first layer we obtained well-ordered monolayers of PTCDA.
II.2 Substrate characterization
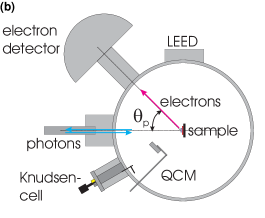
The X-ray reflectivity around the substrate Bragg condition was measured at a small angle relative to the incoming beam (Fig. 2).
Because noble metal crystals exhibit a certain mosaic spread that contributes to the broadening of the Darwin curve, we checked the reflectivity signal to identify suitable positions on the substrate. Given the intrinsic width of the Bragg reflections – eV for Ag(111) and eV for Cu(111) – the experimental reflection curves shown in Fig. 2 illustrate the crystal quality of the chosen surface positions. A least-square fit to the Bragg peaks using dynamical diffraction theory yields the effective standing wave field, i.e. the reflectivity and the phase between the incoming and outgoing wave. Both quantities characterize the substrate and enter directly into the XSW analysis.
III Results and Analysis
III.1 Photoemission analysis
The core-level spectra provide essential information about the molecular and electronic structure of the adsorbate system. Hence we briefly discuss the relevant features in the monolayer and multilayer signals, focusing on the aspects required for the interpretation of the XSW data.
III.1.1 PTCDA monolayer
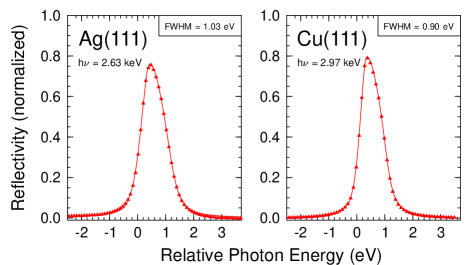
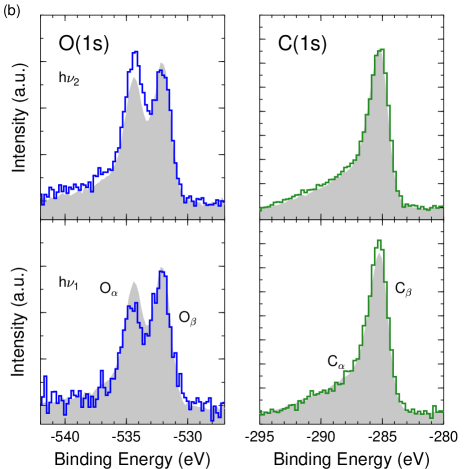
As shown in previous experimental and theoretical studies both the carbon C(1s) and oxygen O(1s) signal consist of several components, which can be related to the molecular structure of PTCDA.Schöll et al. (2004) To obtain a reference spectrum with a low noise level, we added up all background corrected spectra in the XSW series (cf. Fig. 3a). Because of the limited energy resolution in the XSW setup a slightly simplified model adequately explains our experimental line-shapes.
The principal component Cβ at a binding energy of eV in the carbon core-level spectrum is related to excitations from the perylene core of PTCDA. The weaker signal Cα found at higher binding energies originates from the carboxylic carbon atoms. Additional photoemission intensity towards even higher energies can be related to shake-up processes and inelastic background. Similarly, the oxygen core-level spectrum allows to distinguish the chemically inequivalent oxygen atoms in the molecule. The spectrum in Fig. 3a shows two main peaks at eV and eV, which are associated with the anhydride (Oα) and carboxylic oxygen (Oβ). To model the spectrum and preserve the stoichiometric 2:1-ratio of both oxygen components, two corresponding shake-up peaks were included in the analysis.
As illustrated in Fig. 3b the C(1s) signal shows a constant shape throughout the XSW scan, whereas the relative intensity of the oxygen components deviates significantly from the reference spectrum. This observation allows two conclusions regarding the adsorption geometry on Cu(111): First, the carbon core of PTCDA – represented by the Cα and Cβ components – is planar within the experimental resolution. Second, the carboxylic and anhydride oxygen atoms are located at different bonding distances . The full XSW analysis verifying these statements follows further below.
III.1.2 PTCDA multilayer
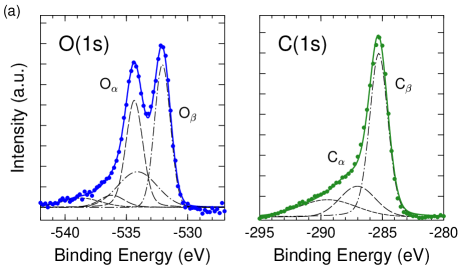
The bonding distance of the first molecular layer is regarded as an important factor influencing the growth of multilayer films.Krause et al. (2002, 2004b) Depending on the strength of the adsorbate interaction thicker films can exhibit important changes in the photoemission spectra. Indeed, a comparison of the monolayer signal with spectra taken on PTCDA multilayers shows significant core-level shifts both for the C(1s) and O(1s) lines on Ag(111), see Fig. 4.
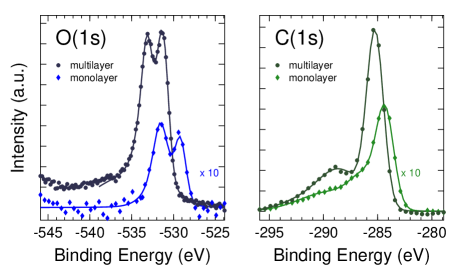
Obviously, the electronic structure within the first layer is strongly affected by the bonding to the metal surface.111Further changes of the core-level signals observed in Fig. 4, e.g. a clearly resolved satellite peak in the C(1s) multilayer spectrum, are beyond the scope of this study. We refer to other more detailed studiesSchöll et al. (2004) on the electronic structure of PTCDA multilayers. The strong substrate-adsorbate interaction of PTCDA on silverTautz et al. (2002); Zou et al. (2006) – presumably accompanied by a charge transfer from the substrate – should not least be evidenced by the bonding distance.
III.2 XSW analysis
III.2.1 XSW fundamentals
The normalized photoelectron yield from the adsorbate atoms, given byZegenhagen (1993); Bedzyk and Cheng (2002); Woodruff (2005)
| (1) |
depends sensitively on the (effective) coherent position and coherent fraction . These parameters contain all structural information to be obtained from the coherently ordered monolayer. Following the procedure described in Ref. Gerlach et al., 2005 we model the observed photoelectron yield with the previously determined reflectivity and phase . A least-square fitting routine then finds the effective parameters and associated with the scattering atoms.
The first-order corrections to the dipole approximationVartanyants and Zegenhagen (2000) included in Eq. (1) are applied, in particular by measuring on multilayers of PTCDA.Schreiber et al. (2001) Finally, we substitute the effective parameters insertingGerlach et al. (2005)
| (2) |
in Eq. (1). Using the well-established - and -values in Tab. 2 we deduce the coherent fraction, , and coherent position, . For molecules in a lying-down configuration the phase enters the ratio of the adsorbate distance and the substrate lattice plane spacing according to . From this equation we obtain model independent resultsCheng et al. (2003) for the bonding distances of individual atomic species.
III.2.2 Bonding distances I
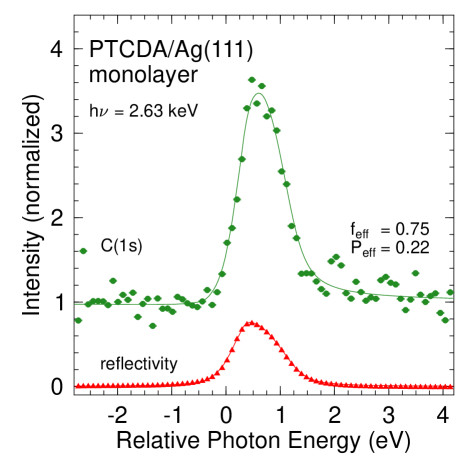
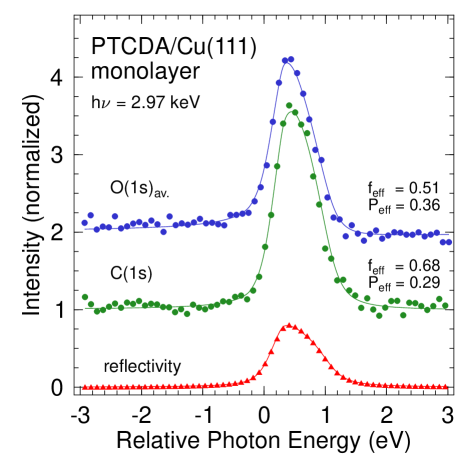
The typical datasets presented in Fig. 5 demonstrate that the adsorption geometry of PTCDA yields standing wave characteristics with a similar overall shape. To determine the precise bonding distances and possible distortions of the molecule therefore requires measurements with a low noise level. Generally, we improve the statistics of our XSW data by adding several scans, each one obtained by integration of the background corrected and normalized photoelectron spectra. Importantly, the XSW yields derived within this approach do not depend on particular assumptions about line shapes and relative intensities of the components. Because of the planar carbon core this averaging procedure conserves the full information of the C(1s) spectra and provides the XSW yield associated with the carbon atoms of PTCDA. Regarding the oxygen signal on the other hand we do not differentiate between the carboxylic and anhydride oxygen and first derive an averaged oxygen position.
The XSW characteristics of PTCDA on Ag(111) and Cu(111) shown in Fig. 5 were analyzed using Eq. (1). The C(1s) data come with large coherent fractions indicating a fairly high order in the monolayer: Least-square fits on silver (copper) yield () and () for the carbon core. The corresponding oxygen result on Cu(111), being and , shows a slightly reduced coherent fraction. For the oxygen result of PTCDA/Ag(111) we refer to Ref. Hauschild et al., 2005a.
| Cu(111) | Ag(111) | |||
|---|---|---|---|---|
| C(1s) | O(1s) | C(1s) | O(1s) | |
| Cu(111) | Ag(111) | |||
|---|---|---|---|---|
| C(1s) | O(1s)av. | C(1s) | O(1s)av.222Taken from Ref. Hauschild et al.,2005a | |
Applying the non-dipolar corrections of Eq. (2) we calculate the corresponding atomic positions as described above – neglecting a possible small relaxation of the outer substrate layers. For the carbon core we find Å on Ag(111) and Å on Cu(111). Remarkably, the oxygen atoms of PTCDA on copper reside at an averaged position of Å, i.e. Å above the central perylene core of the molecule. All structural parameters for PTCDA on Cu(111) and Ag(111) obtained so far are collected in Tab. 2.
To derive meaningful error bars for and see whether the molecular distortion is statistically significant, we performed a detailed confidence analysis. For the XSW datasets shown in Fig. 5 we sampled the parameter space and calculated the -values in the vicinity of the obtained minima. Fig. 6 shows the corresponding confidence levels in the -plane with constant
| (3) |
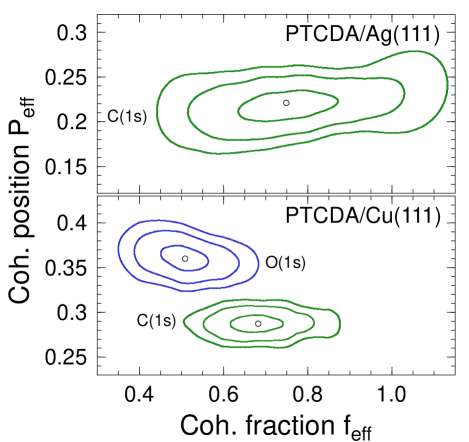
The errors of the XSW yield, that are entering as weighting factors in the -calculation, were derived from the counting statistics of the photoelectron spectra.333Since the signal-to-background ratio of the photoemission spectra can be rather low, the energy dependence of roughly follows the substrate standing wave characteristic. Hence the statistical weight of the data points in the XSW scans varies strongly. We observe well-defined minima for all datasets with an uncertainty depending on the noise in the XSW scans, see Fig. 6. Generally, the errors of the coherent fraction are larger than the corresponding errors of the coherent position, i.e. . Hence the atomic positions can be determined quite precisely and for our data we infer Å (Å) for carbon (oxygen) on copper and Å for carbon on silver. Moreover, the results for PTCDA/Cu(111) in Fig. 6 demonstrate that our finding with the average oxygen position being above the carbon is valid beyond a %-confidence level.
III.2.3 Bonding distances II
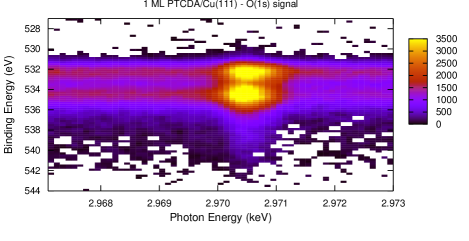
The different distances of both oxygen species in PTCDA/Cu(111) are illustrated by the intensity map in Fig. 7, where relative XPS intensities can be compared. While the carboxylic oxygen Oβ shows a fairly symmetric XSW characteristic, the anhydride oxygen Oα exhibits a rapidly decreasing photoemission yield on the high energy tail of the Bragg peak. This difference reveals that the Oα component has a higher coherent position and is further away from the substrate than the Oβ atoms.
Beyond this qualitative consideration a refined analysis of the photoemission spectra can provide the exact positions of both oxygen species. Yet, separating the Oα and Oβ component is not trivial as strong shake-up states in the core-level spectra complicate the procedure.Hauschild et al. (2005a) Accordingly, we started with the O(1s) sum spectrum to build a model which reproduces the data (cf. Fig. 3a). Good agreement with the experiment was obtained using two chemically shifted main lines – each one with a corresponding shake-up peak eV below – and an additional shake-off peak towards higher binding energies. The individual spectra in the XSW series were analyzed using this model, with the peak amplitudes being the only free parameters. Keeping the relative intensities of the shake-up peak and the main line constant we obtain the XSW yield of the oxygen components in PTCDA/Cu(111). From these separate datasets we derive the coherent positions of for the carboxylic and for the anhydride oxygen, see Fig. 8 for details.
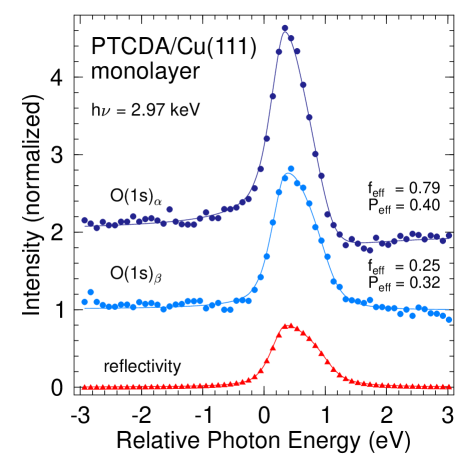
The corresponding bonding distances confirm the distortion of PTCDA on Cu(111) with Å for anhydride oxygen and Å for carboxylic oxygen. This splitting of Å around the averaged oxygen distance Å depends marginally on the fitting model with an estimated error of Å.
IV Discussion
The bonding distances found on Ag(111) and Cu(111) are much smaller than the molecular stacking distance Å measured in PTCDA single crystals. This observation conveys the relatively strong bonding of the molecule to these substrates. A more detailed inspection, however, reveals some remarkable differences between the adsorption of PTCDA on copper and silver as well as between the adsorption of PTCDA and other -conjugated molecules like F16CuPc.Gerlach et al. (2005)
PTCDA/Ag(111) –
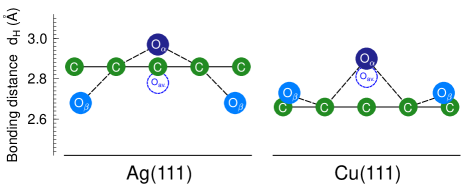
In agreement with previous XSW resultsHauschild et al. (2005a) we measured a carbon distance of Å on Ag(111). Interestingly, this value coincides with the bonding distance derived from the electron density profile of PTCDA multilayer films on Ag(111)Krause et al. (2003), indicating that the distance of the first layer is not markedly affected by the presence (growth) of further layers. As reported in Ref. Hauschild et al., 2005a the average oxygen position is below the carbon core at Å. A significant splitting of Å – with the anhydride oxygen Oα above (Å) and the carboxylic oxygen Oβ below (Å) the carbon plane – is observedHauschild et al. (2005a), see Fig. 9.
PTCDA/Cu(111) –
We found a carbon distance of Å on Cu(111), i.e. a value that is smaller than on silver, but very similar to the result of F16CuPc on copper. In contrast to Ag(111) the average oxygen position on copper is above the carbon core at Å. While the oxygen splitting is qualitatively similar – with the Oα further from substrate than the Oβ component – here both species are Å and Å, respectively, above the carbon plane. Thus, we find a splitting of Å on copper which is only half the value observed on Ag(111).
PTCDA/Au(111) –
X-ray standing wave studies of PTCDA on Au(111) reported recentlyJönsson et al. (2006) gave a carbon distance of Å. Again, this bonding distance agrees with X-ray reflectivity data taken on multilayers of PTCDA/Au(111)Fenter et al. (1997) which implied positions around Å. Thus PTCDA molecules adsorb at comparatively large distances on gold, suggesting a weaker interaction with the substrate. Similar findings made with high-resolution electron energy-loss spectroscopy (HREELS)Eremtchenko et al. (2004) and scanning tunneling microscopy (STM)Nicoara et al. (2006) measurements on Au(111) support this conclusion.
PTCDA vs. F16CuPc –
Most prominently, we find that the substrate dependence of is much smaller for PTCDA than for F16CuPc. While for PTCDA the carbon distances on Ag(111) and Cu(111) differ by only Å, the corresponding difference for F16CuPc is as large as Å. Moreover, in F16CuPc monolayers the fluorine atoms experience an upward bending both on Cu(111) and Ag(111), whereas PTCDA molecules exhibit a molecular distortion that depends on the substrate.
The different molecular distortions of PTCDA on Ag(111) and Cu(111) shown in Fig. 9 cannot easily be explained without extensive theoretical work. The observed differences and similarities on these substrates, however, indicate that the bonding of the molecule to the metal occurs mainly through its carbon core. While the oxygen atoms reside at similar distances relative to the copper and silver substrate, the carbon core is noticeably closer to the Cu(111) surface – as might be expected for the bonding to the smaller copper atoms. Obviously, the different distortion of the molecule should affect the charge distribution within the adsorbate. Indeed, photoemission spectra measured on the valence bands of PTCDA/Ag(111) and PTCDA/Cu(111)Duhm et al. point towards remarkable differences in the electronic structure.
V Summary and Conclusions
By XSW measurements of PTCDA on Cu(111) and Ag(111) we show that the bonding distance and the adsorption geometry, i.e. the bending of the oxygen atoms, depends in a non-trivial way on the substrate.
We hope that our results will stimulate further theoretical work in this area. Calculations on the adsorbate structure of large molecules would greatly promote our understanding of these systems and could also provide new insight in the electronic properties of the organic-inorganic interface.
Acknowledgments
The authors gratefully acknowledge the ESRF for providing excellent facilities, and thank J. Pflaum for purifying the PTCDA material. This work was financially supported by the DFG.
References
- Eremtchenko et al. (2003) M. Eremtchenko, J. A. Schäfer, and F. S. Tautz, Nature 425, 602 (2003).
- Witte and Wöll (2004) G. Witte and C. Wöll, J. Mater. Res. 19, 1889 (2004).
- Jung et al. (1993) M. Jung, U. Baston, G. Schnitzler, M. Kaiser, J. Papst, T. Porwol, H. Freund, and E. Umbach, J. Mol. Struct. 293, 239 (1993).
- Glöckler et al. (1998) K. Glöckler, C. Seidel, A. Soukopp, M. Sokolowski, E. Umbach, M. Bohringer, R. Berndt, and W.-D. Schneider, Surf. Sci. 405, 1 (1998).
- Fenter et al. (1997) P. Fenter, F. Schreiber, L. Zhou, P. Eisenberger, and S. Forrest, Phys. Rev. B 56, 3046 (1997).
- Krause et al. (2001) B. Krause, A. C. Dürr, K. A. Ritley, F. Schreiber, H. Dosch, and D. Smilgies, Appl. Surf. Sci. 175–176, 332 (2001).
- Krause et al. (2004a) B. Krause, F. Schreiber, H. Dosch, A. Pimpinelli, and O. H. Seeck, Europhys. Lett. 65, 372 (2004a).
- Tautz et al. (2002) F. S. Tautz, M. Eremtchenko, J. A. Schäfer, M. Sokolowski, V. Shklover, and E. Umbach, Phys. Rev. B 65, 125405 (2002).
- Kilian et al. (2004) L. Kilian, E. Umbach, and M. Sokolowski, Surf. Sci. 573, 359 (2004).
- Zou et al. (2006) Y. Zou, L. Kilian, A. Schöll, T. Schmidt, R. Fink, and E. Umbach, Surf. Sci. 600, 1240 (2006).
- Krause et al. (2003) B. Krause, A. C. Dürr, F. Schreiber, H. Dosch, and O. H. Seeck, J. Chem. Phys. 119, 3429 (2003).
- Hauschild et al. (2005a) A. Hauschild, K. Karki, B. C. C. Cowie, M. Rohlfing, F. S. Tautz, and M. Sokolowski, Phys. Rev. Lett. 94, 036106 (2005a).
- Rurali et al. (2005) R. Rurali, N. Lorente, and P. Ordejon, Phys. Rev. Lett. 95, 209601 (2005).
- Hauschild et al. (2005b) A. Hauschild, K. Karki, B. C. C. Cowie, M. Rohlfing, F. S. Tautz, and M. Sokolowski, Phys. Rev. Lett. 95, 209602 (2005b).
- Schöll et al. (2004) A. Schöll, Y. Zou, M. Jung, T. Schmidt, R. Fink, and E. Umbach, J. Chem. Phys. 121, 10260 (2004).
- Krause et al. (2002) B. Krause, A. C. Dürr, K. Ritley, F. Schreiber, H. Dosch, and D. Smilgies, Phys. Rev. B 66, 235404 (2002).
- Krause et al. (2004b) B. Krause, A. C. Dürr, F. Schreiber, H. Dosch, and O. H. Seeck, Surf. Sci. 572, 385 (2004b).
- Zegenhagen (1993) J. Zegenhagen, Surf. Sci. Rep. 18, 199 (1993).
- Bedzyk and Cheng (2002) M. J. Bedzyk and L. Cheng, in Rev. Mineral. Geochem. (2002), vol. 49, p. 221.
- Woodruff (2005) D. P. Woodruff, Rep. Prog. Phys. 68, 743 (2005).
- Gerlach et al. (2005) A. Gerlach, F. Schreiber, S. Sellner, H. Dosch, I. A. Vartanyants, B. C. C. Cowie, T.-L. Lee, and J. Zegenhagen, Phys. Rev. B 71, 205425 (2005).
- Vartanyants and Zegenhagen (2000) I. A. Vartanyants and J. Zegenhagen, Solid State Commun. 113, 299 (2000).
- Schreiber et al. (2001) F. Schreiber, K. A. Ritley, I. A. Vartanyants, H. Dosch, J. Zegenhagen, and B. C. C. Cowie, Surf. Sci. Lett. 486, 519 (2001).
- Cheng et al. (2003) L. Cheng, P. Fenter, M. J. Bedzyk, and N. C. Sturchio, Phys. Rev. Lett. 90, 255503 (2003).
- Jönsson et al. (2006) S. K. M. Jönsson, O. Bauer, A. Hauschild, T.-L. Lee, M. Sokolowski, and F. S. Tautz, in Conference proceedings of the DPG spring meeting 2006 (DPG, 2006), no. O 47.1 in Dresden.
- Eremtchenko et al. (2004) M. Eremtchenko, D. Bauer, J. A. Schäfer, and F. S. Tautz, New J. Phys. 6, 4 (2004).
- Nicoara et al. (2006) N. Nicoara, E. Román, J. M. Gómez-Rodríguez, J. A. Martín-Gagoa, and J. Méndez, Organic Electronics 7, 287 (2006).
- (28) S. Duhm, N. Koch, A. Gerlach, and F. Schreiber, to be published.