Infrared and THz studies of polar phonons and improper magnetodielectric effect in multiferroic BiFeO3 ceramics
Abstract
BiFeO3 ceramics were investigated by means of infrared reflectivity and time domain THz transmission spectroscopy at temperatures 20 - 950 K and the magnetodielectric effect was studied at 10 - 300 K with the magnetic field up to 9 T. Below 175 K, the sum of polar phonon contributions into the permittivity corresponds to the value of measured permittivity below 1 MHz. At higher temperatures, a giant low-frequency permittivity was observed, obviously due to the enhanced conductivity and possible Maxwell-Wagner contribution. Above 200 K the observed magnetodielectric effect is caused essentially through the combination of magnetoresistance and the Maxwell-Wagner effect, as recently predicted by Catalan (Appl. Phys. Lett. 88, 102902 (2006)). Since the magnetodielectric effect does not occur due to a coupling of polarization and magnetization as expected in magnetoferroelectrics, we call it improper magnetodielectric effect. Below 175 K the magnetodielectric effect is by several orders of magnitude lower due to the decreased conductivity. Several phonons exhibit gradual softening with increasing temperature, which explains the previously observed high-frequency permittivity increase on heating. The observed non-complete phonon softening seems to be the consequence of the first-order nature of the ferroelectric transition.
pacs:
75.80.+q; 78.30.-j; 63.20.-e;77.22.-d; 73.43.QtI Introduction
BiFeO3 belongs to multiferroic magnetoelectrics, because it exhibits simultaneously ferroelectric and antiferromagnetic order. This is known already since the beginning of the 1960’s, but the interest to this material underwent a revival after the pioneering work of Wang at al.wang03 , who revealed the spontaneous polarization almost by an order of magnitude higher and substantially higher magnetization in BiFeO3 thin film compared to the bulk samples. Very recently, these results were questioned, eerenstein05 but some other experiments support the former results.wang05 Recently many scientists paid their attention to magnetoelectric materials not only because of the rich and fascinating fundamental physics (see reviews smolenskii82 ; fiebig05 ), but also because of the promising potential applications in multiple-state memory elements.
A ferroelectric phase transition from the cubic to rhombohedral R3c phasekubel90 occurs in BiFeO3 at T 1120 K, and an antiferromagnetic ordering appears below the Néel temperature T 640 K. BiFeO3 is slightly electrically conducting, which prevents to study its dielectric properties like polarization and dielectric permittivity at room and higher temperatures. The ferroelectric hysteresis curve is well pronounced only at low temperatures below 100 K, but the observed spontaneous polarization PS = 6.1.10-2 C cm-2 is much lower than expected from the high Tc and large lattice distortion.teaque70 We note that smaller PS could be a natural consequence of the improper nature of ferroelectricity evidenced by the doubling of the primitive unit cell at the phase transition which was also confirmed by the first principle calculation. wang03 Recent measurements wang03 ; yun04 ; singh06 performed on thin films revealed PS by one order of magnitude higher, which was explained by a different ferroelectric structure, namely the tetragonal structure without the cell doubling (proper ferroelectric transition). Nevertheless, there is still an open question if it is not an artifact due to a higher conductivity in somewhat reduced thin films, as suggested by Eerenstein et al.eerenstein05 Temperature dependence of the bulk permittivity was investigated above room temperature (RT) only in the high-frequency and microwave range,roginskaya66 ; krainik66 , where the conductivity does not prevent the permittivity measurements. Gradual increase in permittivity from 40 (at RT) to 130 near TC was observed at 10 GHz,krainik66 , but the permittivity was measured only up to close above TC.
Lattice dynamics of BiFeO3 was investigated only recently by means of Raman scattering.singh05 ; singh06b ; haumont06 It was revealed that the Raman active phonons abruptly disappear near TC, which supports the first-order nature of the PT.haumont06 Phonon anomalies were discovered near TN, but no strong phonon softening was observed near TC. Therefore Haumont et al.haumont06 suggested that the ferroelectric PT in BiFeO3 is not soft-mode driven. Factor group analysis of the lattice vibrations in the structure with two formula units per unit cell (Z=2) yields the following optic phonons
| (1) |
It means that 4 and 9 modes are both Raman and infrared (IR) active, while 5 modes are silent. The paraelectric phase with Z=1 gives rise to 3 only IR active modes and one silent mode:
| (2) |
This explains the vanishing of phonons from the Raman spectra above TC.haumont06
IR spectra of BiFeO3 were not yet investigated. We found only one brief report in the literature about IR spectra of Bi1-xLaxFeO3 powders measured only at room temperature.kaczmarek75 The aim of this work is to study the temperature dependence of polar modes, including their contribution into permittivity, and compare it with the experimental low-frequency permittivity. We will show that the observed increase in the intrinsic permittivity on heating is due to the gradual phonon softening without additional dielectric dispersion between the THz and MHz range. The revealed incomplete phonon softening towards TC will be assigned to the first order nature of the ferroelectric transition. Above 175 K, the effective permittivity gains giant values due to the enhanced conductivity and Maxwell-Wagner effect.
Influence of the magnetic field on the dielectric permittivity (magnetodielectric effect) will be investigated up to 9 T between 10 and 300 K and we will show, that the magnetodielectric effect in BiFeO3 is not a consequence of coupling of spontaneous polarization and magnetization but due to combination of magnetoresistence and the Maxwell-Wagner effect, how it was recently theoretically proposed by Catalan.catalan06
II Experimental
BiFeO3 powders were prepared by conventional solid-state reaction using high-purity (better than 99.9%) Bi2O3 and Fe2O3 as starting compounds. After mixing in stoichiometric proportions, powders were calcined at 850C for 2h, uniaxially cold pressed, and sintered at 880C for 2h, similarly to the synthesis proposed by Wang at al.wang04 At the end of the procedure, we obtained almost a pure perovskite phase of BiFeO3. Our XRD analysis revealed only one very tiny pattern of Bi2O3 giving the evidence that the concentration of the second phase is less than 4%. Such concentration cannot have significant influence on the IR spectra. The ceramics were slightly porous (less than 5%), therefore the reflectivity above 250 could be slightly reduced by diffuse scattering on the surface roughness. Nevertheless, such imperfections cannot appreciably influence the phonon frequencies and their relative changes with temperature, which are the main tasks of our studies.
Dielectric response of BiFeO3 ceramics was investigated from 10 K to 700 K using an impedance analyzer HP 4192A (100 Hz-1 MHz). The magnetoelectric effects were determined by measuring the changes of permittivity and resistivity with magnetic fields up to 9 T (PPMS, Quantum design) at temperatures 10 - 300 K. The measurements were performed at frequency 1 kHz with ultra-precision capacitance bridge Andeen-Hagerling 2500A. The same ceramic disk with diameter of 7.3 mm and thickness of 0.78 mm was used in both studies with and without magnetic field.
Measurements at THz frequencies from 3 cm-1 to 60 cm-1 (0.09 - 1.8 THz) were performed in the transmission mode using a time-domain THz spectrometer based on an amplified femtosecond laser system. Two ZnTe crystal plates were used to generate (by optic rectification) and to detect (by electro-optic sampling) the THz pulses. Both the transmitted field amplitude and phase shift were simultaneously measured; this allows us to determine directly the complex dielectric response . An Optistat CF cryostat with thin mylar windows (Oxford Inst.) was used for measurements down to 10 K. For sample heating up to 900 K, we used an adapted commercial high-temperature cell (SPECAC P/N 5850) with 1 mm thick sapphire windows. Because of the high THz absorption, the sample was a plane-parallel plate (diam. 7 mm) of only 46 m thickness.
IR reflectivity spectra were obtained using a Fourier transform IR spectrometer Bruker IFS 113v in the frequency range of 20 - 3000 cm-1 (0.6 -90 THz) above RT, at lower temperature the reduced spectral range up to 650 cm-1 was investigated since this is the transparency range of the polyethylene windows of our cryostat. Pyroelectric deuterated triglycine sulfate detectors were used for the room and higher temperature measurements, while more sensitive He-cooled (1.5 K) Si bolometer was used for the low-temperature measurements. Commercial high-temperature sample cell (SPECAC P/N 5850) was used for the high-temperature experiments up to 950 K. No windows were needed because the cell was placed in the vacuum chamber of the spectrometer. Thermal radiation entering the interferometer from the hot sample was taken into account in our spectra evaluation, but it also enhanced the noise in the spectra especially below 100. Polished disk-shaped samples with a diameter of 8 mm and thickness of 0.8 mm were used.
III Results and evaluations
III.1 Infrared and THz studies
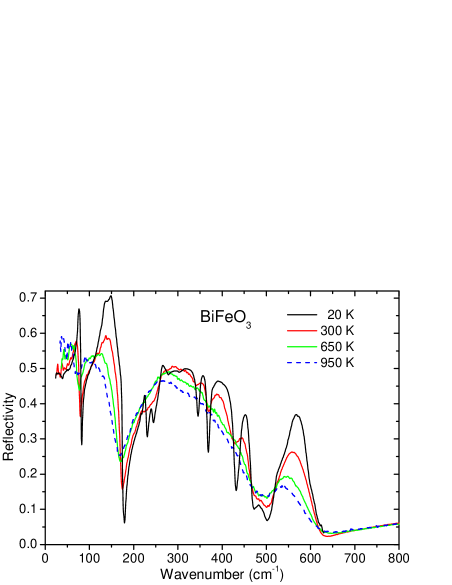
Experimental IR reflectivity spectra of BiFeO3 plotted at selected temperatures between 20 and 950 K are shown in Fig. 1. 13 reflection bands are well resolved at 20 K, which exactly agrees with the predicted number of IR active modes in the rhombohedral phase (see Eq 1). Most of the phonons gradually weaken on heating because the strengths of the newly activated modes in the rhombohedral phase are proportional to the square of the order parameter petzelt76 . Simultaneously dampings of all modes increase on heating. Both these effects cause that apparently only four IR reflection bands are resolved at 950 K (see Fig. 1) although actually still 13 modes are needed for the reflectivity fit up to the highest temperature (see the fitting method below). One can expect that the strength of most modes will further gradually decrease on heating above 950 K and stepwise vanish at Tc 1120 K due to the first order phase transition into the cubic phase, where only 3 polar modes are permitted by symmetry.
IR and THz spectra were fitted simultaneously using a generalized-oscillator model with the factorized form of the complex permittivity:gervais83
| (3) |
where and denotes the transverse and longitudinal frequency of the j-th polar phonon, respectively, and TOj and LOj denotes their corresponding damping constants. ∗() is related to the reflectivity R() by
| (4) |
The high-frequency permittivity resulting from the electronic absorption processes was obtained from the room-temperature frequency-independent reflectivity tails above the phonon frequencies and was assumed temperature independent.
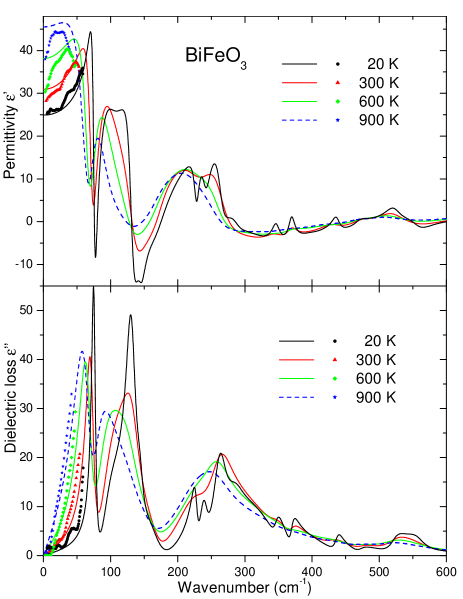
Real and imaginary parts of () obtained from the fits to IR reflectivity are shown together with the experimental THz spectra in Fig. 2. The high-temperature THz data do not exactly correspond to the fit of reflectivity mainly due to possible inaccuracy of the THz experiment as a consequence of possibly different temperature of the sapphire windows in the furnace during the separate reference and sample measurements. Nevertheless, one can see the frequency shift (softening) in the maxima of dielectric-loss spectra (”) with increasing temperature. Since the ”() maxima correspond to frequencies (for not too-heavily damped modes), one can see that most of the polar phonons soften on heating. The phonon softening causes an gradual increase in the static permittivity with increasing temperature (see Fig. 3) because the sum of all the oscillator strengths is expected to be practically temperature independent:
| (5) |
denotes the contribution of the j-th mode to static permittivity and can be obtained from the formulagervais83
| (6) |
Eq. 5 is expected to be fulfilled on very general basis of summation rulessmith85 and in the case of uncoupled phonons even each oscillator strength remains temperature independent (i.e. ). It means that if e.g. the j-th phonon frequency reduces twice its frequency , its dielectric strength increases four times. Partial softening of two lowest frequency modes from 76 and 99 at 20 K to 67 and 82 at 900 K, respectively, explains the observed rise in permittivity on heating (Fig. 3) similarly as the Cochran-type softening explains the Curie-Weiss anomaly near the ferroelectric PT in proper displacive ferroelectrics. Fig. 3 shows that the static permittivity from phonon contributions continuously increases almost linearly with temperature. Experimental value of obtained above 600 K slightly deviates from the linear fit (see Fig. 3), but it is difficult to claim that it is due to spin-phonon interaction which disappears above the Néel temperature (TN 640 K), because the deviation from the linear fit lies within the limits of our experimental accuracy. Nevertheless, there are some other experimental evidences (e.g. measurement of temperature dependence of the rhombohedral angle around TN)palewicz06 suggesting a strong spin-lattice coupling.

Let us compare the static permittivity in Fig. 3 with the published 300 MHzroginskaya66 and 10 GHzkrainik66 dielectric data. Our values of ’(T) in Fig. 3 correspond to 300 MHz data.roginskaya66 Krainik at al.krainik66 observed slightly higher ’(T), but the 10 GHz high-temperature experiment is rather complicated and of lower accuracy, therefore we believe more to the 300 MHz data, which correspond well to ours. Small dielectric anomaly seen at TC in Ref. krainik66 is compatible with the improper ferroelectric nature of the PT due to the doubling of unit cell kubel90 below TC. The non complete phonon softening of two lowest frequency modes (obtained from our IR spectra taken below 950 K by extrapolation of phonon frequencies to TC) can be explained by the probably strongly first-order nature of the ferroelectric transition in BiFeO3.
| infrared spectra | Raman spectra | |||||
|---|---|---|---|---|---|---|
| crystalhaumont06 | filmsingh06b | symmetry | ||||
| 71.9 | 14.3 | 77.6 | 7.0 | 56.1, 84.1 | E | |
| 99.4 | 57.1 | 122.3 | 91.6 | 95.3 | E | |
| 134.6 | 34.1 | 152.0 | 53.1 | 127.1, 141.4 | 136 | A1 |
| 170.3 | 44.2 | 171.4 | 11.8 | 162.9 | 168 | A1 |
| 228.0 | 52.9 | 236.3 | 45.6 | 204.6 | 212 | A1 |
| 262.8 | 43.4 | 272.0 | 81.7 | 261.3 | 275 | E |
| 310.5 | 164.4 | 342.5 | 30.6 | 316.6 | 335 | E |
| 345.1 | 33.1 | 367.4 | 14.8 | 363 | E | |
| 369.2 | 13.2 | 426.4 | 32.5 | 383.6 | E | |
| 433.1 | 34.3 | 466.7 | 25.2 | 425 | A1 | |
| 472.5 | 34.6 | 499.6 | 50.5 | 456 | E | |
| 521.1 | 45.7 | 532.8 | 116.1 | 530.9 | 549 | E |
| 554.9 | 73.3 | 603.5 | 57.7 | 597 | E | |
Let us compare the phonon frequencies observed at RT IR spectra of ceramics with Raman modes observed in single crystalhaumont06 and thin filmsingh06b (see Table 1). Haumont et al.haumont06 observed two modes in Raman spectra below 85, while in IR spectra we clearly see only one mode near 72. We think that the lower-frequency Raman mode might be artifact of the filter removing the elastic peak from the Raman spectra. All TO modes predicted from the factor group analysis are seen in our IR spectra, but some of the modes are missing in Raman spectra, presumably due to their low Raman activity. The Raman mode frequencies in thin films are slightly shifted against the modes seen in single crystal, possibly due to a strain effect in the film. Polarized Raman spectra of the thin film allowed to assign the symmetry of some modes,singh06b and our assignment in table I is extended to all the observed modes. The lowest-frequency E and A1 modes probably represent the soft mode doublet stemming from the triply degenerate soft mode from the Brillouin zone boundary (IR and Raman inactive) in the cubic phase.
Raman modes do not exactly correspond to the IR TO mode frequencies. It is known that the grain boundaries in ceramics may cause stiffening of the soft mode in comparison with single crystal due to a small-permittivity grain-boundary layer (so called dead layer), but such effect is remarkable only in the case of high-permittivity materials (i.e. with a strong soft mode at low frequencies). Typical example of such ceramics, where the stiffening of the soft mode was observed, is SrTiO3.petzelt06 Using effective medium approximation, Rychetsky and Petzelt have shownrychetsky04 that all polar phonon frequencies should exhibit an increase with the grain boundary concentration, and the shift of the TO phonon frequency squared should be proportional to the dielectric strength of the mode. Since the usual polar modes have much lower dielectric strengths than the soft mode, their shift should be much lower than that of the soft mode. The phonons contribute less than 50 to the relative permittivity of BiFeO3 while in SrTiO3 they contribute more than 20000 at low temperatures. Therefore the effect of the mode stiffening due to the grain boundaries in BiFeO3 should be small and insignificant for explanation of differences between the TO phonon frequencies in ceramics and single crystals.
The problem of the mode frequency determination in the case of dielectrically anisotropic grains (in ceramics or polycrystalline films) or domains (in polydomain crystals) is more relevant in our case of BiFeO3 . The proper way how to evaluate the IR reflectivity spectra in such a case is also through using the effective medium approximation, if the grain (domain) size is much smaller than the probing wavelength. pecharroman94 ; hlinka06 This approach may effectively shift the TO mode frequencies and may cause also some spurious peaks (so called geometrical resonances) in the reflectivity. In our case of standard fits using the Eq. 3, which neglect this problem, the determined TO frequencies may slightly differ from the actual E and A1 mode frequencies. Moreover it becomes clear that the corresponding LO frequencies have no real physical meaning at all (neglecting damping, they correspond to zeros of the effective dielectric function, but not to zeros of the dielectric functions along the principal axes of the dielectric ellipsoid), as well as the mode strengths and probably also the dampings. On the other hand, also in Raman spectra the peaks do not correspond necessarily accurately to TO and LO frequencies, but may lay in between due to the angular dispersion of the polar modes. In this way, some differences between the evaluated IR and Raman modes in polycrystalline samples with dielectrically anisotropic grains are quite naturally to be expected.
III.2 Dielectric and magnetodielectric studies
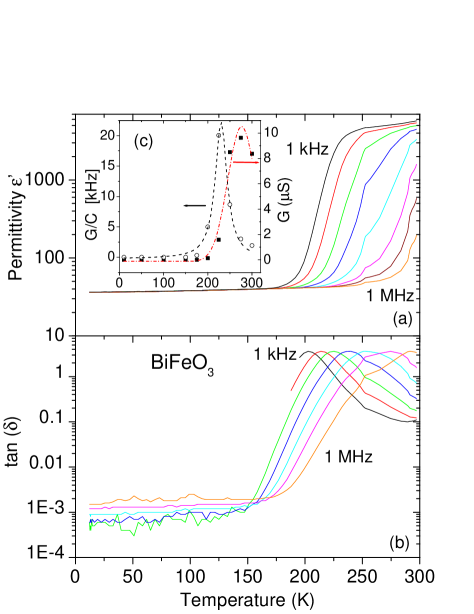
We measured also the complex permittivity in the range below 1 MHz, however the results show the intrinsic permittivity only below 170 K (see Fig. 4). At higher temperatures both ’ and remarkably rise, presumably due to a Maxwell-Wagner-type contribution to the permittivitycohen03 ; liu05 as a consequence of the increased conductivity and its inhomogeneity in the sample (see Fig. 4c). Intrinsic ’ with the value below 40 is dispersion-less at low temperatures and ’ slightly increases on heating due to the above mentioned phonon softening. Within the accuracy of measurement, the value of ’ corresponds to Fig. 3 as well as to previously published high-frequency data.roginskaya66 ; krainik66 It means that no dielectric relaxation is expected between the kHz and THz range below 175 K. Some authors observed twice higher ’ in BiFeO3 ceramicsjun05 and thin filmsyun04 ; uchida06 at RT, but this might be influenced by a Maxwell-Wagner contribution or by the substrate induced strain in the thin film.
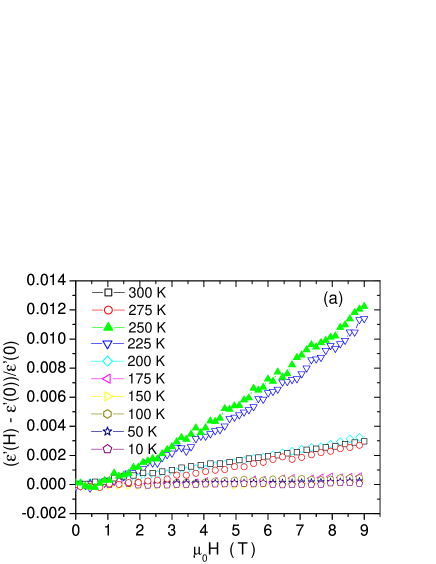

Magnetoferroelectric materials should exhibit changes of the spontaneous polarization and permittivity with magnetic field.smolenskii82 Nevertheless, it was found that the linear magnetoferroelectric effect should not take place in BiFeO3 due to its cycloidal antiferromagnetic structure of the G-type. The linear magnetoferroelectric effect was observed only above 20 T, due to unwinding of the cycloidal magnetic ordering in high magnetic fields.popov93 However, Fig. 5a shows some non-zero variation of the permittivity with magnetic field up to 9 T. No giant changes (like in TbMnO3kimura03 ) were observed, but the changes at 250 and 225 K are one order of magnitude larger than in recently studied Nb-doped BiFeO3 ceramics,jun05 which exhibits six orders of magnitude lower conductivity than our BiFeO3 ceramics. However, above 250 and below 200 K the magnetodielectric effect dramatically decreases and below 175 K, i.e. in the temperature range where the Maxwell-Wagner mechanism does not contribute to the permittivity, the magnetodielectric effect is very low ( 10-5). Simultaneously, Fig. 5b shows that the conductance of BiFeO3 is dependent on the magnetic field. The changes are not very large, but since we measure the effective conductance, from our measurement at a single frequency we cannot distinguish the conductance of grain bulk and grain boundaries (as well as their changes with magnetic field), which probably differ. In this case the impedance spectroscopywest97 in a wide frequency and temperature range should be used, which will be the subject of our next study.
It becomes clear that the strong magnetodielectric effect seen in Fig. 5a above 200K is a consequence of a combination of the magnetoresistance and Maxwell-Wagner effect, as recently proposed by Catalan.catalan06 In his model it is assumed that the grain boundaries and/or interfacial layers between the sample and electrodes may show different resistivity and magnetoresistance than the grain bulk. This model predicts the maximal magnetodielectric effect around the frequency (R - resistivity, C - capacity, G - conductance).catalan06 Fig. 4c shows the maximum of 22 kHz at 228 K in good agreement with the maximal permittivity change with magnetic field observed at 1 kHz between 225 and 250 K (Fig. 5a).
Our explanation of the observed magnetodielectric effect in BiFeO3 shows that the change of permittivity with magnetic field occurs in BiFeO3 not due to coupling of spontaneous polarization and magnetization, as expected in magnetoferroelectrics, but due to a combination of the magnetoresistance and Maxwell-Wagner effect. Therefore we suggest to call this effect improper magnetodielectric effect. Similar effect can be seen also in other non-ferroelectrics magnetoresistive materials.
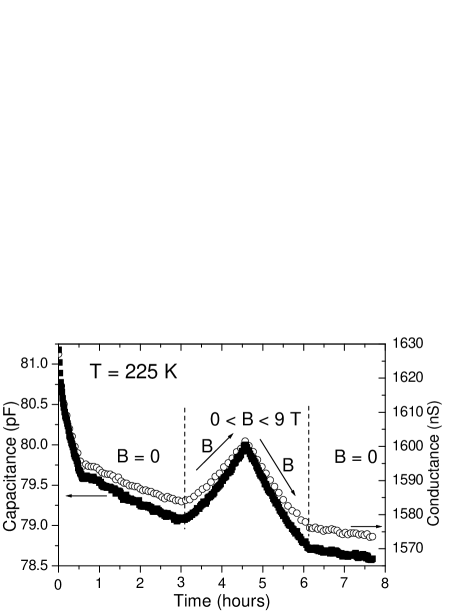
We have to stress that our data on magnetodielectric effect were obtained always after 3 hours of temperature stabilization, because a slow temporal relaxation of capacitance and conductance was unexpectedly observed at all investigated temperatures. Such an aging deteriorated the magnetodielectric measurements if we started only several minutes after setting the measurement temperature. The aging was most remarkable above 200 K, i.e. in the temperature range where the Maxwell-Wagner effect becomes important. Example at 225 K is seen in Fig. 6, which shows that even two relaxation processes contribute to the temporal change of capacitance and conductance. The first fast process causes the steep decrease in capacity during the first half an hour, while the second process is remarkable even after 7 hours and the relaxation continues also after applying the magnetic field. One could e.g. speculate that the two relaxations are caused by two types of interfaces (grain boundaries and dielectric-electrode interfaces). However, the question arises if the temperature drifts cannot influence such a behavior. As the conductance steeply changes by three orders of magnitudes between 275 and 175 K (from 9.6 S to 6.1 nS - see Fig. 4c), some small change of C or G could be expected if the sample temperature is drifting in the mK scale. However, the sample was placed in the He gas, which provides a good thermal contact and therefore no temperature drifts are expected in the long-time scale of our measurements. But we cannot exclude that the faster relaxation (first half an hour) is due to the temperature stabilization. Slow-time relaxation should be assigned to some slow diffusion of defect charges, but detailed understanding is missing. It is worth to note that some long-time relaxations of capacitance and resistivity were observed also in other systems.nalbach04 ; skrbek96 A study of these phenomena is in progress.
IV Conclusion
THz and IR spectra obtained between 20 and 950 K revealed a remarkable lattice softening, which explains the experimentally observed increase in permittivity on heating. The number of observed polar phonons corresponds to that predicted by the factor group analysis. Strengths of the most modes gradually decrease on heating, because only 3 polar modes are permitted in the cubic phase above 1120 K. IR phonon frequencies were compared with the Raman spectra and the phonon symmetries were assigned. Possible differences between the IR and Raman frequencies are discussed. Non-complete phonon softening towards TC was observed and explained by the first-order nature of the ferroelectric transition. The observed magnetodielectric effect and giant low-frequency permittivity at temperatures above 200 K was explained by combination of the magnetoresistance and Maxwell-Wagner effect. Unexpected slow temporal relaxation of capacitance and conductance was observed.
Finally it should be stressed that the magnetodielectric effect in BiFeO3 ceramics is not caused by a coupling of polarization and magnetization as expected for magnetoferroelectric multiferroics. Since it is caused by combination of magnetoresistance and Maxwell-Wagner polarization effect, we call it improper magnetodielectric effect. Similar magnetodielectric effect can be expected also in nonferroelectric slightly conducting materials with large magnetoresistance.
Acknowledgements.
The work was supported by the Grant Agency of the Czech Republic (Projects No. 202/06/0403, 106/06/0368 and AVOZ10100520). The authors would like to thank P. Kužel and S. Denisov for the technical help with the experiments and to J. Hejtmánek for fruitful discussions.References
- (1) J. Wang, J. B. Neaton, H. Zheng, V. Nagarajan, S.B. Ogale, B. Liu, D. Viehland, V. Vaithyanathan, D.G. Schlom, U.V. Waghmare, N.A. Spaldin, K.M. Rabe, M. Wuttig, and R. Ramesh, Science 299, 1719 (2003).
- (2) W. Eerenstein, F.D. Morrison, J. Dho, M.G. Blamire, J.F. Scott, N.D. Mathur, Science 307, 1203a. (2005).
- (3) J. Wang, A. Scholl, H. Zheng, S.B. Ogale, D. Viehland, D.G. Schlom, N.A. Spaldin, K.M. Rabe, M. Wuttig, L. Mohaddes, J. Neaton, U. Waghmare, T. Zhao and R. Ramesh, Science 307, 1203b (2005).
- (4) G. A. Smolenskii and I. Chupis, Sov. Phys. Usp. 25, 475 (1982).
- (5) M. Fiebig, J. Phys. D: Appl. Phys. 38, R123 (2005).
- (6) F. Kubel and H. Schmid, Acta Cryst. B46, 698 (1990).
- (7) J. R. Teaque, R. Gerson, and J. W. James, Sol. State Commun., 8, 1073 (1970).
- (8) K. Y. Yun, M. Noda, M. Okuyama, H. Saeki, H. Tabata, K. Saito, J. Appl. Phys. 96, 3399 (2004).
- (9) S. K. Singh, H. Ishiwara and K. Maruyama, Appl. Phys. Lett. 88, 262908 (2006).
- (10) Yu. E. Roginskaya, Yu. Ya. Tomashpolskii, Yu. N. Venevtsev, V. M. Petrov, G. S. Zhdanov, Zhurn. Exper. i Teor. Fiz. 50, 69 (1966).
- (11) N. N. Krainik, N. P. Khuchua, V. V. Zhdanova, I. E. Mylnikova and N. N. Parfenova, in Proc. of Intern. Meeting on Ferroelectricity, Prague, 1966, Vol. 1, p. 377.
- (12) M. K. Singh, S. Ryu, and H. M. Jang, Phys. Rev. B 72, 132101 (2005).
- (13) M. K. Singh, H. M. Jang, S. Ryu, and M.-H. Jo, Appl. Phys. Lett. 88, 042907 (2006).
- (14) R. Haumont, J. Kreisel, P. Bouvier, and F. Hippert, Phys. Rev. B 73, 132101 (2006).
- (15) W. Kaczmarek and A. Graja, Sol. State Commun. 17, 851 (1975).
- (16) G. Catalan, Appl. Phys. Lett. 88, 102902 (2006).
- (17) Y. P. Wang, L. Zhou, M.F. Zhang, X. Y. Chen, J-M. Liu, Z.G. Liu, Appl. Phys. Lett. 84 (10), 1731 (2004).
- (18) J. Petzelt and V. Dvořák, J. Phys. C 9, 1571 (1976).
- (19) F. Gervais, in Infrared and Millimeter Waves, vol. 8, ed. K. J. Button (New York: Academic) chapter 7, p. 279
- (20) D.Y. Smith, Dispersion Theory, Sum Rules, and Their Application to the Analysis of Optical Data, p. 35 in Handbook of Optical Constants of Solids, Ed. E.D. Palik, Academic Press, Inc., London 1985.
- (21) A. Palewicz, T. Szumiata, R. Przenioslo, I. Sosnowska, I. Margiolaki, Sol. State. Commun. 140, 359 (2006).
- (22) J. Petzelt, T. Ostapchuk, I. Gregora, M. Savinov, d. Chvostova, J. Liu, Z. Shen, J.Eur. Ceram. Soc. 26, 2855 (2006).
- (23) I. Rychetsky and J. Petzelt, Ferroelectrics 303, 137 (2004).
- (24) M. H. Cohen, J. B. Neaton, L. He, and D. Vanderbilt, J. Appl. Phys. 94, 3299 (2003).
- (25) J. Liu, Ch. Duan, W.N. Mei, R.W. Smith, J.R. Hardy, J. Appl. Phys. 98, 093703 (2005).
- (26) Y.-K. Jun, W.-T. Moon, Ch.-M. Chang, H.-S. Kim, H. S. Ryu, J. W. Kim, K. H. Kim, S.-H. Hong, Sol. State Commun. 135, 133 (2005).
- (27) H. Uchida, R. Ueno, H. Funakubo, S. Koda, J. Appl. Phys. 100, 014106 (2006).
- (28) Yu.F. Popov, A.K. Zvezdin, G.P. Vorobvev, A.M. Kadmtseva, V.A. Marushov, and D.N. Rakov, JETP Lett. 57, 69 (1993).
- (29) T. Kimura, T. Goto, H. Shintani, K. Ishizaka, T. Arima, and Y. Tokura, Nature 426 55 (2003).
- (30) A.R. West, D.C. Sinclair, and N. Hirose, J. Electroceramics, 1, 65 (1997).
- (31) C. Pecharroman and J. E. Iglesias, Phys. Rev. B 49, 7137.
- (32) J. Hlinka, J. Petzelt, S. Kamba, D. Noujni, and T. Ostapchuk, Phase Transitions 79, 41 (2006).
- (33) P. Nalbach, D. Osheroff, and S. Ludwig, J. Low Temp. Phys. 167, 395 (2004).
- (34) L. Skrbek, J. Stehno, J. Šebek, J. Low Temp. Phys. 103, 209 (1996).